Market Overview
| Study Period | 2020 - 2031 |
|---|---|
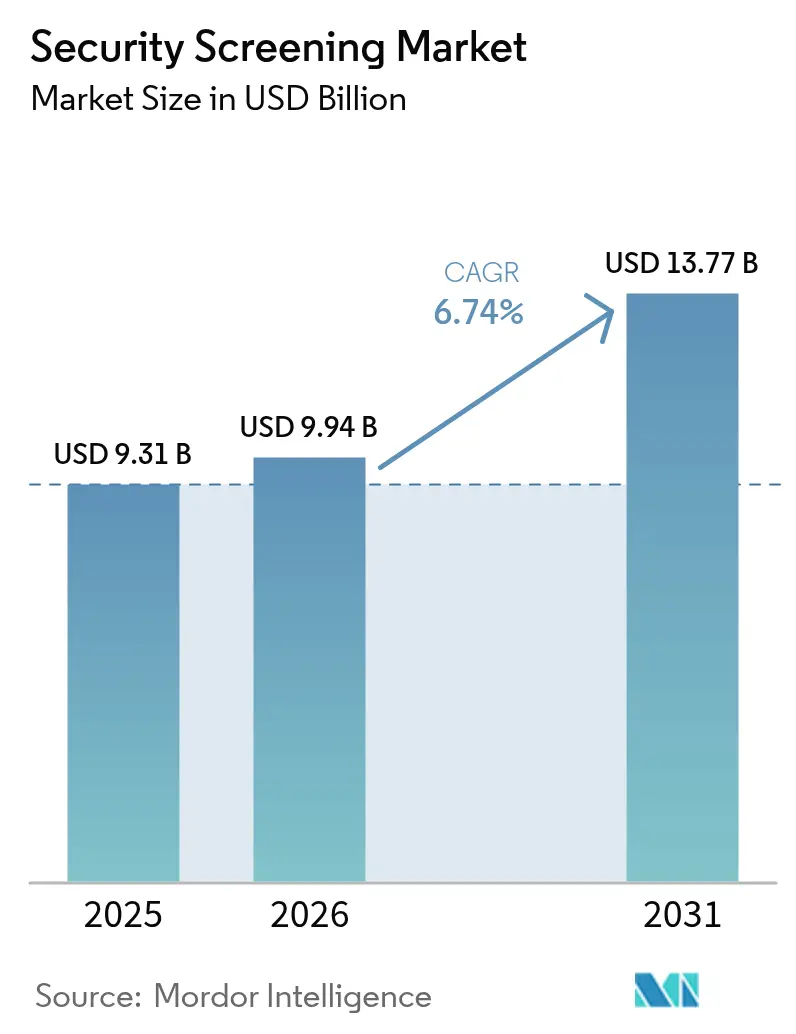
| Market Size (2026) | USD 9.94 Billion |
| Market Size (2031) | USD 13.77 Billion |
| Growth Rate (2026 - 2031) | 6.74% CAGR |
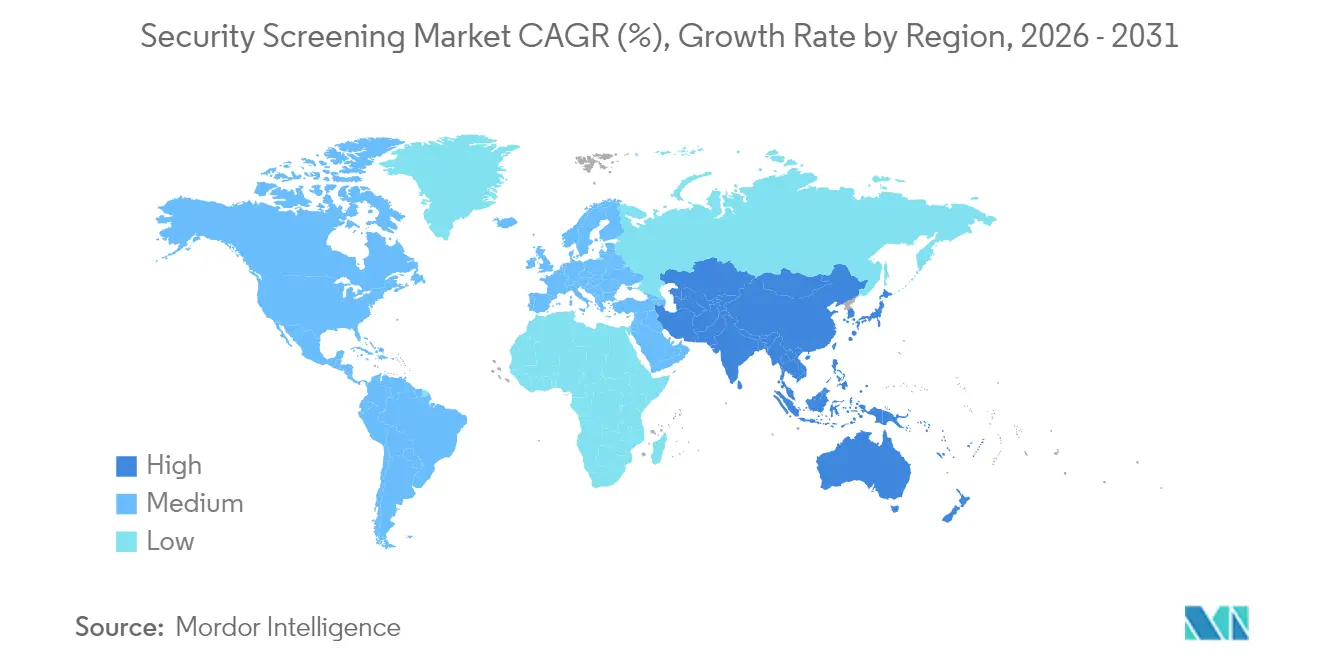
| Fastest Growing Market | Asia Pacific |
| Largest Market | North America |
| Market Concentration | Medium |
Major Players *Disclaimer: Major Players sorted in no particular order Image © Mordor Intelligence. Reuse requires attribution under CC BY 4.0. | |
Security Screening Market Analysis by Mordor Intelligence
The security screening market size in 2026 is estimated at USD 9.94 billion, growing from 2025 value of USD 9.31 billion with 2031 projections showing USD 13.77 billion, growing at 6.74% CAGR over 2026-2031. Sustained government procurement programs, aviation traffic recovery, and rising geopolitical tensions anchor demand for advanced detection equipment. Convergence of millimeter-wave imaging with 5G backbones enables real-time analytics, while AI-enhanced computed tomography (CT) reduces false alarms and accelerates passenger throughput, prompting airports to upgrade legacy X-ray lanes. Border agencies are adopting mobile units to counter drone-borne contraband, and critical infrastructure operators are integrating cyber monitoring with physical screening to mitigate blended threats. Supply-chain pressure on rare-earth magnets and semiconductors may moderate near-term installation rates, yet strategic stockpiling initiatives by large vendors help stabilize deliveries. Growing privacy regulation in Europe and North America requires vendors to embed data-protection controls within body-scanning workflows without eroding detection accuracy.
Key Report Takeaways
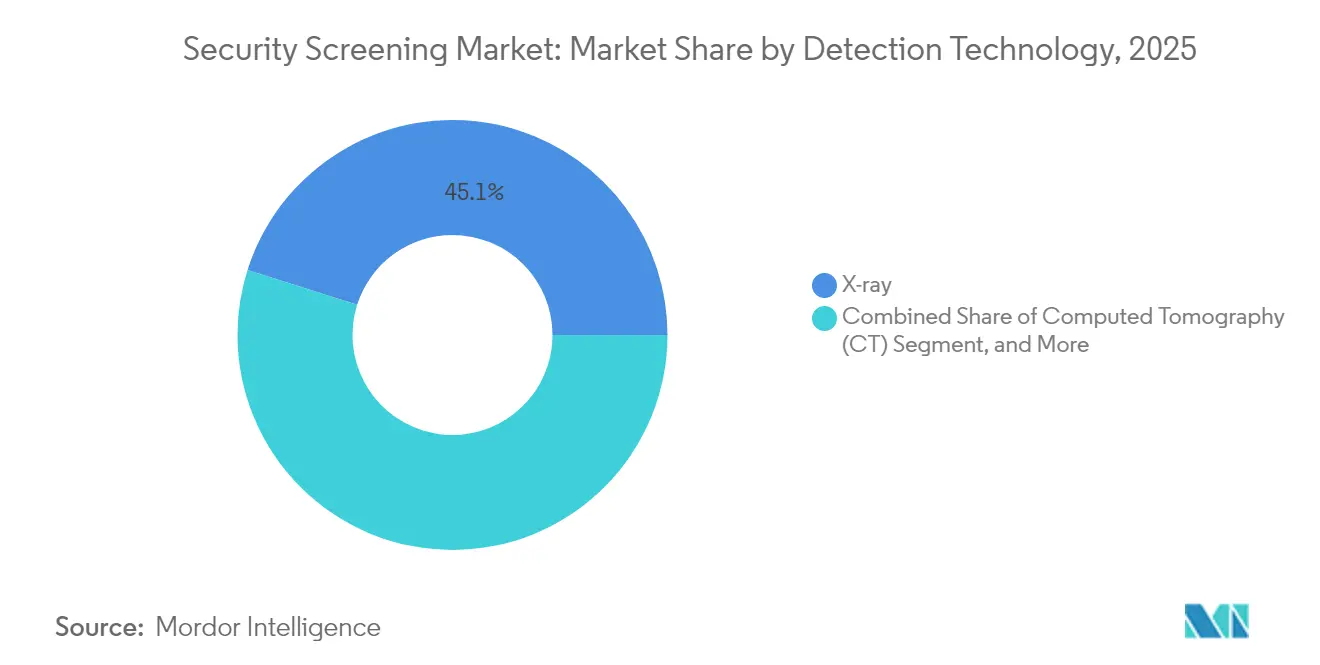
- By detection technology, X-ray imaging led with 45.12% of the security screening market share in 2025, while computed tomography is forecast to expand at an 7.76% CAGR to 2031.
- By equipment type, walk-through metal detectors accounted for 34.25% of the security screening market size in 2025; portable screening units are advancing at an 8.32% CAGR through 2031.
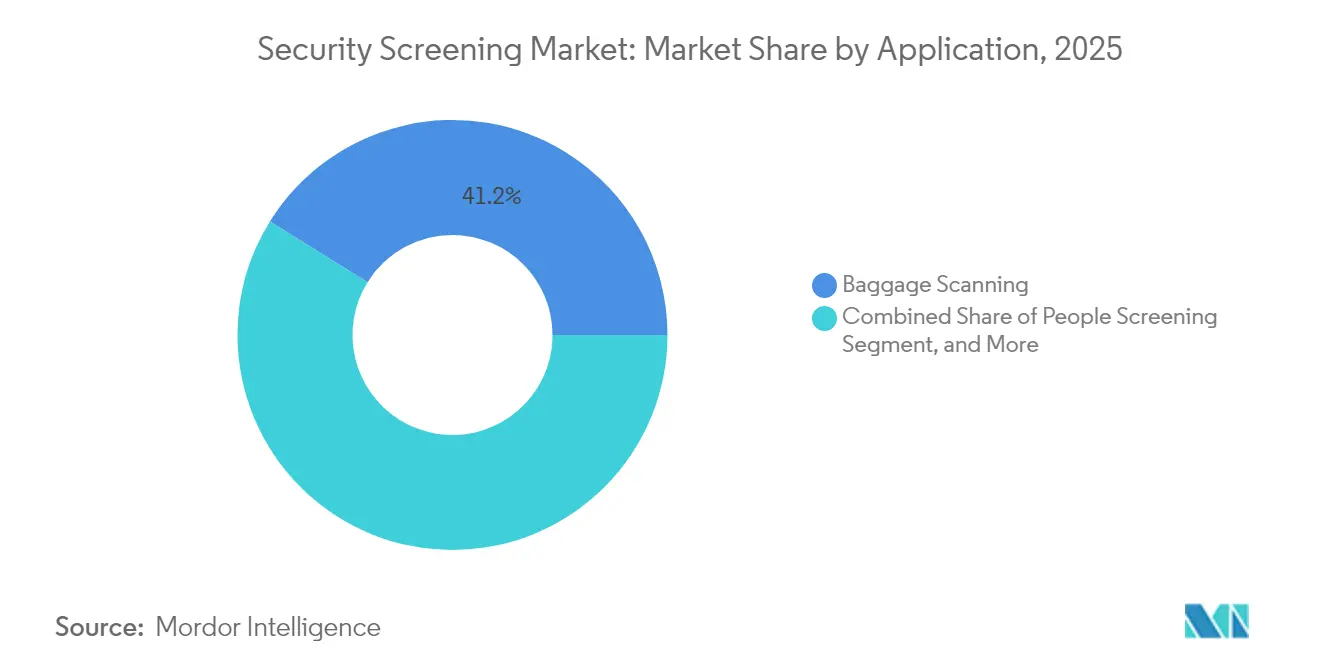
- By application, baggage scanning captured 41.15% revenue share of the security screening market in 2025, and cargo and vehicle inspection is projected to rise at an 8.27% CAGR to 2031.
- By end-user industry, airports held 49.02% of the security screening market size in 2025, while defense installations are growing fastest at an 8.55% CAGR through 2031.
- By geography, North America commanded 36.05% share of the security screening market in 2025; Asia-Pacific is on track for an 8.14% CAGR between 2026-2031.
Note: Market size and forecast figures in this report are generated using Mordor Intelligence’s proprietary estimation framework, updated with the latest available data and insights as of 2026.
Global Security Screening Market Trends and Insights
Drivers Impact Analysis*
| Driver | (~) % Impact on CAGR Forecast | Geographic Relevance | Impact Timeline |
|---|---|---|---|
| Upsurge in terror activities and security threats globally | +1.8% | Global, with heightened focus on Middle East and Africa | Medium term (2-4 years) |
| Regulatory mandates for aviation and border security | +1.2% | North America and Europe, expanding to Asia-Pacific | Short term (≤ 2 years) |
| Technological advancements in AI-powered automated threat detection | +0.8% | Global, led by North America and Europe | Long term (≥ 4 years) |
| Integration of millimeter-wave imaging with 5G infrastructure | +0.6% | APAC core, spill-over to North America and Europe | Medium term (2-4 years) |
| Contactless passenger-flow solutions post-pandemic | +0.5% | Global, with early adoption in North America and Europe | Short term (≤ 2 years) |
| Drone-borne contraband driving vertical screening adoption | +0.3% | Border regions globally, concentrated in North America and Middle East | Medium term (2-4 years) |
| Source: Mordor Intelligence | |||


Upsurge in Terror Activities and Security Threats Globally
Persistent extremist networks and transnational trafficking rings elevate baseline threat levels at airports, borders, and seaports. The U.S. Department of Homeland Security’s 2024 maritime cybersecurity white paper underscores how kinetic and cyber vectors are converging, compelling authorities to procure multi-modal systems that screen containers, people, and digital signals in one workflow.[1]U.S. Department of Homeland Security, “Maritime Cybersecurity White Paper,” dhs.gov Border agencies are piloting vertical screening towers that detect low-flying drones delivering weapons or narcotics. Portable units featuring integrated X-ray and millimeter-wave arrays are rotated among chokepoints to disrupt unpredictable smuggling routes. Governments in the Middle East and Africa are fast-tracking project financing for rapid-deployment checkpoints after a spike in cross-border incursions, bolstering long-term equipment replacement pipelines. These dynamics collectively underpin the steady expansion of the security screening market.
Regulatory Mandates for Aviation and Border Security
Regulators are translating evolving risk profiles into hard technology requirements. The European Civil Aviation Conference approved the removal of the 100 ml liquid limit at airports equipped with ECAC-certified CT scanners, forcing operators across the bloc to adopt next-generation equipment or preserve legacy restrictions that slow queues.[2]European Civil Aviation Conference, “ECAC Standards and Recommended Practices,” ecac-ceac.org In the United States, the Transportation Security Administration locked in USD 5.5 billion of multi-year CT contracts, standardizing checkpoint configurations nationwide. Similar mandates are emerging in India and Indonesia, where civil-aviation regulators now stipulate AI-ready imaging platforms for new terminal builds. Such codified thresholds effectively convert optional upgrades into non-negotiable capital expenditure, accelerating the security screening market’s technology refresh cycle.
Technological Advancements in AI-Powered Automated Threat Detection
Artificial intelligence is shifting screening from reactive object identification toward predictive risk analytics. BigBear.ai and Analogic fuse CT image streams with machine-learning models that cut false alarms by double-digit percentages and relieve operator fatigue.[3]Marketscreener, “BigBear.ai Joins Forces with Analogic to Transform Airport Threat Detection,” marketscreener.com Vision-language models let security staff query an archive of scanned objects using everyday phrases, shortening adjudication time for ambiguous items. Algorithms continuously retrain on adversary tactics, keeping pace with emerging 3D-printed weapons that evade traditional signature libraries. AI modules are delivered as cloud-native microservices, enabling field upgrades without replacing whole imaging stacks and protecting capital outlays.
Integration of Millimeter-Wave Imaging with 5G Infrastructure
Linking millimeter-wave portals to 5G edge nodes provides sub-second data transfer to centralized analytic engines. Trials at Frankfurt Airport demonstrated concurrent processing of body-scan data for 10 lanes with no latency penalties, validating scalable architectures for mega-terminals. Telecom operators in South Korea and Japan are co-locating security analytics at 5G edge datacenters, reducing on-premise hardware footprints. The arrangement also supports remote troubleshooting and continuous software patching, a critical capability as cyber vulnerabilities in imaging firmware become attractive targets. Vendors are embedding 5G modems directly into portable inspection vans, permitting real-time collaboration with command centers and improving situational awareness during ad-hoc deployments.
Restraints Impact Analysis*
| Restraint | (~) % Impact on CAGR Forecast | Geographic Relevance | Impact Timeline |
|---|---|---|---|
| High procurement and maintenance costs of advanced systems | -0.9% | Global, with acute impact on developing markets | Short term (≤ 2 years) |
| Data-privacy concerns surrounding body scanners | -0.7% | Europe and North America, expanding to Asia-Pacific | Medium term (2-4 years) |
| Supply-chain disruptions in rare-earth and semiconductor components | -0.4% | Global, with manufacturing concentration in Asia-Pacific | Short term (≤ 2 years) |
| False-alarm fatigue causing operational bottlenecks | -0.3% | Global, particularly high-traffic airports and borders | Medium term (2-4 years) |
| Source: Mordor Intelligence | |||
High Procurement and Maintenance Costs of Advanced Systems
Computed tomography and millimeter-wave installations often exceed USD 1 million per lane. OSI Systems’ USD 76 million contract for a single hub airport illustrates the scale of outlays necessary to modernize checkpoints. Beyond purchase price, airports incur facility retrofits for higher power loads and cooling, along with software-update subscriptions to sustain certification. Smaller Caribbean and African airports struggle to justify the outlay against limited passenger throughput, leading to a bifurcated security environment that adversaries can exploit. Leasing models and performance-based service contracts are emerging to distribute costs over operational budgets, but uptake remains nascent.
Data-Privacy Concerns Surrounding Body Scanners
Full-body systems that generate high-resolution anatomical images face stringent biometric-data rules under the European Union’s General Data Protection Regulation, compelling airports to anonymize or instantly purge scans. These workflows complicate evidence retention when law enforcement must prosecute smuggling cases. In North America, advocacy groups press for opt-out options, prolonging queue times and eroding throughput gains. Asia-Pacific regulators are drafting similar statutes, potentially expanding the compliance burden. Vendors are responding with software that renders generic avatars rather than raw images, yet the perception of intrusive scanning still tempers deployment velocity.
*Our forecasts treat driver/restraint impacts as directional, not additive. The impact forecasts reflect baseline growth, mix effects, and variable interactions.
Segment Analysis
By Detection Technology: CT Adoption Accelerates Throughput-Driven Investments
CT scanners accounted for USD 2.08 billion of revenue in 2025, translating to 22.37% of the security screening market size, and they are projected to post an 7.76% CAGR on the back of liquid-carry-on policy relaxations. X-ray systems retained their leadership with a 45.12% share in 2025, favored for lower capital cost and mature regulatory approvals. Nonetheless, airlines lobbying for faster boarding are swaying airports toward CT, particularly in Asia-Pacific’s new greenfield terminals. Terahertz and neutron sensing systems cater to specialized nuclear material detection but remain below 5% of the overall revenue pool. Integration of AI classifiers into CT consoles sharply reduces false positives, a principal driver behind procurement decisions in Europe and the Gulf states.
In the medium term, chip-scale terahertz emitters emerging from MIT Lincoln Laboratory trials will unlock handheld screening formats, broadening use cases beyond fixed checkpoints. Vendors are bundling radiation monitors with conventional lanes to comply with updated International Atomic Energy Agency guidance on orphan source interdiction, gradually lifting unit shipments. The security screening industry is thereby pivoting from single-modality hardware toward software-defined, multi-sensor ecosystems that evolve through over-the-air updates rather than forklift upgrades.


By Equipment Type: Mobility and Modularity Gain Traction
Walk-through metal detectors collected 34.25% revenue share in 2025 by virtue of ubiquity and low ownership cost. Portable and mobile units, though only 11.2% of current shipments, are expanding at an 8.32% CAGR as border patrols demand rapid redeployment to emerging smuggling corridors. Explosives trace detection systems remain indispensable for alarm resolution, with the U.S. Transportation Security Administration ordering more than 2,500 Itemiser 5X devices for secondary screening in 2025. Full-body scanners record the highest average selling price but are penetrating mass-transit hubs where throughput gains offset acquisition cost.
Market leaders now package lane components, imagers, trays, and divestment tables as modular kits that fit both permanent halls and pop-up checkpoints. Lifecycle service contracts covering firmware, spare parts, and operator training comprise nearly 30% of total contract value, creating annuity revenue streams. Hardware commoditization thus shifts competitive edge toward analytics software, cybersecurity hardening, and predictive maintenance algorithms that reduce downtime at high-traffic sites.
By Application: Cargo Screening Mitigates Supply-Chain Threats
Baggage scanning preserved a 41.15% share in 2025 because aviation authorities mandate 100% screening of passenger luggage. Yet cargo and vehicle inspection lines are accelerating at an 8.27% CAGR, fueled by sudden shipping-route shifts after Red Sea disruptions and heightened contraband seizures at land crossings. Customs agencies in the Middle East rolled out drive-through CT portals capable of 150 trucks per hour, demonstrating the scalability of high-energy imaging for commerce flows.
Mail and parcel screening benefits from cross-border e-commerce growth, especially in Southeast Asia, where volumes rise 20% year-over-year. People-screening applications extend to stadiums and corporate campuses, adopting contactless walk-through technology to minimize queue build-ups. The security screening market continues to diversify as operators blend imaging, trace, and canine solutions into layered concepts of operation that adapt to threat intelligence feeds in real time.
By End-User Industry: Defense Modernization Spurs Highest CAGR
Airports remained the core customer segment with 49.02% of spending in 2025, underpinned by global passenger rebounds and mandated re-inspection cycles. Defense facilities, however, are advancing at an 8.55% CAGR as militaries retrofit perimeters with radar-coupled imaging and vehicle-mounted scanners that protect forward operating bases. Ports and borders consume a rising share, encouraged by government stimulus earmarked for trade-lane security upgrades.
Critical infrastructure operators, such as nuclear plants and data centers, now embed screening lanes within visitor management suites to counter insider threats. Retail malls and convention centers adopt weapon detection gates to reassure patrons after several high-profile attacks. The security screening industry is consequently broadening its user base beyond aviation, cushioning vendors against cyclical airline capital expenditure slumps.
Geography Analysis
North America generated 36.05% of 2025 revenue on the back of the Transportation Security Administration’s multibillion-dollar CT and maintenance framework agreements. Continued contract modifications, including Leidos’ eight-year USD 2.6 billion checkpoint sustainment award, lock in predictable aftermarket receipts. Canadian airports align procurement standards with U.S. counterparts, while Mexican customs deploy mobile X-ray vans along the southern border to stem narcotics inflows, adding incremental demand.
Asia-Pacific is forecast to grow at an 8.14% CAGR through 2031 as China, India, and Indonesia expand greenfield airports and high-speed rail corridors. Beijing’s push for domestic AI chips used in CT consoles reduces import dependence and compresses lead times, giving local vendors cost advantages. Singapore’s Changi Airport is piloting biometric-linked security lanes that fuse identity management with threat detection, setting performance benchmarks for the region.
Europe maintains a steady upgrade cadence driven by the ECAC liquid-ban repeal and stringent data-privacy rules that favor vendors with built-in anonymization features. Zurich Airport’s live trials of CT and automated tray return systems exemplify how regional hubs validate new layouts before full-fleet rollouts. Eastern European states tapping EU security funds are leapfrogging directly to AI-ready CT, sidestepping intermediate X-ray generations. Meanwhile, Middle East and Africa governments allocate oil-windfall budgets to protect mega-events and critical infrastructure, often bundling physical screening with drone perimeter defenses in integrated tenders.

Competitive Landscape
The security screening market exhibits moderate consolidation: the top five suppliers generated around 62% of global revenue in 2024. Smiths Detection leverages a broad imaging portfolio to secure multi-year airport frameworks across Europe and Asia. OSI Systems capitalizes on cargo and vehicle inspection demand, boasting a record USD 1.8 billion backlog in 2025 after a series of large awards. Leidos underpins its position with lifecycle logistics contracts that embed technicians on-site at more than 430 U.S. airports.[4]Leidos, “Leidos Wins TSA Logistics Contract,” leidos.com
Disruptors are reshaping value propositions. Evolv Technology’s contactless gates process 4,000 people per hour and embed SaaS analytics that monetize crowd-flow data. SeeTrue’s AI plug-in retrofits existing X-ray machines to elevate automatic threat recognition, giving mid-tier airports a lower-cost modernization path. BigBear.ai’s cloud-based fusion engine integrates radar, lidar, and CT feeds to extend detection beyond standard checkpoint imagery. Strategic M&A and partnerships abound as incumbents acquire software talent to defend their share. Supply-chain resilience efforts include dual-sourcing rare-earth magnets and in-house ASIC design to mitigate chip shortages.
Security Screening Industry Leaders
Smiths Group plc (Smiths Detection)
Leidos Holdings Inc.
OSI Systems Inc. (Rapiscan Systems)
Nuctech Company Limited
3DX-Ray Limited
- *Disclaimer: Major Players sorted in no particular order


Recent Industry Developments
- August 2025: OSI Systems reported record USD 1.713 billion revenue with a USD 1.8 billion backlog, driven by global cargo-inspection orders.
- July 2025: OSI Systems upsized its credit facility to 2030, fortifying liquidity for large government contracts.
- June 2025: BigBear.ai partnered with Analogic to fuse AI analytics with CT imaging for airports.
- May 2025: Leidos and Saudi Arabia’s National Security Services Company signed an MoU to modernize kingdom-wide screening infrastructure.
- March 2025: OSI Systems landed a USD 76 million order for CT and trace units at a major international airport.
- March 2025: Evolv Technology announced 92% contract-renewal adherence, underscoring customer stickiness.
- February 2025: Leidos teamed with SeeTrue to embed AI object-recognition into its checkpoint portfolio.
- January 2025: Leidos secured an eight-year USD 2.6 billion TSA sustainment deal covering 12,000 units.
- January 2025: OSI Systems booked USD 184 million in mixed aviation and cargo orders.
- January 2025: Smiths Detection deepened its partnership with Fukuoka International Airport on CT deployments.


Global Security Screening Market Report Scope
Security screening refers to the procedure whereby baggage, mail and parcels, cargo, and vehicles, among others, are electronically screened at a transportation hub or a facility before it is allowed to proceed further. X-ray, CT-based, neutron sensing, and detection are some techniques through which security scanning is performed in the market.
The security screening market is segmented by detection technology (x-ray, ct-based, neutron sensing and detection), application (mail and parcel, baggage scanning, cargo and vehicle inspection, and explosives and narcotics), end user (airports, ports and borders, defense, critical infrastructure, commercial and law enforcement), and geography (North America (United States, Canada), Europe (United Kingdom, Germany, France, Rest of Europe), Asia Pacific (China, India, Japan, Rest of Asia Pacific), Rest of the World). The market sizes and forecasts are provided in terms of value (USD) for all the segments.
By Detection Technology
| X-ray |
| Computed Tomography (CT) |
| Neutron Sensing and Detection |
| Terahertz and Millimeter-wave |
| Other Detection Technologies |
By Equipment Type
| Walk-through Metal Detectors |
| Hand-held Metal Detectors |
| Full-body Scanners |
| Explosives Trace Detection Systems |
| Radiation Detection Equipment |
| Portable / Mobile Screening Units |
By Application
| Mail and Parcel |
| Baggage Scanning |
| Cargo and Vehicle Inspection |
| People Screening |
| Explosives and Narcotics Detection |
By End-User Industry
| Airports |
| Ports and Borders |
| Defense |
| Critical Infrastructure |
| Commercial Buildings and Malls |
| Law Enforcement and Public Transport |
| Other End-User Industries |
By Geography
| North America | United States | |
| Canada | ||
| Mexico | ||
| South America | Brazil | |
| Argentina | ||
| Chile | ||
| Rest of South America | ||
| Europe | Germany | |
| United Kingdom | ||
| France | ||
| Italy | ||
| Spain | ||
| Rest of Europe | ||
| Asia-Pacific | China | |
| Japan | ||
| South Korea | ||
| India | ||
| Singapore | ||
| Australia | ||
| Rest of Asia-Pacific | ||
| Middle East and Africa | Middle East | Saudi Arabia |
| United Arab Emirates | ||
| Turkey | ||
| Rest of Middle East | ||
| Africa | South Africa | |
| Nigeria | ||
| Egypt | ||
| Rest of Africa | ||
| By Detection Technology | X-ray | ||
| Computed Tomography (CT) | |||
| Neutron Sensing and Detection | |||
| Terahertz and Millimeter-wave | |||
| Other Detection Technologies | |||
| By Equipment Type | Walk-through Metal Detectors | ||
| Hand-held Metal Detectors | |||
| Full-body Scanners | |||
| Explosives Trace Detection Systems | |||
| Radiation Detection Equipment | |||
| Portable / Mobile Screening Units | |||
| By Application | Mail and Parcel | ||
| Baggage Scanning | |||
| Cargo and Vehicle Inspection | |||
| People Screening | |||
| Explosives and Narcotics Detection | |||
| By End-User Industry | Airports | ||
| Ports and Borders | |||
| Defense | |||
| Critical Infrastructure | |||
| Commercial Buildings and Malls | |||
| Law Enforcement and Public Transport | |||
| Other End-User Industries | |||
| By Geography | North America | United States | |
| Canada | |||
| Mexico | |||
| South America | Brazil | ||
| Argentina | |||
| Chile | |||
| Rest of South America | |||
| Europe | Germany | ||
| United Kingdom | |||
| France | |||
| Italy | |||
| Spain | |||
| Rest of Europe | |||
| Asia-Pacific | China | ||
| Japan | |||
| South Korea | |||
| India | |||
| Singapore | |||
| Australia | |||
| Rest of Asia-Pacific | |||
| Middle East and Africa | Middle East | Saudi Arabia | |
| United Arab Emirates | |||
| Turkey | |||
| Rest of Middle East | |||
| Africa | South Africa | ||
| Nigeria | |||
| Egypt | |||
| Rest of Africa | |||


Key Questions Answered in the Report
How large is the security screening market in 2026?
The security screening market size is USD 9.94 billion in 2026 and is forecast to reach USD 13.77 billion by 2031.
Which detection technology is expanding fastest?
Computed tomography is projected to grow at an 7.76% CAGR as airports adopt liquid-friendly screening lanes.
What region offers the highest growth potential?
Asia-Pacific is set for an 8.14% CAGR to 2031, propelled by airport expansions in China, India, and Southeast Asia.
Why are portable screening units gaining traction?
Mobile systems support rapid redeployment to new threat corridors and are growing at an 8.32% CAGR.
What is driving defense sector demand?
Military bases are upgrading perimeter and vehicle access controls, pushing defense applications to an 8.55% CAGR.
Which companies dominate the market?
Smiths Detection, OSI Systems, and Leidos lead with roughly 62% combined revenue, while AI-focused entrants such as Evolv Technology are challenging incumbents.
Page last updated on:


