
Incident And Emergency Management Market Size and Share
Market Overview
| Study Period | 2021 - 2031 |
|---|---|
| Market Size (2026) | USD 167.66 Billion |
| Market Size (2031) | USD 230.86 Billion |
| Growth Rate (2026 - 2031) | 6.61 % |
| Fastest Growing Market | Asia Pacific |
| Largest Market | North America |
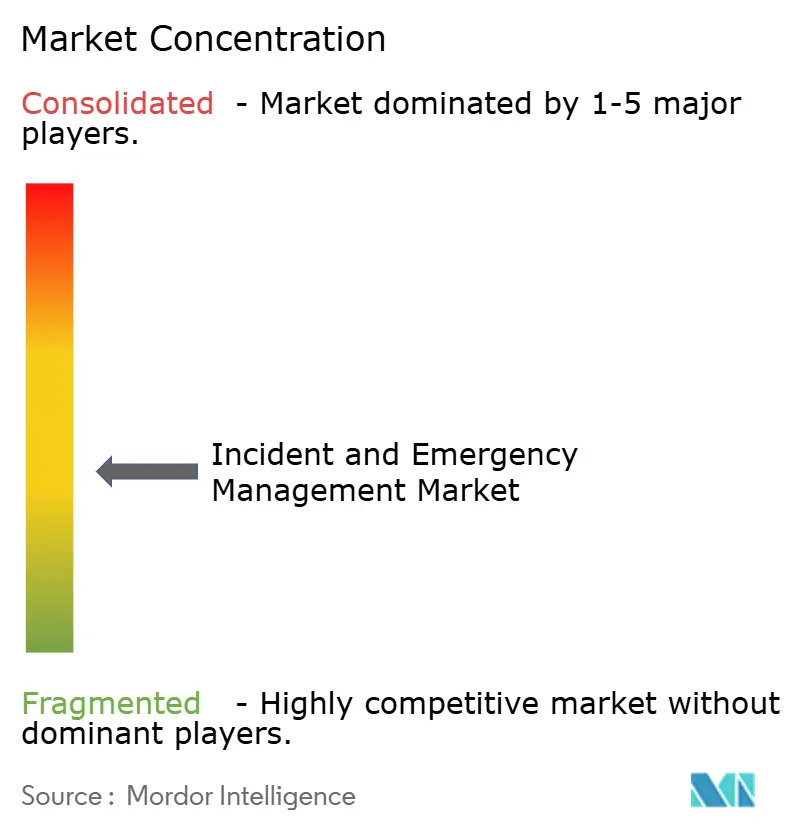
| Market Concentration | Medium |
Major Players
*Disclaimer: Major Players sorted in no particular order Image © Mordor Intelligence. Reuse requires attribution under CC BY 4.0. |
|
Incident And Emergency Management Market Analysis by Mordor Intelligence
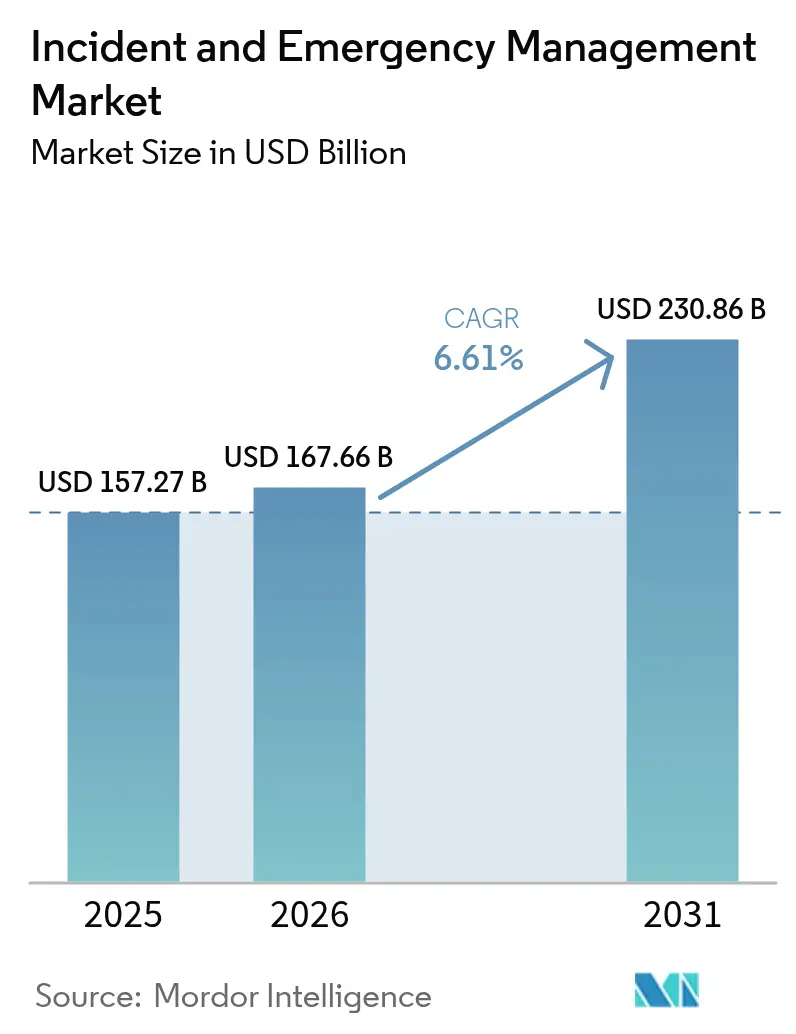
The incident and emergency management market size is expected to grow from USD 157.27 billion in 2025 to USD 167.66 billion in 2026 and is forecast to reach USD 230.86 billion by 2031 at 6.61% CAGR over 2026-2031. This trajectory mirrors the rapid institutionalisation of emergency-preparedness budgets in both the public and private sectors, coupled with rising weather-driven disasters that command more comprehensive, technology-enabled response capabilities. North America maintains a broad lead on account of sophisticated federal funding programmes, while Asia registers the fastest expansion as governments upgrade early-warning and mass-notification infrastructures. Demand pivots toward integrated platforms that fuse geospatial analytics, cloud-native architectures, and AI-driven decision support, shortening the time between detection and coordinated field action. Intensifying cyber-physical threats and the migration of traffic and public-safety controls into smart-city fabrics round out the near-term growth catalysts.
Key Report Takeaways
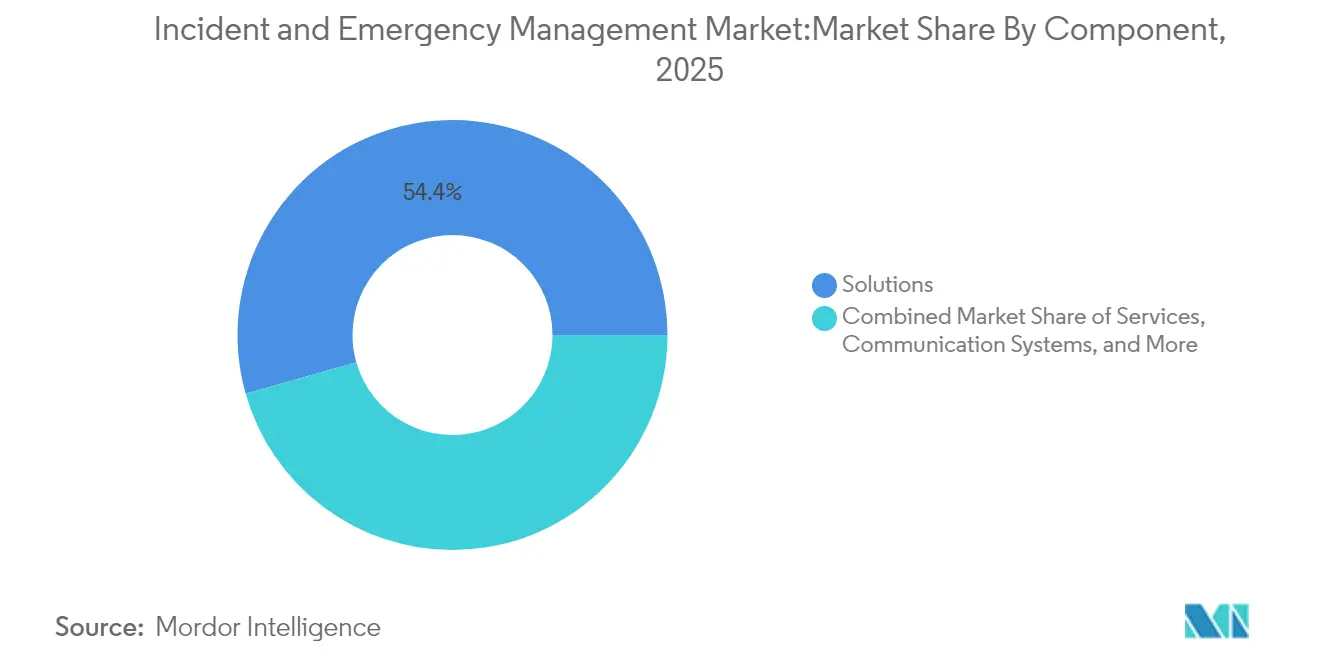
- By component, the Solutions segment commanded 54.40% of the incident and emergency management market share in 2025, while Simulation & Training expanded at a 7.45% CAGR through 2031.
- By solution type, Emergency/Mass Notification held 27.60% revenue share in 2025; Surveillance & Security Monitoring is projected to grow at 8.18% CAGR to 2031.
- By service type, Professional Services accounted for 61.30% of the segment’s incident and emergency management market size in 2025; Managed Services leads growth at 6.95% CAGR.
- By communication system, First-Responder Communication systems dominated with 39.50% share in 2025; Satellite Communication Devices are set to advance at 8.25% CAGR.
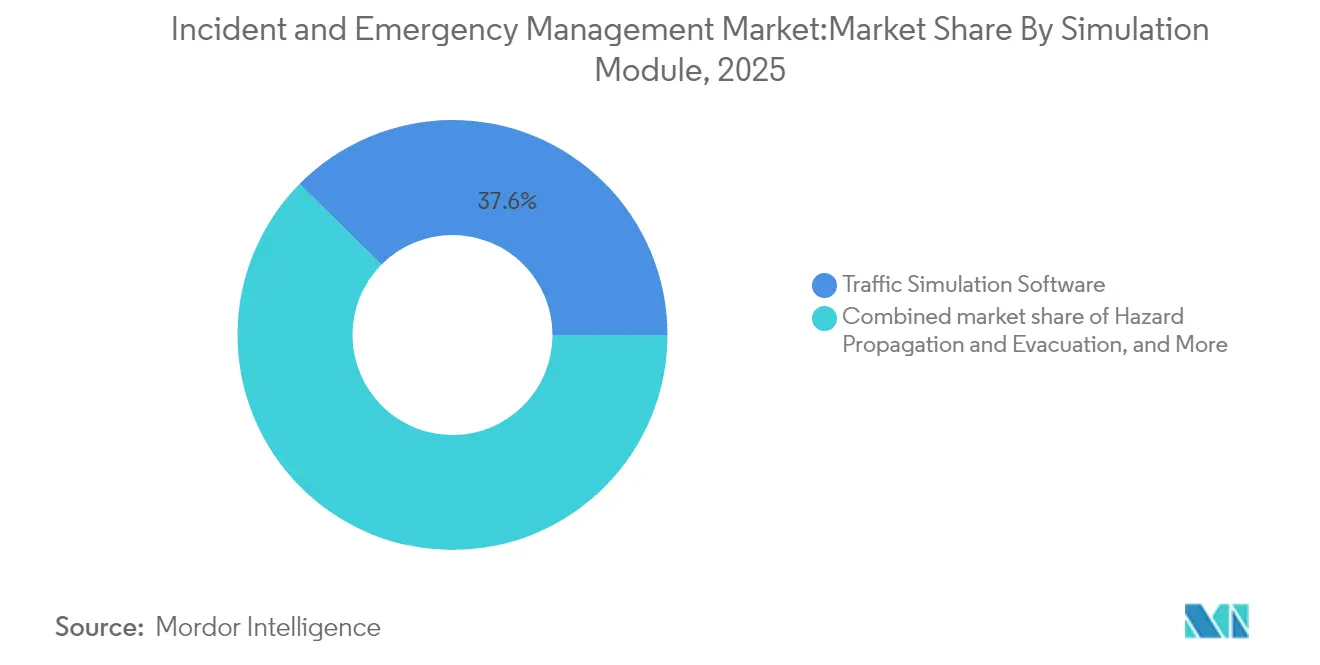
- By simulation module, Traffic Simulation Software captured 37.60% of the incident and emergency management market size in 2025, while Hazard Propagation & Evacuation Modeling rose at a 8.06% CAGR.
- By end-user vertical, Government & Defense held 36.70% revenue share in 2025; Healthcare logs the highest CAGR at 6.34% through 2031.
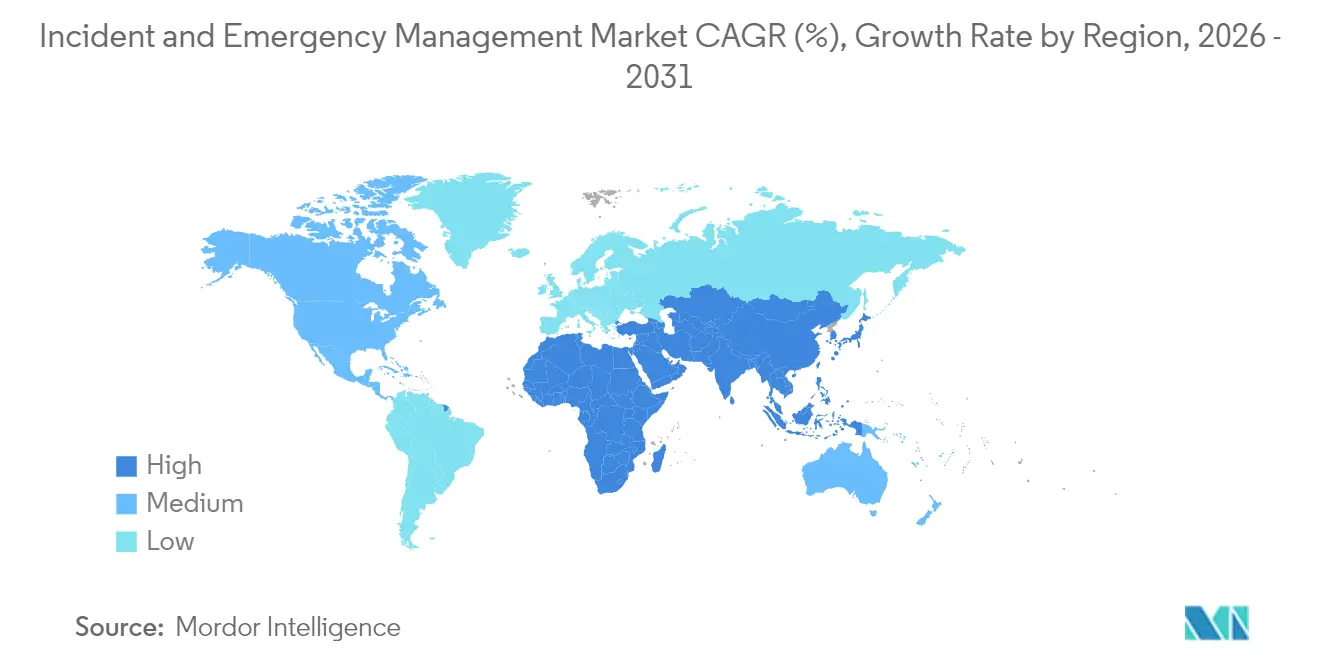
- By geography, North America led with 41.60% market share in 2025; Asia delivers the fastest regional CAGR of 7.96% out to 2031.
Note: Market size and forecast figures in this report are generated using Mordor Intelligence’s proprietary estimation framework, updated with the latest available data and insights as of 2026.
Market Trends and Insights
Drivers Impact Analysis of Incident And Emergency Management Market*
| Driver | (~) % Impact on CAGR Forecast | Geographic Relevance | Impact Timeline |
|---|---|---|---|
| Escalating climate-related mega-disasters | +1.8% | North America, Asia, spillover global | Long term (≥ 4 years) |
| Mandated public alerting compliance | +1.2% | North America, Europe | Medium term (2-4 years) |
| AI-powered geospatial analytics adoption | +1.5% | Global; early uptake in North America & Europe | Medium term (2-4 years) |
| Rising cyber-physical attacks on critical infrastructure | +0.9% | Global; concentration in North America & Europe | Short term (≤ 2 years) |
| Smart-city traffic & emergency-control convergence | +0.7% | Asia, Europe, North America | Medium term (2-4 years) |
| Risk-based insurance incentives | +0.5% | North America, Europe | Medium term (2-4 years) |
| Source: Mordor Intelligence | |||
Increasing frequency and severity of climate-related mega-disasters
Economic losses from natural catastrophes reached USD 320 billion in 2024, with North America absorbing roughly 60% and Asia Pacific recording 79 hydro-meteorological events, spotlighting preparedness gaps. Rising loss ratios push governments and enterprises to procure multi-hazard early-warning networks, cloud-based incident dashboards, and satellite-enabled situational-awareness feeds. Development lenders such as the World Bank-hosted GFDRR underwrite capacity-building grants, anchoring multi-year procurement pipelines that fortify the incident and emergency management market.[1]Global Facility for Disaster Reduction and Recovery. "Annual Report 2024", gfdrr.org
Mandated compliance with public alerting standards (FEMA IPAWS, EU EECC)
Legislation now obliges telecom operators and public agencies to support authenticated cell-broadcast and multimodal warnings, accelerating mass-notification deployments. FEMA’s IPAWS benchmarks spurred heavy county-level adoption in the United States, while the EU’s Electronic Communications Code has set a 2025 deadline for continent-wide alerting reach. France’s upcoming mission-critical broadband network illustrates how spectrum migration unlocks richer media—location-pinpointed texts, images, and short videos—that heighten public responsiveness during crises.
Adoption of AI-powered geospatial analytics for real-time situational awareness upgrades
Machine-learning models are calibrating flood extents, wildfire spread, and infrastructure damage within minutes of satellite pass-overs. Cambodia’s WFP pilot and FEMA’s six internal AI use cases showcase cost-effective scaling of big-data processing across emerging and mature economies alike.[2]World Food Programme, “Climatic Disaster Risk Assessment in Cambodia,” wfp.org Decision-makers gain heat-mapped risk overlays and auto-generated resource-dispatch recommendations, stiffening the incident and emergency management market’s value proposition.
Escalating cyber-physical attacks on critical infrastructure
Accelerating threat actor sophistication blurs the line between IT and OT risk, compelling utilities, municipalities, and hospital systems to unify security operations centres with emergency operations centres. US policy papers now prioritise AI threat detection and supply-chain vulnerabilities, moving organisations to procure orchestration platforms that ingest both network-telemetry and physical-sensor inputs.[3]U.S. Department of Homeland Security, “Strategic Guidance and National Priorities 2024-2025,” dhs.gov This convergence fuels integrated procurement across what were once siloed budgets.
Restraints Impact Analysis of Incident And Emergency Management Market*
| Restraint | (~) % Impact on CAGR Forecast | Geographic Relevance | Impact Timeline |
|---|---|---|---|
| Interoperability gaps between legacy P25/TETRA and IP networks | -0.8% | Europe; minor spillover North America | Medium term (2-4 years) |
| High CapEx for resilient communications in remote APAC & island states | -0.6% | Asia-Pacific, global islands | Long term (≥ 4 years) |
| Data-privacy regulations curbing location-based alerts | -0.5% | Europe, North America | Medium term (2-4 years) |
| Shortage of systems-integration talent | -0.4% | Global; acute in developing regions | Short term (≤ 2 years) |
| Source: Mordor Intelligence | |||
Interoperability gaps between legacy P25/TETRA networks and IP-based platforms
Many European public-safety agencies still depend on narrowband P25 or TETRA radios that operate on proprietary protocols, hampering seamless roaming onto broadband cellular or satellite links. SAFECOM grant guidance presses states to adopt standards-based bridging technologies, yet funding and procurement cycles slow roll-out of converged solution. The resulting patchwork delays cross-border coordination and marginally dampens the incident and emergency management market’s near-term growth.
High CapEx for resilient communications in remote APAC and island nations
Sparse population densities and rugged topographies require expensive satellite backhaul or microwave redundancy, stretching public-sector budgets. Although Australia’s Disaster Ready Fund allocates USD 1 billion over five years, many Pacific islands still rely on grant financing to establish minimum-viable command-and-control nodes.[4]National Emergency Management Agency, “Disaster Ready Fund,” nema.gov.auSlower infrastructure roll-out tempers demand for advanced software layers.
*Our forecasts treat driver/restraint impacts as directional, not additive. The impact forecasts reflect baseline growth, mix effects, and variable interactions.
Incident And Emergency Management Market Segment Analysis
By Component:
Solutions Dominate While Simulation & Training Gains MomentumSolutions generated 54.40% of the incident and emergency management market in 2025, a testament to buyer preference for end-to-end platforms that orchestrate alerting, resource allocation, and after-action reporting in a single pane of glass. Rapid upgrades to AI engines and cloud elasticity underpin continued wallet share expansion. Vendors accentuate open-API ecosystems that plug into CAD, GIS, and EOC modules, improving time-to-value for regional agencies. Over the forecast horizon, tighter integration with insurance-risk scoring tools will further entrench platform revenues.
Simulation & Training, though smaller in absolute revenue, is scaling at 7.45% CAGR as agencies institutionalise scenario-based preparedness policies. Gamified modules such as George Mason University’s AI-augmented “Go-Repair” illustrate how immersive learning cuts attrition and raises competence, thereby elevating training budgets. This segment’s expansion feeds a virtuous cycle: stronger preparedness metrics qualify states for resilience grants, reinforcing upstream demand for platform solutions.



By Solution Type:
Surveillance & Security Monitoring Accelerates Digital TransformationEmergency/Mass Notification continues to anchor 27.60% of 2025 revenue as regulated mandates lock in upgrade cycles. However, Surveillance & Security Monitoring is the fastest-moving niche at 8.18% CAGR, propelled by AI-driven video analytics and object detection that shorten dispatch times. Video feeds now integrate directly into 911 centres, producing a continuous intelligence loop that amplifies situational clarity and responder safety. Over the outlook period, the incident and emergency management market size attached to this sub-segment could exceed USD 36.2 billion if municipal vision-zero programmes accelerate as projected.
Traffic & Incident Management rides urban-mobility investments, whereas CBRNE/HazMat Detection broadens sensor deployment via unmanned aerial systems that minimise human exposure. Disaster Recovery & Backup solutions play a crucial role, mitigating secondary business-interruption costs.
By Service Type:
Managed Services Redefine Delivery ModelsProfessional Services constitute 61.30% of the segment-level incident and emergency management market size in 2025, spotlighting advisory, integration, and compliance support that most agencies cannot staff internally. Consulting teams translate doctrine into workflows, then blueprint cross-agency interoperability matrices. Yet Managed Services, expanding at 6.95% CAGR, signal a structural shift toward outsourcing operational burdens. Providers bundle 24/7 network operations, patch management, and cyber-monitoring into subscription contracts that smooth opex for municipalities.
Training & Education continues to mature, leveraging VR headsets and digital twins to replicate complex, low-frequency events. Such immersive curricula lower simulation costs per trainee and unlock repeatable skill refresh cycles. Support & Maintenance revenues remain sticky, driven by guaranteed SLA clauses embedded in multi-year framework agreements.
By Communication System:
Satellite Connectivity Extends ReachFirst-Responder Communication networks, primarily P25 and TETRA, held 39.50% of the 2025 spend and remain indispensable for mission-critical voice. Modernisation roadmaps layer LTE or private-5G backbones onto LMR cores, guided by documents such as Indiana’s Tactical Interoperable Communications Plan that codify resiliency playbooks. The incident and emergency management market size tied to Satellite Communication Devices is scaling at 8.25% CAGR as agencies ensure against last-mile outages during hurricanes and wildfires.
Emergency Radios preserve niche relevance for volunteer agencies, while vehicle-mounted MDTs merge CAD, mapping, and telematics into frontline workflows. Drone-fed situational awareness layers live video, orthomosaics, and gas-sensor telemetry into unified incident consoles, reinforcing end-to-end visibility for commanders.
By Simulation Module:
Hazard Propagation Modeling Gains ProminenceTraffic Simulation Software captured 37.60% market share in 2025, undergirding evacuation and contraflow planning for coastal metros. Hazard Propagation & Evacuation Modeling, growing at 8.06% CAGR, benefits from wildfire-spread and toxic-plume engines that inform micro-zonal shelter-in-place orders. WHO’s emphasis on simulation exercises validates recurring procurement of these tools as part of preparedness scorecards.
Incident Command Training Simulators exploit AI to adjust difficulty dynamically, ensuring decision-makers confront cascading-failure scenarios absent in static tabletop drills. The EMI’s virtual tabletop series converts this content into cloud-hosted workshops, democratising access for under-resourced jurisdictions.
By End-User Vertical:
Healthcare Adoption AcceleratesGovernment & Defense agencies retain a 36.70% share by virtue of statutory response mandates and federal grant inflows. Procurement frameworks such as FEMA’s USD 33.1 billion 2025 budget cement multi-year platform contracts. The Healthcare vertical outpaces all others at 6.34% CAGR, integrating digital twins that map facility capacity, resource burn-down, and patient evacuation logistics, thereby reducing morbidity during surge events.
Energy & Utilities step up grid-resilience investments, while Transportation & Logistics stakeholders channel funds into TIM and supply-chain continuity analytics. BFSI, Manufacturing, Aviation, Maritime, Mining, and Oil & Gas each adopt tailored modules that reflect distinctive risk topographies.
Geography Analysis
North America Incident And Emergency Management Market
North America anchors 41.60% of 2025 revenue, sustained by FEMA grants, private-sector cyber-investment, and wide FirstNet penetration. US counties align on interoperable protocols, and Canada’s DFAA framework pairs fiscal backstops with modernisation commitments, cultivating a mature ecosystem of suppliers, systems integrators, and academia. Pilot deployments of tethered drones for TIM lend tangible proof points that reinforce municipal budget renewals.
APAC Incident And Emergency Management Market
Asia delivers a 7.96% CAGR, spurred by megacities’ exposure to typhoons and seismic risk. China overlays city-wide HD camera grids onto command centres, and Japan’s J-ALERT system extends real-time hazard feeds to the public. India leverages AI-driven geospatial platforms to triage relief corridors after cyclones, elevating enterprise spending on emergency operations centres. Multilateral funding via ADB’s Disaster Risk Management Action Plan catalyses procurement in ASEAN markets.
EMEA Incident And Emergency Management Market
Europe sustains steady replacement cycles as the EECC compliance clock counts down. Projects such as BroadWay pilot cross-border roaming for first responders, driving solution providers to embed secure SIM credentialing and quality of service tiers. Meanwhile, the Middle East and Africa witness incremental adoption as humanitarian-relief agencies and national security bodies standardise on early-warning analytics to counter compound drought and conflict risks.

Regulatory Landscape
Public alerting and incident-response programs are increasingly shaped by mandated interoperability and resilience requirements. In the United States, FEMA maintains the National Incident Management System (NIMS) as a common doctrine for multi-agency coordination, while National Security Memorandum 22 (April 2024) elevated Critical Infrastructure Security and Resilience governance by designating the CISA Director as the National Coordinator and focusing attention on Systemically Important Entities (SIE). In Europe, Regulation (EU) 2024/2747 (Internal Market Emergency and Resilience Act) strengthened the European Commission's role in anticipating and responding to internal market crises, reinforcing procurement demand for coordinated contingency planning and operational readiness tooling.
Policy focus also extends to communications and technology supply chains that underpin emergency operations. The FCC published final rules in the Federal Register on April 10, 2026, requiring certain license and authorization holders to attest regarding foreign-adversary ownership or control, adding compliance steps for operators supporting mission-critical connectivity. Standards bodies are also codifying incident-management practices for software-enabled operations, including ISO/IEC/IEEE 23612:2026 (published May 29, 2026), which supports more standardized incident workflows and auditability across cloud-native command, notification, and analytics platforms.
Value Chain Analysis
The value chain begins with upstream inputs such as LMR and broadband communications equipment (P25/TETRA radios, satellite devices, MDTs), sensors and video systems for situational awareness, and cloud and cybersecurity foundations that support resilient operations. Platform and solution vendors assemble these components into integrated offerings spanning emergency/mass notification, CAD and dispatch, EOC dashboards, geospatial analytics, and simulation tools, while systems integrators tailor workflows, data models, and interoperability bridges across agencies and enterprises. Delivery combines licensed software and cloud services with professional services (advisory, deployment, training) and managed services, consistent with the market's high professional-services share and the need to operate, patch, and monitor systems continuously.
Downstream, buyers include government and defense, critical infrastructure operators, healthcare systems, and logistics and transportation stakeholders, with procurement shaped by cybersecurity and resilience requirements for data, networks, and cloud connectivity. US federal guidance and security architectures, such as OMB FY 2025 cybersecurity and privacy management guidance and CISA's TIC 3.0 framework, steer vendors and integrators toward standardized security controls and secure cloud connectivity patterns for command-and-control environments. Private-sector critical event management deployments, such as APL Logistics adopting Everbridge solutions, also point to demand for integrated notification and command-center capabilities that link enterprises, suppliers, and field teams during disruptions.
Competitive Landscape
The incident and emergency management market exhibits moderate fragmentation, with Honeywell International, Motorola Solutions, and Hexagon AB retaining brand primacy through M&A and AI feature releases. Motorola’s DIMETRA Connect enabling automatic LMR-to-broadband roaming exemplifies product-line extension that shores up installed-base loyalty. Hexagon’s 2025 platform refresh layers predictive analytics onto call-taking workflows, striving for first-mover advantage in AI-guided dispatch.
Cloud hyperscalers and data-science boutiques gain traction, partnering to deliver pay-per-use GIS or drone-intelligence modules. Ecosystem alliances—software ISVs with satellite operators, or insurers with EOC vendors—differentiate offerings on outcome-based KPIs such as response-time reduction or insured-loss avoidance. Emerging challengers leverage mobile-first architectures and low-code configuration to undercut incumbents’ long deployment cycles, although market-entry barriers remain high where regulatory accreditation is mandatory.
Vendor strategy increasingly pivots to platform monetisation: upsell adjacent modules, embed managed services, and lock recurring revenue via subscription licensing. Portfolio coherence, cybersecurity hardening, and standards-compliance roadmaps drive competitive advantage, signalling continued consolidation as private equity funds target niche analytical or sensor-hardware specialists.
Incident And Emergency Management Industry Leaders
-
IBM Corporation
-
Honeywell International Inc.
-
NEC Corporation
-
Hexagon AB
-
The Response Group
- *Disclaimer: Major Players sorted in no particular order
Incident And Emergency Management Market Companies Covered in this Report
- Honeywell International Inc.
- Motorola Solutions Inc.
- Hexagon AB
- IBM Corporation
- The Response Group LLC
- Everbridge Inc.
- NEC Corporation
- Johnson Controls International plc
- BlackBerry AtHoc
- Alert Technologies Corporation
- Veoci (Grey Wall Software LLC)
- Eccentex Corporation
- Haystax Technology (Fishtech Group)
- MissionMode Solutions Inc.
- Resolver Inc.
- NC4 Inc. (An Everbridge Company)
- MetricStream Inc.
- Genetec Inc.
- Collins Aerospace
- Esri Inc.
- Hexagon Safety and Infrastructure
- Nokia Corporation
- Airbus SLC
- Tabletop Command
- TigerConnect
- Rave Mobile Safety
- PagerDuty Inc.
- RapidSOS
Read Analysis of Incident And Emergency Management Companies

Market Opportunities and Future Outlook
Interoperable, IP-based emergency communications remains a modernization whitespace as jurisdictions move off legacy call-handling and fragmented data-sharing. The FCC's NG911 transition framework (rules effective March 2025) and its July 2026 Federal Register update noting more than 190 Phase 1 requests by 911 authorities provide evidence of active migration pipelines, supporting demand for GIS-enabled call routing, data unification, and secure integrations between PSAPs, dispatch, and EOCs. In parallel, the NC 911 Board's April 2026 resiliency compendium describing satellite devices for PSAP continuity highlights a procurement pathway for redundant communications that maps to the market's faster-growing satellite communication device segment.
Public-private coordination and cross-jurisdiction contracting structures also represent a near-term opportunity, particularly where programs formalize private-sector participation and standardize toolsets. The All Hazard Consortium's Public/Private Crisis Innovation initiative, launched with five states in March 2025, indicates continued investment in shared playbooks and platforms that connect government operations with enterprise supply chains during compound events. On the public alerting side, California AB-2474 directs the Office of Emergency Services to develop an implementation plan by July 1, 2027, for a statewide master contract for interoperable public alert and early warning software, creating a clear path for vendors that can meet interoperability, governance, and data-privacy constraints while delivering multimodal warning and analytics capabilities.
Recent Industry Developments in Incident And Emergency Management Market
- June 2026: The Response Group strengthened its incident-response planning and training bench by adding an ICS 300-certified emergency operations specialist with prior high-pressure operational experience. The expansion increases delivery capacity for preparedness programs and exercises supporting enterprise and public-sector command-and-control deployments.
- January 2025: The UK Home Office selected IBM under a GBP 1.362 billion contract to design, build, and integrate user services for the Emergency Services Network (ESN). This program advances a major national migration to modern emergency communications and increases demand for interoperable platforms, secure integrations, and managed service delivery across multiple agencies.
- April 2024: Hexagon announced that Greensboro, North Carolina (Guilford Metro 911) would deploy HxGN OnCall Dispatch and the HxGN Connect collaboration portal to improve multi-agency response coordination. The deployment underscores ongoing investment in AI-enabled dispatch and shared operating pictures at the PSAP level, reinforcing platform-based procurement over point solutions.


Incident And Emergency Management Market Report Scope and Research Methodology
Market Definition and Coverage
This market covers the annual revenues earned from incident and emergency management solutions and related services that help organizations plan, detect, communicate, respond, and recover during natural or man-made emergencies.
Scope exclusions: It excludes stand-alone cyber incident response software sold outside integrated emergency programs and routine facilities maintenance services.
Segments Covered in This Report
-
By Component
- Solutions
- Services
- Communication Systems
- Simulation and Training
-
By Solution Type
- Emergency/Mass Notification
- Surveillance and Security Monitoring
- Traffic and Incident Management
- Disaster Recovery and Backup
- CBRNE/HazMat Detection Systems
- Public Information Management
-
By Service Type
- Professional Services
- Consulting and Advisory
- Training and Education
- System Integration and Deployment
- Managed Services
- Support and Maintenance
-
By Communication System
- First-Responder Communication (P25, TETRA)
- Emergency Radios and Satellite Phones
- Vehicle-Mounted Mobile Data Terminals
- Drones and Robotics for Situational Awareness
-
By Simulation Module
- Traffic Simulation Software
- Hazard Propagation and Evacuation Modeling
- Incident Command Training Simulators
-
By End-User Vertical
- Government and Defense
- Energy and Utilities
- Healthcare
- BFSI
- Transportation and Logistics
- IT and Telecom
- Manufacturing and Industrial
- Aviation and Maritime
- Mining and Oil and Gas
- Media and Entertainment
-
By Geography
-
North America
- United States
- Canada
- Mexico
-
South America
- Brazil
- Rest of South America
-
Europe
- United Kingdom
- Germany
- France
- Nordics
- Rest of Europe
-
APAC
- China
- Japan
- India
- South Korea
- ASEAN
- Australia
- New Zealand
- Rest of APAC
-
Middle East and Africa
- Saudi Arabia
- United Arab Emirates
- South Africa
- Rest of Middle East and Africa
-
North America
Data Sources, Market Sizing, and Validation
Desk Research
Desk research was used to build the basic fact base for the model, then to cross-check the trends we heard in interviews. We relied on public sources such as FEMA and related US government preparedness material, National Weather Service and NOAA disaster event data, national public safety and emergency communications guidance, and standards bodies such as NFPA for incident planning and response practices.
In parallel, we reviewed annual reports, investor presentations, product documentation, press releases, and contract award announcements to understand what software, communication, and services were being commercialized. We also used paid subscriptions for company financials and intelligence, patent databases, and global contracts and tenders to verify revenue exposure and public procurement momentum. These are illustrative examples, and other public and proprietary sources were also checked for data collection, validation, and clarification.
Primary Interviews and Surveys
Primary work focused on interviews and surveys with vendors, implementation partners, public safety and emergency operations users, and procurement and program stakeholders. Respondent input clarified how adoption timelines line up with typical public budget cycles and where deployment preferences differ by region, so we could adjust assumptions such as pricing direction and rollout pace where needed.
Distribution of primary research fieldwork respondents
| Company type | Respondent position | Region |
|---|---|---|
| Top tier: 36% | CXOs: 14% | APAC: 46% |
| Mid tier: 44% | Functional/Unit leaders: 33% | EMEA: 35% |
| Smaller Players: 20% | Managers: 53% | Americas: 19% |
Market-Sizing & Forecasting
Market sizing started with a top-down build, using public disaster frequency signals and response-readiness spending patterns to reconstruct the addressable demand pool for incident and emergency management programs by region. We then reconciled this with selective bottom-up approximations, where sampled vendor revenues, typical contract sizes, and rollout volumes from public tenders were used as reasonableness checks.
Key model inputs included disaster and severe-weather occurrence trends, emergency communications modernization cycles, growth in critical infrastructure risk programs, cloud adoption in public sector IT, and observed shifts in software plus services mix during multi-year deployments. Where a bottom-up view had gaps for smaller or private participants, we filled those areas using penetration assumptions and pricing ranges validated through interviews, then constrained the totals to remain consistent with observable procurement and budgeting signals.
For forecasting, we used scenario analysis supported by short-cycle indicators such as disaster response funding priorities, public safety network upgrades, and the expected refresh of legacy command-and-control tools. Growth rates were adjusted by region based on expert consensus on adoption speed, procurement lead times, and the pace of platform consolidation.
Data Validation & Update Cycle
Validation is done through step-by-step checks that compare model outputs with independent signals, such as public tender volumes, visible program launches, and vendor revenue direction from disclosures. If a region or year shows a sharp jump, we re-check the drivers, revisit pricing and timing assumptions, and reconnect with selected interviewees to confirm whether the change is real or a data artifact.
Before sign-off, a second analyst review is performed to test calculations, units, and currency handling, and to ensure the narrative is consistent with the numbers. Reports are refreshed annually, and interim updates are made when material events occur, such as large disasters that shift budgets or major regulatory changes. Right before delivery, we do a fresh pass so clients receive the most current view available.
Mordor Intelligence's Incident and Emergency Management Market Estimate Compared With Other Published Estimates
Published market sizes for incident and emergency management often differ because teams pick different inclusion rules, different base years, and different ways to treat multi-year programs and bundled contracts. Even when the topic label is the same, the counted revenue pool can move based on what is treated as part of an integrated emergency management stack.
A common gap driver is whether adjacent areas like stand-alone cyber incident tools, general physical security spend, or broader homeland security programs are mixed into the total. Another driver is how pricing is handled through the forecast, since some studies apply flat average prices while others assume steady upsell to cloud modules and managed services, and currency timing can also change the USD value.
Benchmark comparison
| Source | Market Size | Gaps in Research Methodology |
|---|---|---|
| Mordor Intelligence | USD 157.27 B (2025) | |
| Global Research Firm A | USD 131.92 B (2024) | Uses an earlier base year and may count a different revenue boundary across software and services, which can reduce totals when multi-year deployments are recognized more conservatively. |
| Industry Publisher B | USD 141.79 B (2025) | Appears to apply a broader solution taxonomy and a different pricing progression for cloud and services, which can shift the 2025 total depending on what is treated as core emergency management. |
The spread is mainly explained by what is included alongside core emergency management platforms, plus differences in base year and how bundled services are treated. By keeping stand-alone cyber incident response and routine facilities work outside the counted scope, and by tying totals to tender checks and deployment cadence, the sizing stays more traceable to a repeatable demand pool, which is the choice applied by Mordor Intelligence.


Key Questions Answered in the Report
What is the current size of the incident and emergency management market?
The market stands at USD 167.66 billion in 2026 and is projected to reach USD 230.86 billion by 2031 at a 6.61% CAGR.
Which region leads the incident and emergency management market?
North America leads with 41.60% revenue share, supported by robust federal funding and advanced technology adoption.
Which segment shows the fastest growth?
Surveillance & Security Monitoring solutions grow at 8.18% CAGR, driven by AI-enabled video analytics and real-time situational awareness.
Why is the healthcare vertical expanding rapidly?
Hospitals adopt digital-twin and resilience tools to manage surge capacity and emergency workflows, resulting in a 6.34% CAGR from 2026-2031.
How are insurers influencing investment decisions?
Risk-based premium incentives encourage enterprises to build emergency-operations centres, aligning preparedness with lower insurance costs.
What technologies are shaping future emergency management platforms?
AI-powered geospatial analytics, satellite connectivity, drone-based reconnaissance, and cloud-native command-centre software dominate roadmaps.
Page last updated on:





