Physical Security Information Management Market Size and Share
Market Overview
| Study Period | 2020 - 2031 |
|---|---|
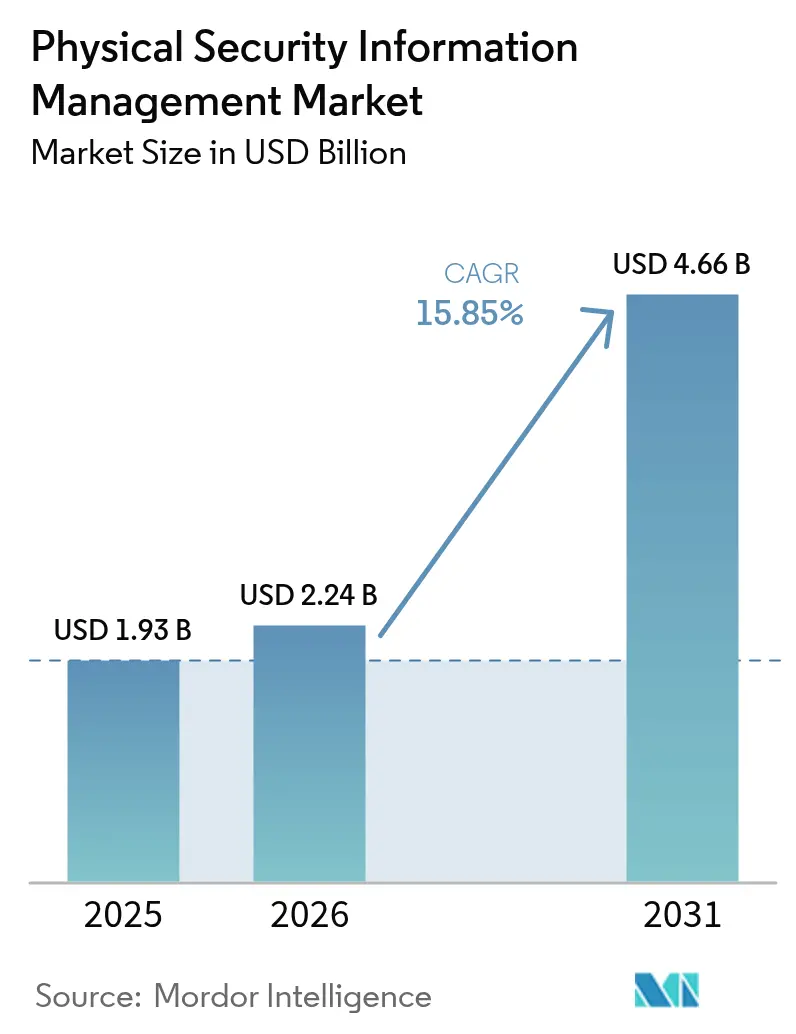
| Market Size (2026) | USD 2.24 Billion |
| Market Size (2031) | USD 4.66 Billion |
| Growth Rate (2026 - 2031) | 15.85% CAGR |
| Fastest Growing Market | Asia Pacific |
| Largest Market | Europe |
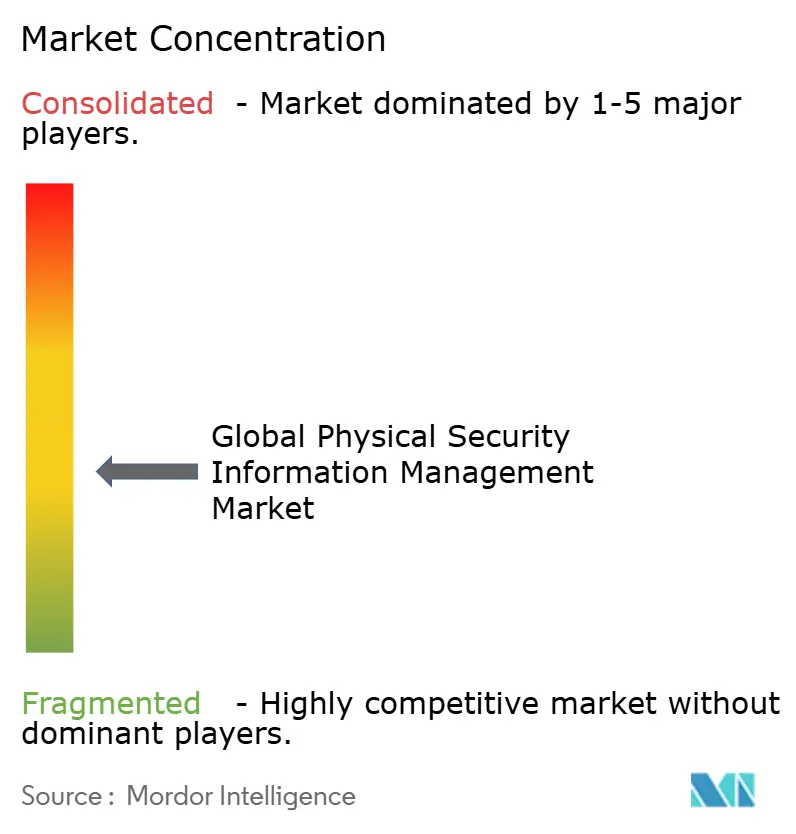
| Market Concentration | Medium |
Major Players
*Disclaimer: Major Players sorted in no particular order Image © Mordor Intelligence. Reuse requires attribution under CC BY 4.0. |
|
Physical Security Information Management Market Analysis by Mordor Intelligence
physical security information management market size in 2026 is estimated at USD 2.24 billion, growing from 2025 value of USD 1.93 billion with 2031 projections showing USD 4.66 billion, growing at 15.85% CAGR over 2026-2031. Rapid sensor proliferation, tighter regulations, and a pivot toward converged physical-cyber protection are reshaping capital allocation decisions, pushing chief security officers to prioritize unified command platforms. Demand is intensifying in transportation hubs, data-center campuses, and healthcare networks where diverse sensor estates, hybrid-work patterns, and liability exposures intersect. Vendors are responding with open orchestration layers, cloud-ready deployments, and subscription-based managed services that lower entry barriers while shortening deployment cycles. Competitive intensity is rising as established building-automation leaders, specialist PSIM providers, and public-cloud hyperscalers race to embed AI analytics, geospatial visualization, and workflow automation into a single operational picture.
Key Report Takeaways
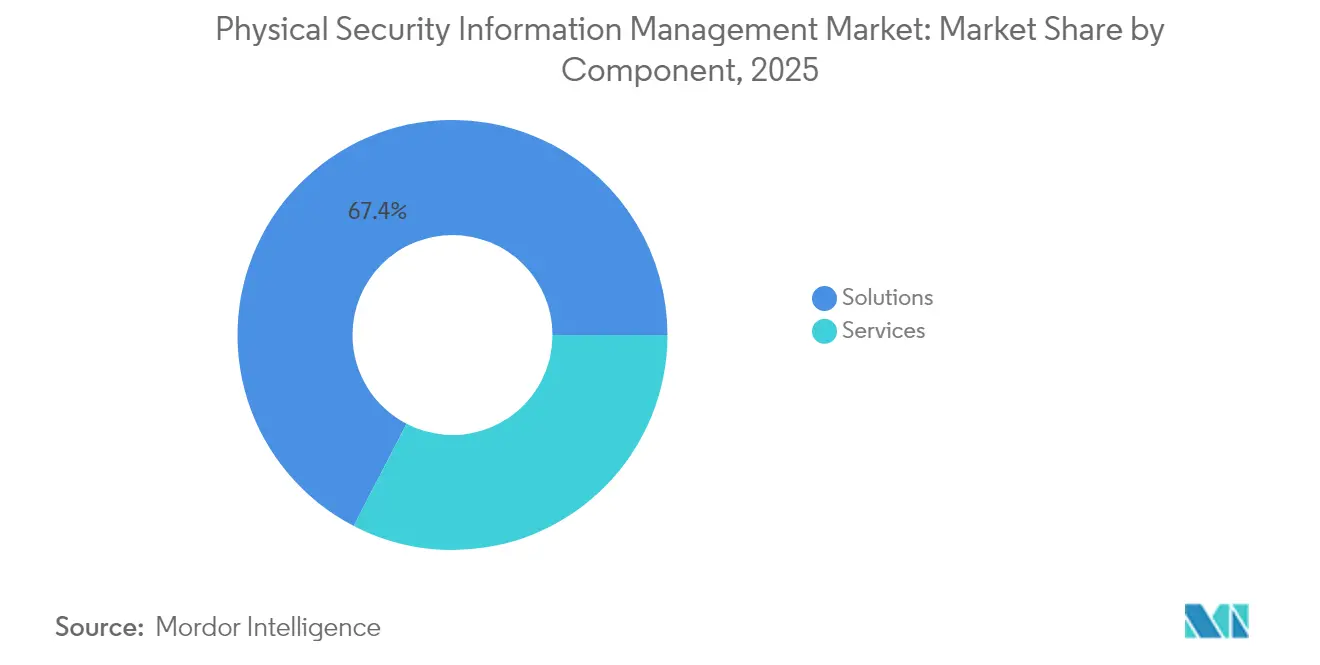
- By component, solutions accounted for 67.40% of the physical security information management market share in 2025; managed services are forecast to expand at a 16.25% CAGR to 2031.
- By deployment model, on-premise installations held 73.20% of the physical security information management market size in 2025, while cloud deployments are set to grow at an 17.55% CAGR through 2031.
- By end-user industry, transportation and logistics led with a 21.60% revenue share of the physical security information management market in 2025; healthcare is projected to accelerate at a 16.95% CAGR to 2031.
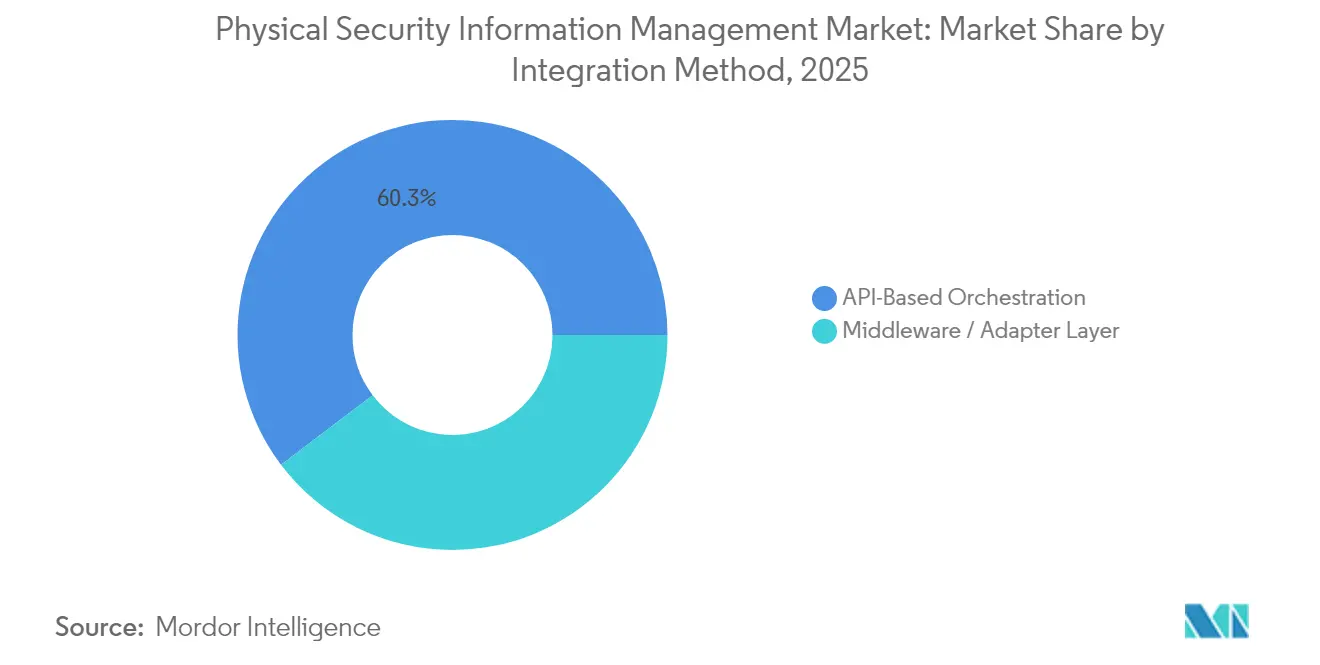
- By integration method, API-based Orchestration led with a 60.30% share of the physical security information management market in 2025; middleware/adapter layer is projected to accelerate at a 16.8% CAGR to 2031.
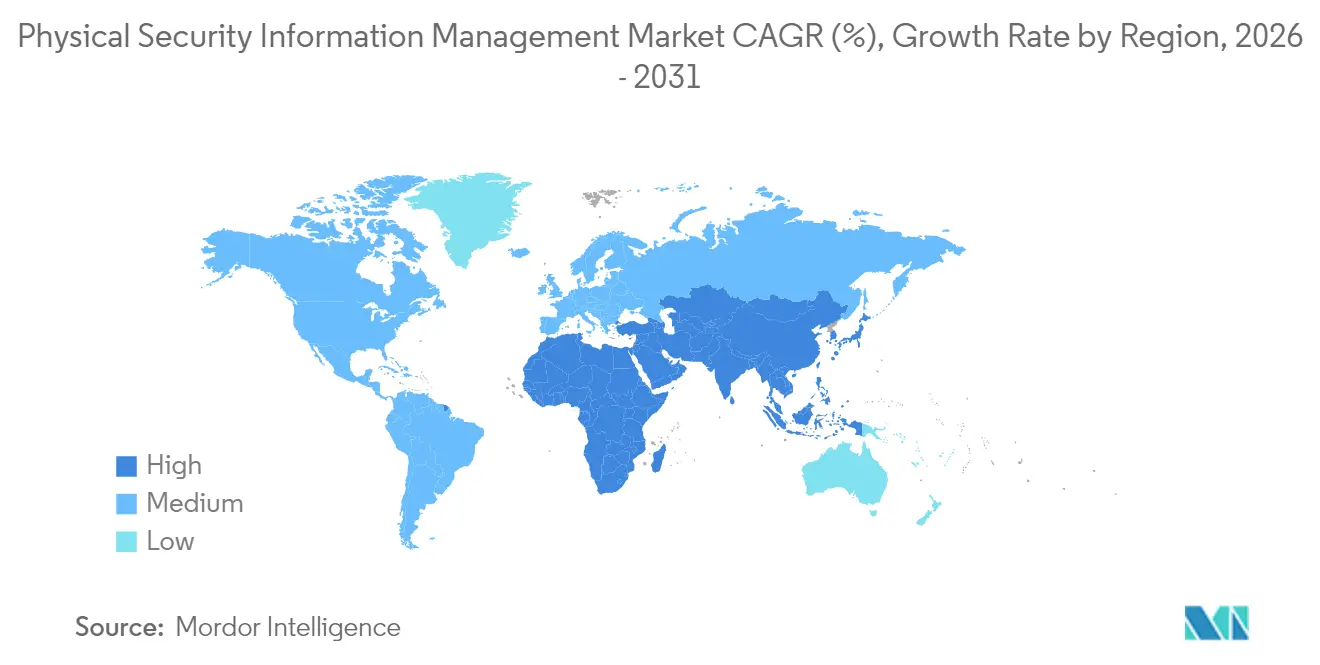
- By geography, North America captured 34.70% of the physical security information management market size in 2025, whereas Asia is poised to register the fastest 17.25% CAGR between 2026 and 2031.
Note: Market size and forecast figures in this report are generated using Mordor Intelligence’s proprietary estimation framework, updated with the latest available data and insights as of 2026.
Global Physical Security Information Management Market Trends and Insights
Drivers Impact Analysis*
| Driver | (~) % Impact on CAGR Forecast | Geographic Relevance | Impact Timeline |
|---|---|---|---|
| Proliferation of IoT-enabled Edge Sensors Driving Unified Command Platforms | +2.8 % | Global, with concentration in North America & Europe | Medium term (~ 3-4 yrs) |
| EU NIS2 & U.S. CISA Critical-Infrastructure Mandates Accelerating Adoption | +3.5 % | Europe & North America | Short term (≤ 2 yrs) |
| Asian Mega-Transit Projects Requiring Centralised Situational Awareness | +2.1 % | Asia, with focus on China, India, Japan | Medium term (~ 3-4 yrs) |
| Rapid Uptake of AI Video-Analytics Creating Demand for Open PSIM Orchestration | +3.2 % | Global, led by North America | Medium term (~ 3-4 yrs) |
| Hybrid-Work Security Gaps Fueling Physical-Cyber Converged Solutions | +1.8 % | North America & Europe | Short term (≤ 2 yrs) |
| Insurance Premium Discounts Linked to PSIM Compliance for Data Centres | +1.5 % | North America, with emerging impact in Europe | Long term (≥ 5 yrs) |
| Source: Mordor Intelligence | |||
Proliferation of IoT-enabled Edge Sensors
A surge to 41.6 billion connected devices by 2025 is driving record volumes of telemetry that siloed tools cannot correlate. Critical facilities now juggle more than 500 heterogeneous sensors, a 43% jump since 2022, compelling operators to adopt vendor-agnostic orchestration engines that normalize metadata and prioritize alerts.[1]Security Informed, "How Is The Internet Of Things (IoT) Impacting Physical Security?", securityinformed.comOpen APIs have become a must-have procurement criterion as security managers seek future-proof integration paths for smart cameras, environmental probes, and biometric endpoints. Heightened data granularity is also improving root-cause analysis, allowing response teams to trace event chains and shorten mean time to resolution. The resulting operational gains are reinforcing the business case for next-generation platforms across energy, utilities, and smart-city programs.
EU NIS2 and U.S. CISA Critical-Infrastructure Mandates
Regulatory pressure now carries meaningful financial teeth: the revised NIS2 framework sets penalties up to EUR 10 million (USD 11.3 million) for non-compliance, while CISA’s CIRCIA rule enforces 24- to 72-hour reporting windows. Operators in power, transport, and healthcare sectors are therefore accelerating platform upgrades that automate incident documentation, evidence retention, and audit trails. Procurement teams favor solutions delivering out-of-the-box policy templates, role-based access, and encryption controls that align with European GDPR requirements. Early adopters in finance and pharmaceuticals report smoother board approvals once compliance automation is quantified against potential fines. Vendors with native policy-mapping engines and pre-built regulator dashboards are consequently widening their addressable base.
Rapid Uptake of AI Video-Analytics
Enterprises deploy an average of 3.7 discrete analytics engines ranging from facial recognition to behavior analysis, complicating event correlation across proprietary stacks. Open PSIM layers reduce custom middleware effort by 30-40%, enabling security directors to swap algorithms without forklift upgrades. Transportation authorities leverage object-detection feeds to automate platform evacuation alerts, while data-center operators combine anomaly detection with badge-access logs to flag insider threats. Scalable GPU resources in cloud environments further entice end users to offload computationally intensive models. This confluence of AI specialization and orchestration flexibility elevates integration depth to a board-level KPI for digital risk mitigation.
Asian Mega-Transit Projects
Regional governments have earmarked USD 1.7 trillion for new rail and metro systems, multiplying surveillance endpoints and interagency coordination needs. China’s 45 planned metro deployments and India’s USD 23 billion urban-transit outlay require platforms that support multi-modal workflows across rail, bus, and aviation networks. Geospatial dashboards that render sensor status atop dynamic transport maps help control-room supervisors triage incidents, minimizing service interruptions. Domestic system-integrator shortages, however, inflate project timelines, prompting operators to engage global consultancies with turnkey delivery models. Standard-based interoperability is thus rising on request-for-proposal scorecards to future-proof long-lifecycle projects.
Restraints Impact Analysis*
| Restraint | (~) % Impact on CAGR Forecast | Geographic Relevance | Impact Timeline |
|---|---|---|---|
| Integration complexity with legacy systems | −2.1% | Europe, North America | Short term (≤ 2 years) |
| High up-front licensing and customization costs | −1.8% | Emerging markets | Medium term (2-4 years) |
| Source: Mordor Intelligence | |||
Integration Complexity with Legacy Analog and Proprietary Systems
Industrial plants and transport hubs often rely on proprietary protocols first deployed 15-20 years ago, elevating data normalization challenges that extend implementation timelines by up to 60%. Adapter layers frequently struggle to translate low-bandwidth serial feeds into modern data schemas, forcing integrators to script custom converters that raise the total cost of ownership. Energy utilities face the sharpest hurdles where SCADA interfaces resist open API exposure. The resulting project overruns dent stakeholder confidence and slow rollouts in sectors where downtime tolerance is close to zero. Vendors offering pre-certified driver libraries and migration toolkits are therefore gaining a comparative advantage.[2]Advancis Software & Services GmbH, "Increase security and save costs with an open PSIM Platform.", securityworldmarket.com
High Up-front Licensing & Customisation Costs
Tier-1 implementations command USD 100,000–500,000 in core licensing, with complex sites seeing duplicate outlays for professional services. Mid-market hospitals and secondary airports struggle to align these sums with capital budgets, especially when qualitative benefits like situational awareness resist straight-line ROI calculations. Annual maintenance, often pegged at 15-20% of licence value, further pressures operating expenditure. Managed-services bundles that shift spending from capex to opex are mitigating the sticker shock, yet CFOs continue to demand transparent payback models tied to insurance-premium reductions or labor efficiencies. Vendors showcasing consumption-based pricing and outcome-linked contracts are widening funnel conversion rates in cost-sensitive geographies.
*Our forecasts treat driver/restraint impacts as directional, not additive. The impact forecasts reflect baseline growth, mix effects, and variable interactions.
Segment Analysis
By Component: Services Momentum Builds on Solutions Base
Solutions retained a 67.40% slice of the physical security information management market share in 2025, anchored by perpetual licences and subscription renewals for command-and-control software. The physical security information management market size generated by solutions is buoyed by critical infrastructure refresh cycles and feature expansions such as AI plug-ins and geospatial dashboards.
However, managed services are set to chart a 16.25% CAGR, a pace outstripping the core software line. Demand is strongest among organizations lacking in-house operators for 24/7 monitoring, incident triage, and threat-hunting routines. Service providers leverage multitenant architectures to amortize analyst teams across contracts, offering clients predictable monthly outlays and service-level guarantees. Professional services—consulting, design, and integration continue to underpin complex rollouts, particularly where legacy PLCs, fire-alarm panels, and building-management systems must be bridged. Vendor success increasingly hinges on bundling advisory and run operations into cohesive outcome-based packages that ease buyer concerns over skill shortages and long-term platform upkeep.


By Deployment Model: Cloud Growth Outpaces On-Premise Dominance
On-premise systems controlled 73.20% of the physical security information management market size in 2025 as operators in utilities, defense, and financial services favored data-sovereign, air-gapped installations. These environments often integrate directly with emergency intercoms, access gates, and industrial controls that demand millisecond latencies and deterministic network behavior.
Yet, cloud deployments will expand at an 17.55% CAGR, fueled by demand for elastic compute to run AI inference, centralized reporting across distributed estates, and simplified patch management. Early adopters leverage cloud video surveillance to offload storage costs, routing only event flags to local edge devices for rapid interdiction. Hybrid architectures are gaining traction where sensitive streams stay on-site while analytics dashboards and machine-learning pipelines reside in regional data centers.
By Integration Method: API-Centric Orchestration Gains Strategic Primacy
API-based Orchestration holds a 60.30% share in 2025. It is eclipsing custom middleware as the preferred integration path, cutting deployment effort by 30-40% and enabling modular swap-outs of subsystems without cascading failures. Modern platforms expose RESTful endpoints, WebSocket streams, and event-driven architectures that align with enterprise application-integration strategies. This design ethos simplifies the onboarding of emerging analytics engines, robotics patrol units, and environmental sensors, preserving investment longevity.
However, Middleware is the fastest-growing segment by 16.8% CAGR. Middleware adapters remain indispensable for analogue CCTV and proprietary badge panels that lack direct software hooks; however, their share in new contracts is contracting as capital planners accelerate IP refresh cycles. Consistency in data schemas is enhancing downstream analytics, allowing security operations centers to overlay incident heat maps, KPI dashboards, and SLA metrics atop homogenized event logs.
By End-User Industry: Transportation Anchors Volume, Healthcare Accelerates
Transportation and logistics held a 21.60% revenue share of the physical security information management market in 2025, reflecting heavy investment by airports, seaports, and rail networks seeking synchronized incident management across sprawling assets. Use cases increasingly extend to operational metrics such as dwell-time analysis and resource scheduling, deepening platform stickiness. Public-private funding models, coupled with national critical-infrastructure mandates, ensure a steady pipeline of terminal expansions that sustain vendor order books.
Healthcare will record a 16.95% CAGR to 2031 as hospitals contend with workplace violence, pharmaceutical theft, and patient-safety incidents. Multi-building campuses require coordination between infant-tracking tags, fire-alarm systems, and emergency-department access controls, elevating demand for unified situational awareness.
Geography Analysis
North America commanded 34.70% of global revenue for the physical security information management market in 2025, underpinned by federal critical-infrastructure mandates and mature systems-integration ecosystems. Insurance carriers offering 15–30% premium incentives for verifiable monitoring platforms further encourage adoption, especially among colocation data-center operators and regional utilities. Convergence of physical and cyber telemetry remains a strategic agenda, with 68% of chief security officers noting incident overlaps since 2023.
Asia is projected to expand at an 17.25% CAGR through 2031, propelled by USD 1.7 trillion in transit megaprojects and escalating smart-city deployments. Local authorities prioritize centralized situational awareness to coordinate multi-agency responses across metro lines, bus terminals, and airports. Vendor strategies increasingly incorporate joint ventures with domestic integrators to offset skill shortages and comply with procurement localization rules. Asia will eclipse North America in physical security information management market size within the next decade.
Europe’s growth trajectory is tightly linked to the enforcement timetable for the NIS2 Directive, which broadens compliance scope to thousands of essential and important entities. Security leaders are deploying platforms that automate incident reporting, evidence archiving, and role-based escalation to satisfy regulators. Preference for open standards is pronounced, reflecting diverse installed bases across member states. Sustainability is emerging as a procurement criterion, with PSIM rollouts expected to integrate energy-management insights and contribute to corporate ESG disclosures.

Competitive Landscape
The physical security information management market exhibits moderate fragmentation, with diversified building-automation leaders, specialized PSIM vendors, and IT service providers vying for wallet share. Genetec, Johnson Controls, and Hexagon leverage entrenched customer relationships and global channel footprints to protect incumbency, bundling video-management and access-control suites into enterprise subscriptions. Boutique specialists such as Qognify and CNL Software differentiate through deep domain templates and rapid-integration toolkits that shorten time to value in transportation and healthcare verticals.
Strategic partnerships are accelerating product roadmaps and market access. CNL Software’s alliance with Cepton brings LiDAR-enabled 3D perimeter detection into its orchestration layer, strengthening value propositions for data-center and airport perimeters.[3]CNL Software, "CNL Software's IPSecurityCenter PSIM Software Provides Security Management for South African Hospital.", securityinformed.comCloud adoption is catalyzing collaboration between PSIM publishers and video-surveillance-as-a-service providers.
Investment priorities coalesce around AI augmentation and cloud-native architectures. Vendors are embedding real-time inference engines, automated playbooks, and predictive maintenance into baseline licences, creating upsell pathways into advanced analytics tiers. Simultaneously, migration to containerized microservices accelerates DevOps cycles, enabling fortnightly feature drops that keep pace with rapidly evolving threat landscapes.
Physical Security Information Management Industry Leaders
-
Johnson Controls International PLC
-
Genetec Inc.
-
Qognify Inc.
-
Verint Systems Inc.
-
Vidsys Inc.
- *Disclaimer: Major Players sorted in no particular order

Recent Industry Developments
- April 2025: Nanodems unveiled AI-driven analytics modules and broader integration toolkits for critical-infrastructure clients.
- March 2025: Google Cloud expanded its Risk Protection Program to 30 EMEA markets in partnership with Beazley and Chubb, linking insurance terms to deployment of unified security management.
- November 2024: i-PRO Americas secured a contract covering security upgrades across 6,000 educational facilities, emphasizing AI-based object detection.
- April 2024: Rockwell Automation issued guidance on NIS2 compliance for operational-technology environments, reinforcing the need for centralized incident orchestration.


Research Methodology Framework and Report Scope
Market Definitions and Key Coverage
Our study defines the physical security information management (PSIM) market as software platforms that ingest data from otherwise unconnected surveillance, access-control, fire, and building-automation systems, correlate events in real time, and deliver a single command-and-control interface for incident response and reporting. According to Mordor Intelligence, revenue refers only to license, subscription, and embedded analytics fees sold by PSIM platform vendors or system integrators, with allied configuration services counted when they are inseparable from the platform contract.
Scope Exclusions: Pure-play video management systems, hardware devices, and standalone identity-management software are out of scope.
Segmentation Overview
-
By Component
-
Solutions
- Video / Incident Management
- Access-Control Integration
- Command-and-Control Dashboards
- Case and Evidence Management
-
Services
- Professional (Consulting, Design and Integration)
- Managed and Support
-
Solutions
-
By Deployment Model
- On-premise
- Cloud
- Hybrid
-
By Integration Method
- API-Based Orchestration
- Middleware / Adapter Layer
-
By End-user Industry
- BFSI
- Government and Defense
-
Transportation and Logistics
- Airports
- Maritime Ports
- Rail and Metro
- Energy and Utilities
- Retail
- Healthcare
- Manufacturing and Industrial
- Education
- IT and Telecom
-
By Geography
-
North America
- United States
- Canada
- Mexico
-
South America
- Brazil
- Argentina
- Rest of South America
-
APAC
- China
- India
- Japan
- South Korea
- Australia
- New Zealand
- Rest of APAC
-
Europe
- Germany
- United Kingdom
- France
- Italy
- Nordics
- Rest of Europe
-
Middle East and Africa
- Saudi Arabia
- UAE
- Turkey
- South Africa
- Rest of Middle East and Africa
-
North America
Detailed Research Methodology and Data Validation
Primary Research
We interviewed PSIM architects at integrators, facility-security managers in transportation, energy, and healthcare, and regional distributors across North America, Europe, the Gulf, and East Asia. Their insights bridged data gaps on adoption triggers, cloud migration pacing, and typical service-bundle ratios, enabling us to refine assumptions and validate preliminary findings.
Desk Research
We gathered foundational data from reputable, open sources such as the U.S. Federal Energy Regulatory Commission critical-infrastructure filings, ONVIF compliance databases, International Association of Chiefs of Police incident reports, Eurostat smart-city deployment statistics, and patent analytics from Questel. Company 10-Ks, investor calls, certified integrator price lists, and regional trade-association white papers complemented the public record.
To cross-verify commercial traction, we tapped paid resources including D&B Hoovers for vendor financials and Dow Jones Factiva for deal flow; these inputs helped us benchmark average selling prices and regional revenue splits. Numerous additional secondary sources were reviewed; the list above is illustrative, not exhaustive.
Market-Sizing & Forecasting
A top-down demand-pool build grounded in the population of networked surveillance channels and smart-city command centers was corroborated with selective bottom-up roll-ups of integrator shipments and sampled ASP × active-site volumes. Key variables in our model include (1) annual growth in connected security sensors, (2) number of tier-1 smart-city projects commissioned, (3) average security-breach incident rates, (4) cloud migration share, and (5) regional labor-cost indices that influence service pricing. Multivariate regression links these drivers to PSIM spend, while scenario analysis stress-tests optimistic and conservative uptake paths. Gaps in granular bottom-up estimates are infilled through weighted peer benchmarks agreed during expert calls.
Data Validation & Update Cycle
Our analysts re-check model outputs against independent import data, vendor guidance, and anomaly thresholds. Variances trigger a secondary review before sign-off. Reports refresh annually; material events prompt interim tweaks, and a closing validation pass ensures clients receive the freshest view.
Why Mordor's Physical Security Information Management Market Baseline Proves Reliable and Balanced
Published estimates often diverge because publishers pick different functional definitions, count hardware revenue, or apply uniform growth rates to every region.
Key gap drivers here include scope (some firms fold wider unified-security platforms into PSIM), forecast cadence, and unvetted price assumptions; our study, by contrast, locks definition early, refreshes variables yearly, and triangulates each data point with practitioner feedback.
Benchmark comparison
| Market Size | Anonymized source | Primary gap driver |
|---|---|---|
| USD 1.93 B (2025) | Mordor Intelligence | - |
| USD 3.72 B (2024) | Global Consultancy A | Bundles VMS and access-control hardware, relies mainly on vendor revenue roll-ups |
| USD 3.50 B (2024) | Industry Journal B | Uses single global ASP, limited regional adjustment, modest refresh cadence |
| USD 1.70 B (2024) | Research Publisher C | Excludes services revenue and industrial smart-city deployments |
The comparison shows that when scope, pricing curves, and regional realities are aligned through the disciplined approach we follow, Mordor's baseline offers a balanced, transparent anchor that decision-makers can trust for planning and investment.


Key Questions Answered in the Report
What is driving the strong growth of the physical security information management market?
Unified sensor orchestration, stricter regulatory mandates, and AI-enabled analytics are persuading operators to replace siloed tools with integrated command platforms that improve compliance and risk mitigation.
Which region will grow fastest between 2026 and 2031?
Asia is forecast to register an 17.25% CAGR, buoyed by USD 1.7 trillion in transport infrastructure projects and expansive smart-city programs.
Why are managed services gaining traction within the physical security information management industry?
Organizations lacking 24/7 security operations centers outsource monitoring and incident response to service providers, exchanging high capital outlays for predictable operating expenses.
How are new regulations influencing platform adoption?
Frameworks such as the EU NIS2 Directive and U.S. CISA mandates impose steep penalties for non-compliance, prompting critical-infrastructure operators to deploy automated incident-documentation and reporting capabilities.
What challenges slow down PSIM deployments?
High up-front licensing fees and the need to integrate legacy analogue systems can extend project timelines by up to 60% and inflate costs by about 35%, particularly in mature facilities.
Page last updated on:


