Security Services Market Size and Share
Market Overview
| Study Period | 2020 - 2031 |
|---|---|
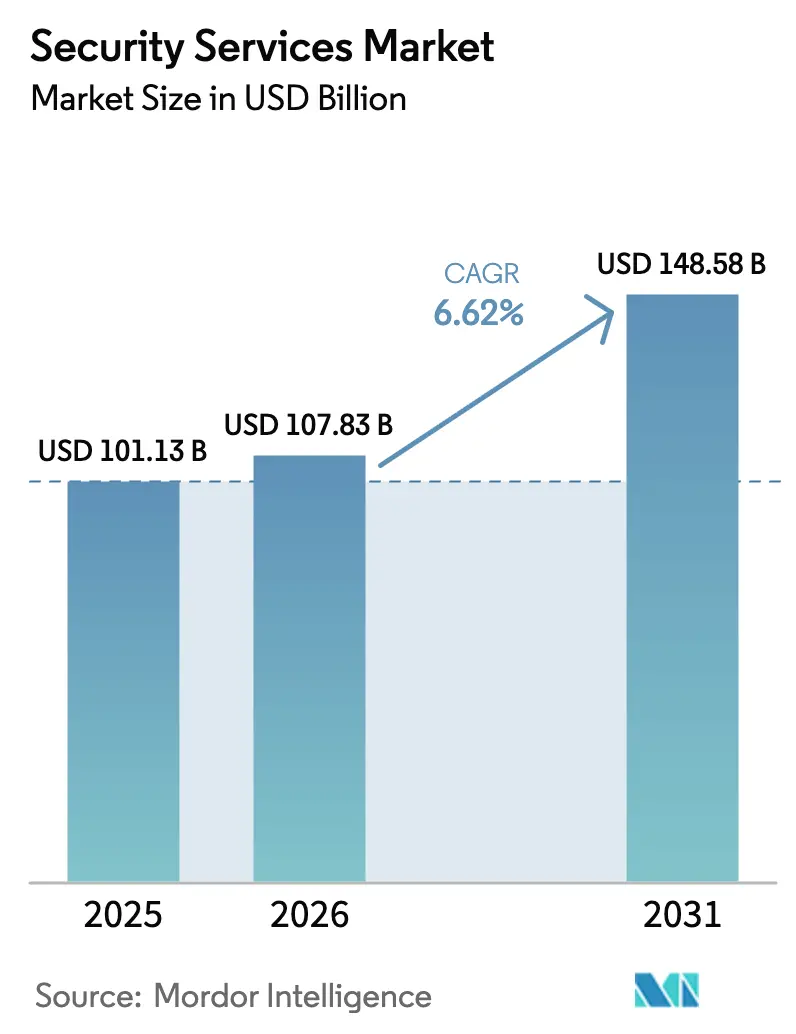
| Market Size (2026) | USD 107.83 Billion |
| Market Size (2031) | USD 148.58 Billion |
| Growth Rate (2026 - 2031) | 6.62% CAGR |
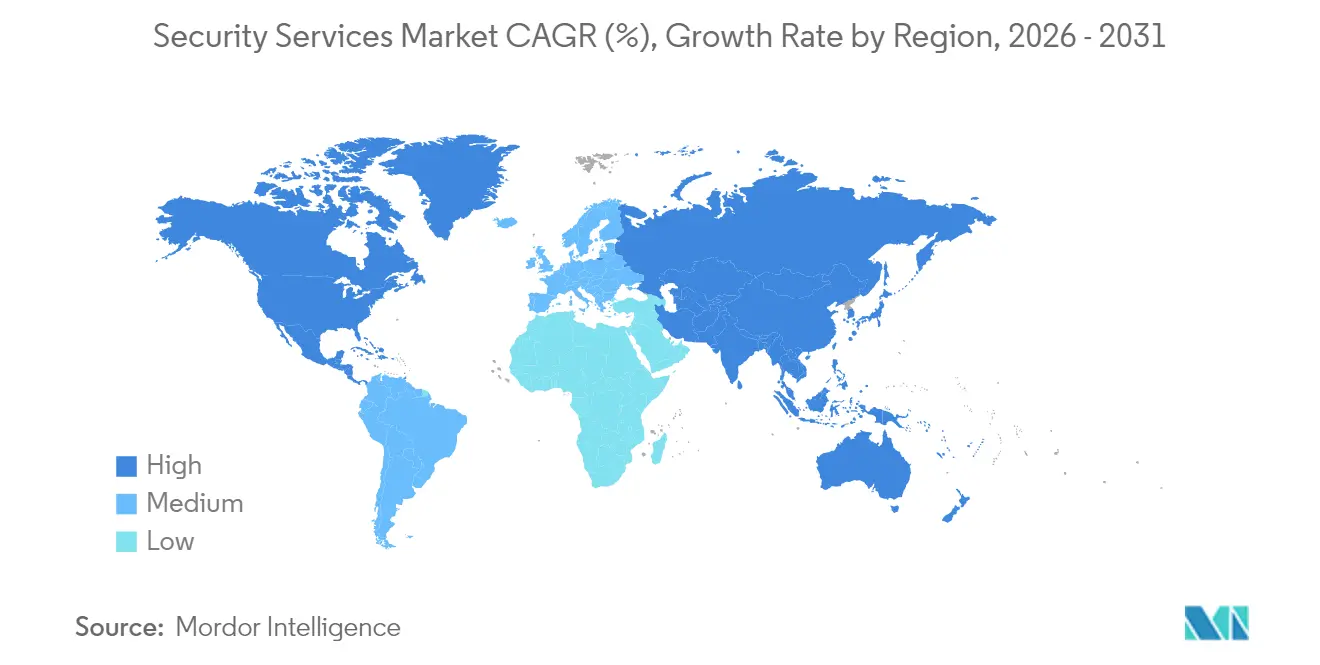
| Fastest Growing Market | Asia Pacific |
| Largest Market | North America |
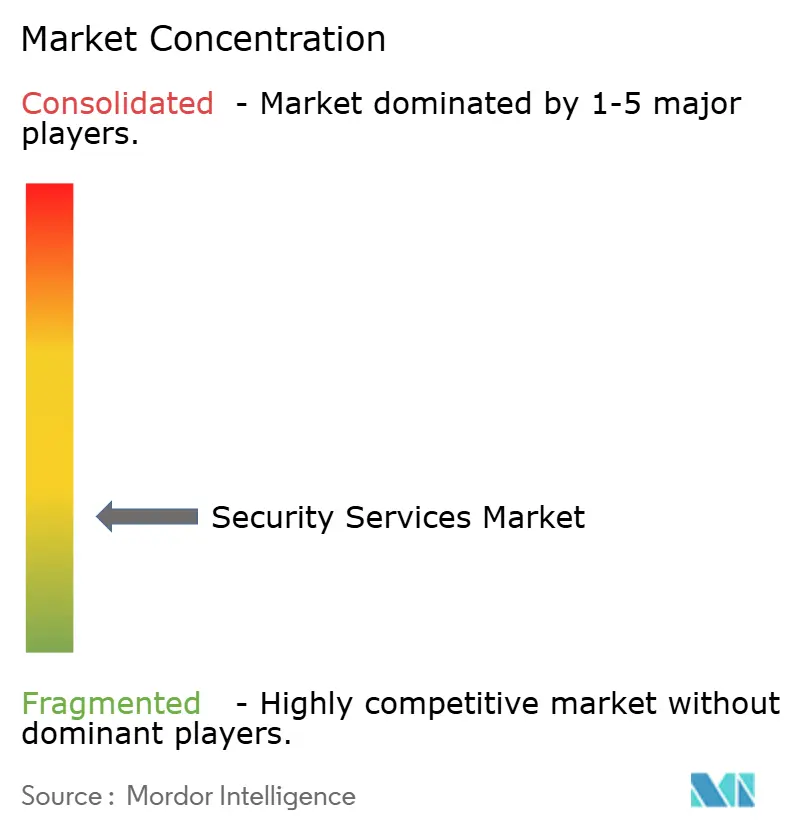
| Market Concentration | Low |
Major Players *Disclaimer: Major Players sorted in no particular order Image © Mordor Intelligence. Reuse requires attribution under CC BY 4.0. | |
Security Services Market Analysis by Mordor Intelligence
The security services market size in 2026 is estimated at USD 107.83 billion, growing from 2025 value of USD 101.13 billion with 2031 projections showing USD 148.58 billion, growing at 6.62% CAGR over 2026-2031. The rapid outsourcing of cybersecurity operations, rising regulatory scrutiny, and widening skills gaps are driving the demand for managed detection, response, and advisory services. Zero-trust architecture mandates, proliferating 5G/IoT deployments, and cloud-first enterprise strategies are expanding attack surfaces faster than internal teams can cope, prompting heavier reliance on external providers. Cloud-delivered platforms now anchor most new contracts because they scale rapidly during incidents, while AI-powered analytics shorten dwell time and shrink breach costs. Heightened competitive pressure is encouraging regional specialists to carve out niches in verticals such as healthcare and critical infrastructure, even as leading global players consolidate capabilities through frequent acquisitions.
Key Report Takeaways
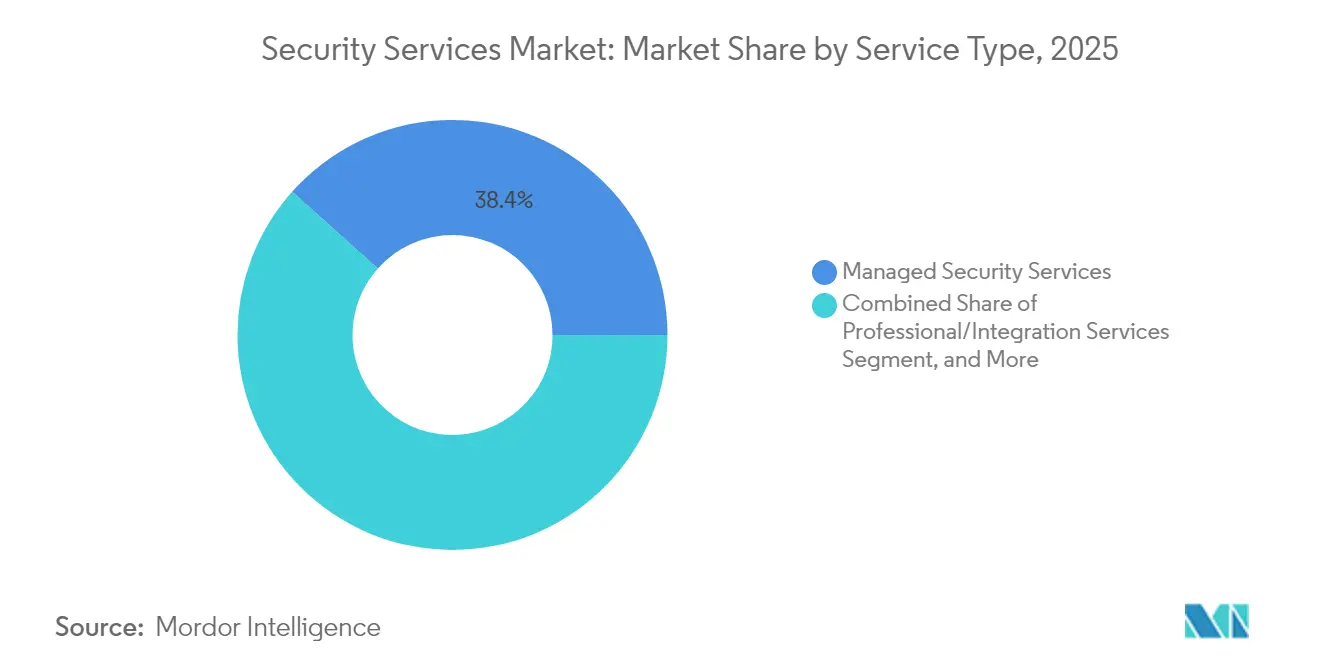
- By service type, managed security services led with a 38.40% revenue share in 2025, whereas incident response and MDR services are projected to grow at an 7.88% CAGR through 2031.
- By deployment mode, cloud-based offerings captured 55.60% of the security services market share in 2025; hybrid and cloud deployments together are forecast to post a 7.78% CAGR through 2031.
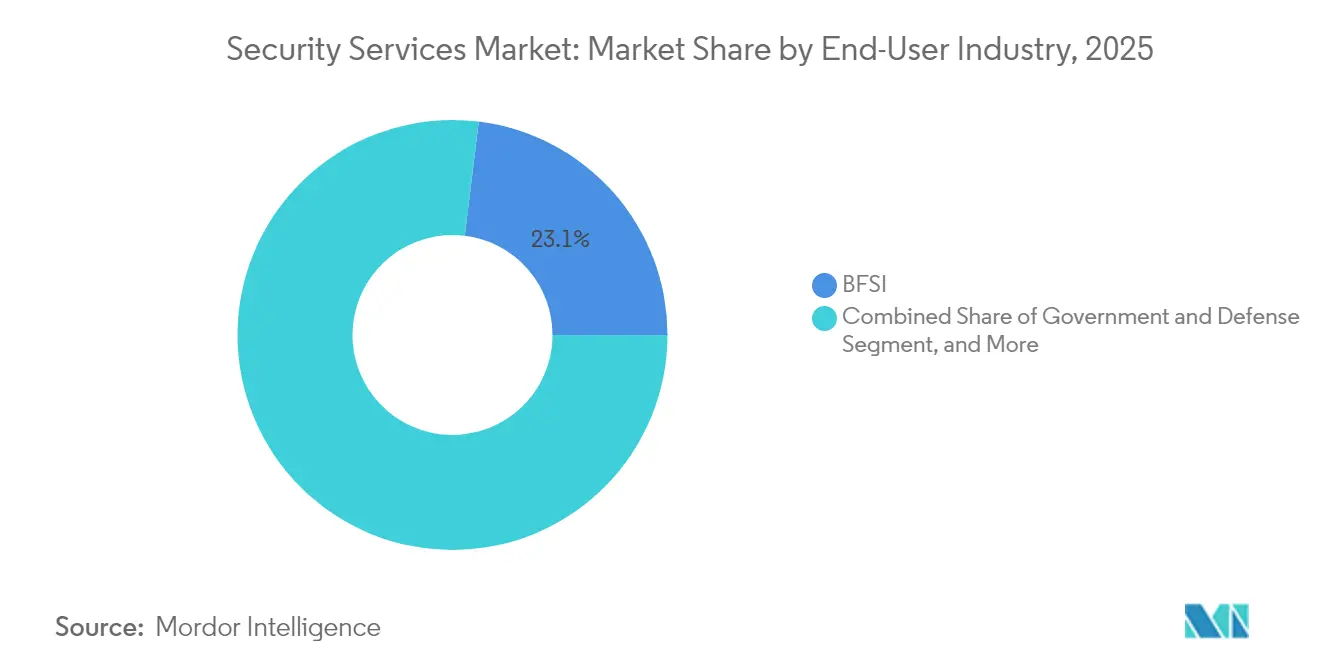
- By end-user industry, BFSI accounted for 23.05% revenue in 2025, while healthcare and life sciences are projected to expand at a 7.41% CAGR during the same horizon.
- By security framework, zero-trust architecture held a 30.85% stake in the security services market and is set to register the fastest 7.60% CAGR from 2026 to 2031.
- By geography, North America held a 33.85% stake in the security services market in 2025, whereas the Asia-Pacific region is set to register the fastest 8.33% CAGR from 2026 to 2031.
Note: Market size and forecast figures in this report are generated using Mordor Intelligence’s proprietary estimation framework, updated with the latest available data and insights as of 2026.
Global Security Services Market Trends and Insights
Drivers Impact Analysis*
| DRIVER | (~) % IMPACT ON CAGR FORECAST | GEOGRAPHIC RELEVANCE | IMPACT TIMELINE |
|---|---|---|---|
| Escalating regulatory and data-sovereignty mandates | +1.8% | Europe, North America, global spill-over | Medium term (2-4 years) |
| Talent shortage in cyber-operations (MSSP outsourcing) | +2.1% | Asia-Pacific, Middle East and Africa, global | Long term (≥ 4 years) |
| Accelerated 5G/IoT rollout expanding attack surface | +1.5% | Asia-Pacific core, North America, Europe | Medium term (2-4 years) |
| AI-enabled threat detection improving ROI | +1.3% | North America, Europe, expanding to Asia-Pacific | Short term (≤ 2 years) |
| Supply-chain–driven zero-trust adoption by OEMs | +1.2% | Global, with concentration in manufacturing hubs | Medium term (2-4 years) |
| Quantum-readiness projects in critical infrastructure | +0.9% | North America, Europe, select Asia-Pacific markets | Long term (≥ 4 years) |
| Source: Mordor Intelligence | |||
Escalating Regulatory and Data-Sovereignty Mandates
Governments on every continent are tightening breach-notification windows and extending director liability, prompting enterprises to adopt always-on managed programs that ensure continuous monitoring and rapid response.[1]Source: ITPro, “Global security spending continues to rise,” itpro.com The European Union’s NIS2 Directive, the United States’ zero-trust executive order, and India’s CERT-In reporting rules are converging on similar audit demands that many in-house teams cannot meet. Financial institutions have been the first to react, with 73% increasing their cyber budgets in 2025 to comply with layered standards such as PCI DSS and DORA. Demonstrable compliance confers a competitive advantage, as public-sector tenders now award points for third-party attested controls. Consequently, providers with deep regulatory expertise are commanding premium pricing and longer contract terms.
Talent Shortage in Cyber-Operations (MSSP Outsourcing)
The worldwide shortfall of roughly 4 million qualified practitioners is widening despite record hiring budget.[2]Source: World Bank Group, “Cybersecurity Economics for Emerging Markets,” worldbank.org Building a 24×7 security operations center typically takes up to two years and costs 40–60% more than outsourcing, once recruitment, retention bonuses, and tooling are included. Mid-market organizations feel the pinch most acutely and increasingly opt for subscription-based SOC services that bundle threat hunting and compliance reporting. In Asia-Pacific, the skills gap exceeds 2 million workers, driving double-digit growth for regional MSSPs able to localize reporting in multiple languages. Specialized talent pools around cloud forensics, operational-technology (OT) security, and incident response are becoming decisive differentiators in contract awards.
Accelerated 5G/IoT Rollout Expanding Attack Surface
Every new IoT sensor multiplies potential attack vectors, and 5G network slicing introduces micro-perimeters that demand round-the-clock visibility. Smart factories now generate as many as 50× more security events than legacy IT estates, overwhelming traditional SIEM deployments. Providers are responding with device discovery engines, behavior analytics trained on OT protocols, and automated isolation workflows that minimize unplanned downtime. Manufacturing, utilities, and logistics customers are adopting these specialized offerings early, seeking to contain lateral movement across converged IT-OT environments. As telecom operators extend private 5G to enterprises, bundled security services are emerging as a default upsell.
AI-Enabled Threat Detection Improving ROI of Services
Machine-learning models embedded in managed detection and response platforms reduce false-positive rates by nearly half and decrease the mean time to respond by 60% compared to rule-based systems.[3]Source: Business Wire, “Armis Acquires AI Cybersecurity Company CTCI,” businesswire.com Providers operationalize thousands of proprietary and open-source signals to create “detection as code” pipelines that can ship new analytics within hours of a zero-day disclosure. The resulting efficiency enables per-node pricing that appeals to cost-sensitive clients while preserving provider margins. Customers report 35% fewer successful attacks after deploying AI-driven MDR, reinforcing the willingness to shift budget from capital-intensive tooling toward outcome-based service contracts.
Restraints Impact Analysis*
| RESTRAINT | (~) % IMPACT ON CAGR FORECAST | GEOGRAPHIC RELEVANCE | IMPACT TIMELINE |
|---|---|---|---|
| Budget compression amid “tech-spend plateau” 2025-26 | -1.4% | Global, SME segment | Short term (≤ 2 years) |
| Vendor lock-in and interoperability gaps | -0.8% | North America, Europe, Asia-Pacific | Medium term (2-4 years) |
| Low cyber-insurance penetration in emerging markets | -0.6% | South America, Africa, Southeast Asia | Long term (≥ 4 years) |
| Sovereign cloud policies limiting global MSS scale | -0.5% | China, Russia, select Europe markets, India | Medium term (2-4 years) |
| Source: Mordor Intelligence | |||
Budget Compression Amid “Tech-Spend Plateau” 2025-26
After multiple years of double-digit outlays, many enterprises are pausing discretionary projects to digest prior digital investments.[4]Source: ITPro, “Global security spending continues to rise,” itpro.com Security remains a board-level priority, yet many organizations have delayed service expansions or tool upgrades in 2025. Small and midsize businesses face the greatest squeeze and increasingly demand consumption-based pricing, shorter contract durations, and modular feature sets. Providers are adjusting sales motions accordingly, emphasizing quick-start packages and outcome guarantees to ease budget approvals. The plateau is expected to ease by 2027 as deferred regulatory deadlines come into effect.
Vendor Lock-in and Service Stack Interoperability Gaps
Enterprises wary of single-supplier dependence are scrutinizing proprietary APIs and data formats that inhibit migration between MSSPs. Complex estates often blend Microsoft, Palo Alto Networks, CrowdStrike, and AWS services, and any security partner must demonstrate seamless integration without forcing wholesale rip-and-replace. Lack of interoperability inflates operating costs and prolongs incident investigations, eroding perceived value. Customers increasingly prefer providers who certify against open standards, publish transparent playbooks, and endorse bring-your-own-license models for core analytics platforms. Providers that struggle to interpret risk exclusions in extensive multi-year tenders face the threat of disqualification or significant contractual liabilities.
*Our forecasts treat driver/restraint impacts as directional, not additive. The impact forecasts reflect baseline growth, mix effects, and variable interactions.
Segment Analysis
By Service Type: Managed Offerings Command Mindshare While MDR Surges
Managed security services accounted for 38.40% of 2025 revenue, underscoring enterprises’ preference for outsourced 24/7 monitoring and response. This slice equates to the largest security services market share among all service categories. Incident response and MDR solutions are projected to post an 7.88% CAGR to 2031, reflecting an urgent pivot toward proactive threat hunting. The security services market size for MDR is expected to widen as zero-trust rollouts mature and require continuous validation. Providers are combining threat intelligence with automated orchestration to reduce the mean time to contain, a capability that resonates with heavily regulated sectors.
Packaging is evolving toward unified subscriptions that blend prevention, detection, and compliance reporting. Customers increasingly reject siloed point contracts in favor of platforms that cover the full life cycle from risk assessment to post-breach forensics within a single SLA. Professional and integration services remain relevant for bespoke zero-trust architecture builds, while consulting engagements spike before new regulations take effect. Providers that accelerate migration from one-off consulting to recurring MDR retain higher margins and defensible renewal rates.


By Deployment Mode: Cloud Builds Scale, Hybrid Balances Control
Cloud deployments captured 55.60% of 2025 revenue, demonstrating the market's shift toward on-demand scalability in security services. The associated security services market size is projected to expand at a 7.78% CAGR through 2031 as enterprises consolidate tooling in SaaS consoles. Elastic capacity proves critical during surges, such as ransomware outbreaks, when log volume can spike 20 times baseline levels. Cloud platforms also simplify integration with DevSecOps pipelines, enabling inline code scanning and policy enforcement.
On-premise installations persist in sectors bound by data-residency or ultra-low-latency mandates, although most new deals adopt a hybrid model that combines local collectors with cloud analytics. This architecture satisfies regulators while still tapping machine-learning engines hosted in multiregion data centers. Providers are adding policy engines that route sensitive telemetry to sovereign clouds, ensuring compliance without sacrificing analytic depth. As confidential computing matures, remaining barriers to full cloud migration are expected to diminish.
By End-User Industry: Financial Services Dominate, Healthcare Accelerates
BFSI organizations accounted for 23.05% of 2025 revenue, holding the largest single security services market share due to stringent standards such as PCI DSS, SOX, and Basel III. High attack frequency from organized crime and nation-state actors drives spending on threat intelligence and real-time fraud analytics. The segment also values managed cryptographic key services, essential for rapid product launches in mobile banking.
The healthcare and life sciences sectors are forecasted to post a 7.41% CAGR through 2031, the fastest among all verticals. Electronic health records, connected diagnostic devices, and telemedicine apps collectively swell the security services market size for this sector. Providers must master both HIPAA and FDA device guidance, making deep domain knowledge a competitive prerequisite. Elsewhere, industrial control customers blend IT and OT safeguards to counter ransomware targeting production lines, while transportation adopts continuous vendor risk monitoring to secure sprawling supply chains.
By Security Framework: Zero-Trust Gains Momentum Worldwide
Zero-trust architecture is forecasted to post a 7.60% CAGR through 2031, the fastest among all verticals, as its security services market size expands with the normalization of remote work. ISO/IEC-aligned programs remain prevalent in Europe and certain parts of Asia, where multinational footprints necessitate uniform controls across borders. NIST CSF adoption continues to grow globally owing to its prescriptive yet flexible structure.
Framework selection increasingly mirrors geopolitical priorities: European clients emphasize data sovereignty clauses, Asia-Pacific customers prioritize incident response maturity benchmarks, and Latin American firms rely on ISO certifications to meet the demands of foreign partners during audits. Providers fluent in multiple frameworks and able to cross-map controls on unified dashboards enjoy shorter sales cycles and stickier renewals.
Geography Analysis
North America retained its leadership position with a 33.85% revenue share in 2025, driven by stringent federal requirements and mature enterprise security budgets. Steady consolidation among platform-centric MSSPs and accelerated zero-trust mandates inside critical infrastructure are lifting regional growth to a projected 6.09% CAGR. Demand surges during election cycles further reinforces spending on managed threat intelligence and disinformation monitoring.
Europe follows with a broad but fragmented uptake, shaped by the GDPR and emerging NIS2 enforcement. Multi-jurisdictional expertise differentiates providers able to offer single-pane reporting across Germany, France, and the Nordics. Cloud sovereignty projects encourage localized data centers, creating opportunities for regional midsize MSSPs. The adoption of ISO/IEC frameworks remains the baseline, with many enterprises layering industry-specific schemes, such as TISAX, for automotive supply chains.
The Asia-Pacific region represents the fastest trajectory, with an 8.33% CAGR, driven by government-funded digital nation roadmaps, 5G rollouts, and a persistent talent gap. China, Japan, Australia, and India collectively account significant share of regional spend, yet Southeast Asia is closing fast as foreign investors demand auditable cyber controls. Sovereign-cloud initiatives and data-localization rules offer domestic providers a protective moat against global incumbents. The Middle East and Africa remain nascent but are drawing infrastructure funds into GCC security hubs that export SOC services to neighboring countries.
Mordor Intelligence provides coverage of the security services market across other key regional markets, including North America, Europe, Asia, and Latin America, each with their regulatory frameworks and demand patterns.

Competitive Landscape
The top 10 vendors controlled a significant share of global revenue in 2024, indicating moderate concentration and leaving headroom for niche specialists. Persistent consolidation is the hallmark of the security services market, with 37 acquisition deals disclosed in December 2024 alone. Acquirers target capabilities in exposure management, AI-driven threat hunting, and OT security to deepen platform breadth. Recent tie-ups, such as Tenable’s purchase of Vulcan Cyber for USD 147 million, illustrate the premium placed on automated remediation workflows.
Strategic positioning increasingly revolves around platform specialization. Providers anchoring on ecosystems such as Microsoft Sentinel or CrowdStrike Falcon publish pre-built content packs that accelerate deployment and reduce integration friction. Vertical depth provides another lever: firms fluent in healthcare device protocols or energy-sector standards routinely displace generalists, despite operating on a smaller scale. To defend share, incumbents invest in detection-as-code pipelines that ship new analytics hours after disclosure, delivering measurable time-to-protection advantages. Regional champions leverage language fluency, regulatory familiarity, and proximity to outmaneuver global peers in emerging markets.
Pricing innovation is gaining traction as customers demand outcome-based models. Some MSSPs now tie fees to measurable KPIs such as dwell-time reduction or audit-finding closure rates. Others offer tiered packaging that combines baseline monitoring with optional zero-trust design, penetration testing, or ransomware tabletop exercises. Certifications like ISO 27001 and SOC 2 Type II are universal entry tickets, while sector-specific credentials PCI QSA, HITRUST, or IEC 62443, form durable moats.
Security Services Industry Leaders
IBM Corporation
Secureworks Inc.
Fujitsu Ltd.
Wipro Ltd.
Capgemini SE
- *Disclaimer: Major Players sorted in no particular order

Recent Industry Developments
- February 2025: Tenable Holdings completed its acquisition of Vulcan Cyber for USD 147 million, adding automated risk prioritization and remediation workflows to the Tenable One platform.
- February 2025: CSIS Security Group bought Security Alliance Limited to strengthen managed detection, emergency response, and operational intelligence capabilities across Europe.
- February 2025: Armis acquired AI firm CTCI, integrating pre-attack threat-hunting features into the Armis Centrix platform.
- January 2025: Simulint purchased Alpine Cyber Solutions as an opening gambit to build a holistic platform for SMB cybersecurity services.


Global Security Services Market Report Scope
Security services are processes or comprehensive services that improve an organization's protection and security against common cyberattacks, including phishing, malicious software, and ransomware. These services encompass design and integration, deployment, risk and threat analysis, and consultation. Managed and hosted security services and solutions can be supplemented using cloud services, artificial intelligence (AI), biometrics, Internet of Things (IoT), and other remote services.
The security services market is segmented by service type (managed security services, professional security services, consulting services, and threat intelligence security services), mode of deployment (on-premise and cloud), end-user industry (IT and infrastructure, government, industrial, healthcare, transportation, and logistics, banking, and other end-user industries), and geography (North America [United States and Canada], Europe [Germany, United Kingdom, France, and Rest of Europe], Asia-Pacific [India, China, Japan, and Rest of Asia-Pacific], Latin America, and Middle East and Africa). The market sizes and forecasts are provided in terms of value (USD) for all the above segments. The report also covers the overall impact of COVID-19 aftereffects and other macroeconomic trends on the market.
| Managed Security Services |
| Professional/Integration Services |
| Consulting and Assessment Services |
| Threat-Intelligence and Hunting Services |
| Incident Response and MDR Services |
| On-premises |
| Cloud |
| IT and Telecom |
| Government and Defense |
| BFSI |
| Healthcare and Life Sciences |
| Industrial and Critical Infrastructure |
| Transportation and Logistics |
| Other End-user Industries |
| Zero-Trust Architecture |
| ISO/IEC-based Managed Services |
| NIST CSF-aligned Services |
| North America | United States | |
| Canada | ||
| Mexico | ||
| South America | Brazil | |
| Argentina | ||
| Rest of South America | ||
| Europe | Germany | |
| United Kingdom | ||
| France | ||
| Italy | ||
| Rest of Europe | ||
| Asia-Pacific | China | |
| Japan | ||
| India | ||
| South Korea | ||
| South-East Asia | ||
| Rest of Asia-Pacific | ||
| Middle East and Africa | Middle East | Saudi Arabia |
| United Arab Emirates | ||
| Rest of Middle East | ||
| Africa | South Africa | |
| Egypt | ||
| Rest of Africa | ||
| By Service Type | Managed Security Services | ||
| Professional/Integration Services | |||
| Consulting and Assessment Services | |||
| Threat-Intelligence and Hunting Services | |||
| Incident Response and MDR Services | |||
| By Deployment Mode | On-premises | ||
| Cloud | |||
| By End-user Industry | IT and Telecom | ||
| Government and Defense | |||
| BFSI | |||
| Healthcare and Life Sciences | |||
| Industrial and Critical Infrastructure | |||
| Transportation and Logistics | |||
| Other End-user Industries | |||
| By Security Framework | Zero-Trust Architecture | ||
| ISO/IEC-based Managed Services | |||
| NIST CSF-aligned Services | |||
| By Geography | North America | United States | |
| Canada | |||
| Mexico | |||
| South America | Brazil | ||
| Argentina | |||
| Rest of South America | |||
| Europe | Germany | ||
| United Kingdom | |||
| France | |||
| Italy | |||
| Rest of Europe | |||
| Asia-Pacific | China | ||
| Japan | |||
| India | |||
| South Korea | |||
| South-East Asia | |||
| Rest of Asia-Pacific | |||
| Middle East and Africa | Middle East | Saudi Arabia | |
| United Arab Emirates | |||
| Rest of Middle East | |||
| Africa | South Africa | ||
| Egypt | |||
| Rest of Africa | |||


Key Questions Answered in the Report
What is the current valuation of the security services market?
The security services market size reached USD 107.83 billion in 2026 and is projected to grow to USD 148.58 billion by 2031.
Which region leads spending on outsourced cybersecurity services?
North America leads with a 33.85% revenue share thanks to mature compliance mandates and sizable enterprise budgets.
Which service category is expanding the quickest?
Incident response and managed detection and response services are forecast to grow at an 7.88% CAGR through 2031.
Why are healthcare organizations accelerating security spending?
Digital health records and connected medical devices amplify attack surfaces, pushing healthcare to a projected 7.41% CAGR.
How is cloud adoption influencing security procurement?
Cloud deployments already represent 55.60% of revenue and are expected to continue rising, as they deliver elastic analytics and faster incident response.
What is driving provider consolidation?
Enterprises prefer integrated platforms, prompting frequent acquisitions that add exposure management, AI analytics, and OT security capabilities.
Page last updated on:


