E-commerce Fulfillment Packaging Automation Market Size and Share
Market Overview
| Study Period | 2019 - 2030 |
|---|---|
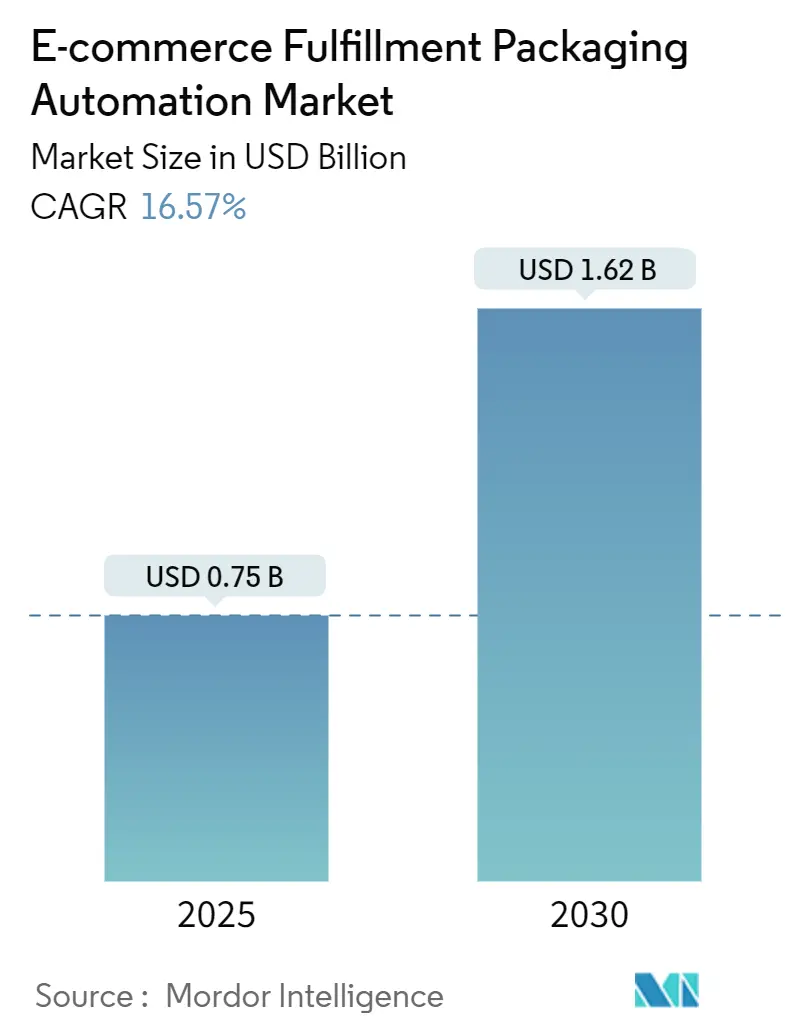
| Market Size (2025) | USD 0.75 Billion |
| Market Size (2030) | USD 1.62 Billion |
| Growth Rate (2025 - 2030) | 16.57% CAGR |
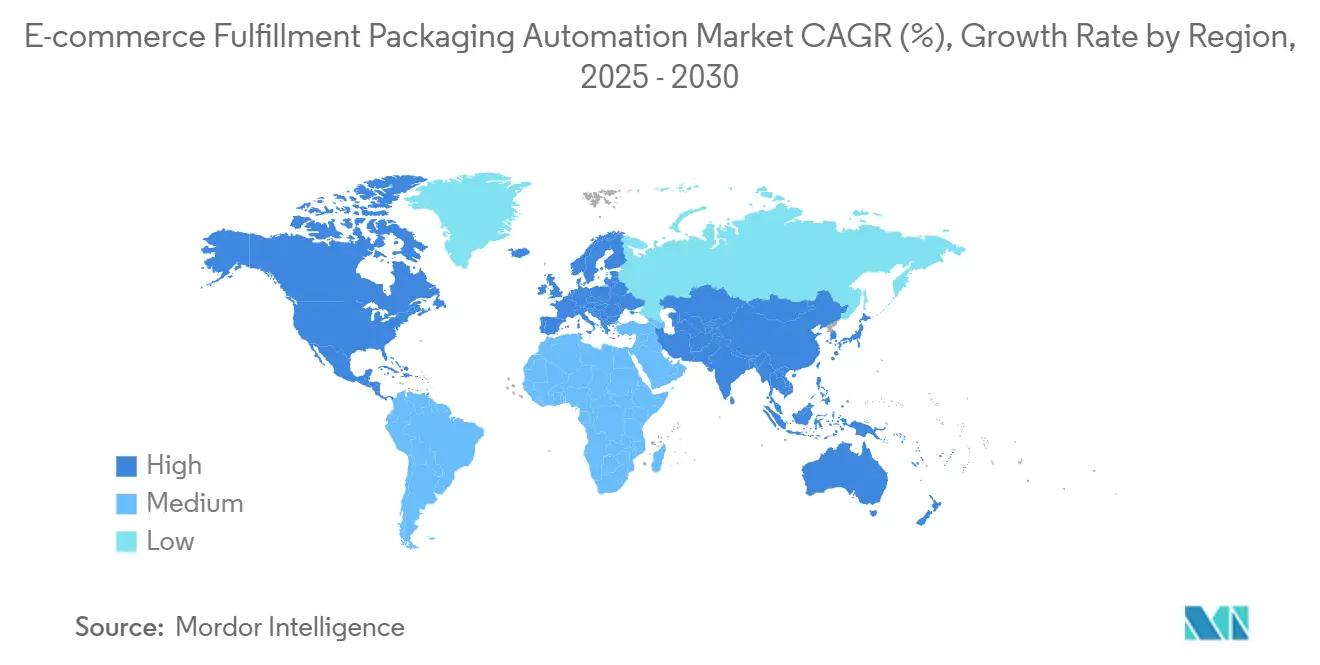
| Fastest Growing Market | Asia Pacific |
| Largest Market | North America |
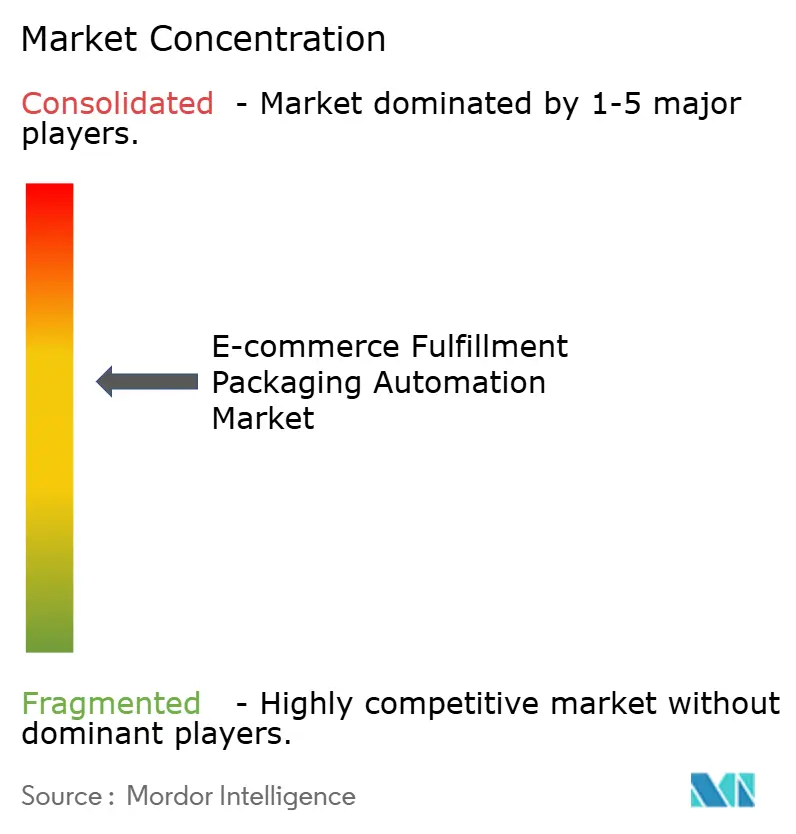
| Market Concentration | Medium |
Major Players *Disclaimer: Major Players sorted in no particular order Image © Mordor Intelligence. Reuse requires attribution under CC BY 4.0. | |
E-commerce Fulfillment Packaging Automation Market Analysis by Mordor Intelligence
The e-commerce fulfillment packaging automation market size is USD 752.41 million in 2025 and is projected to reach USD 1,619.54 million by 2030, growing at a 16.57% CAGR. This growth reflects persistent warehouse labor shortages, the relentless rise of direct-to-consumer (D2C) shipping, and fast-tightening sustainability mandates that are reshaping global fulfillment workflows. Operators are introducing automation to offset vacancy rates that exceeded 15% across major North American distribution hubs in 2024, while D2C parcel volumes and retail-media-driven unboxing expectations continue to fuel demand for right-sized, customized packaging lines. Automated right-sizing equipment tops the innovation agenda, boxes and mailers remain the volume cornerstone, and mergers between long-standing packaging suppliers and robotics specialists are gathering pace. The Asia-Pacific region is adding new capacity at breakneck speed, thanks to automation subsidies; yet, North America still commands the highest regional investments, as U.S. tax credits under the CHIPS and Science Act make capital projects more attractive.[1]U.S. Postal Service, “Annual Report to Congress 2024,” usps.com
Key Report Takeaways
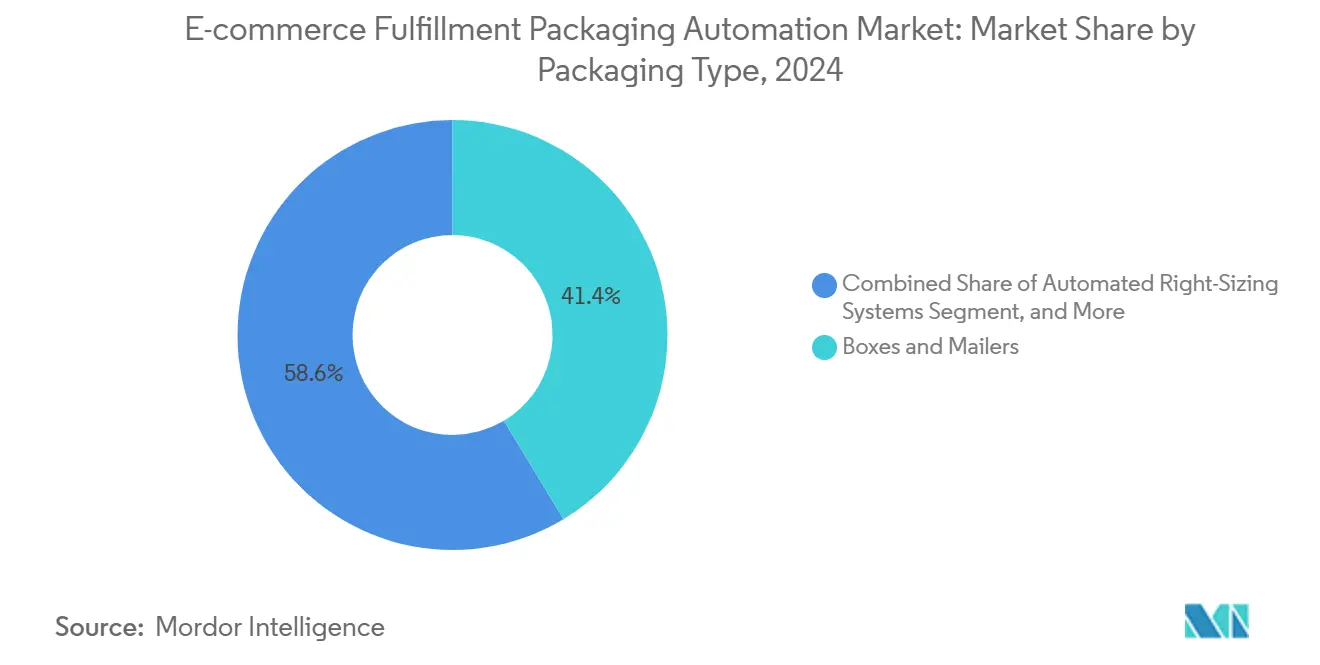
- By packaging type, the boxes and mailers segment captured 41.37% of the E-Commerce Fulfillment Packaging Automation Market share in 2024.
- By automation technology, the E-Commerce Fulfillment Packaging Automation Market size for robotic pick-and-place solutions is projected to grow at a 19.26% CAGR between 2025–2030.
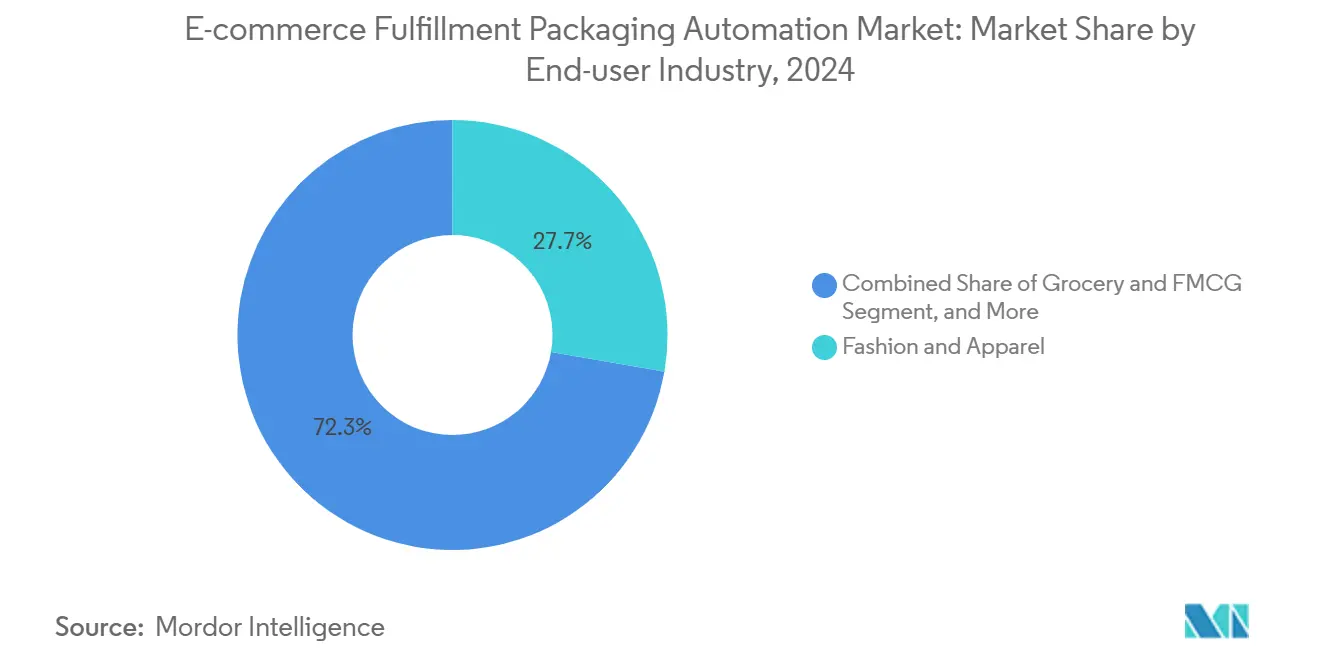
- By end-user industry, the fashion and apparel segment captured 27.71% of the E-Commerce Fulfillment Packaging Automation Market revenue share in 2024.
- By geography, the E-Commerce Fulfillment Packaging Automation Market size for North America captured 36.48% of revenue in 2024.
Global E-commerce Fulfillment Packaging Automation Market Trends and Insights
Drivers Impact Analysis*
| Driver | (~) % Impact on CAGR Forecast | Geographic Relevance | Impact Timeline |
|---|---|---|---|
| Rapid growth in D2C parcel volumes | +3.2% | Global, with concentration in North America and APAC | Medium term (2-4 years) |
| Heightened labor shortages in fulfillment centers | +4.1% | North America and EU primary, spreading to APAC urban centers | Short term (≤ 2 years) |
| Sustainability mandates driving right-sizing adoption | +2.8% | EU leadership, North America following, APAC selective adoption | Long term (≥ 4 years) |
| Retail media pressure for unboxing experience | +1.9% | Global, premium segments in developed markets | Medium term (2-4 years) |
| AI-driven predictive maintenance lowering downtime | +2.3% | Technology leaders in North America, EU, Japan, South Korea | Medium term (2-4 years) |
| Investment incentives for reshoring automation | +1.4% | USA and EU specific, limited spillover to allied nations | Long term (≥ 4 years) |
| Source: Mordor Intelligence | |||
Rapid Growth in D2C Parcel Volumes
The U.S. Postal Service handled 7.8 billion D2C parcels in 2024, a 23% jump that also saw average package dimensions shrink 12% as brands adopted right-sizing automation. Individual order profiles now change minute by minute, forcing fulfillment centers to deploy variable-dimension packagers that automatically cut, crease, and label corrugated blanks. Social-commerce checkouts on TikTok Shop and Instagram amplify this shift because spontaneous orders demand immediate shipment, leaving little room for manual packaging adjustments. Operators that have installed automated right-sizers report shipping-cost savings in the mid-teens percentage range and material waste reductions that meet retailer scorecards. Continuous growth in D2C subscriptions suggests that this pressure will persist through 2030.
Heightened Labor Shortages in Fulfillment Centers
Vacancies in U.S. logistics reached 430,000 open positions in 2024, a 34% jump compared with the pre-pandemic baseline. Packaging stations are among the most challenging roles to fill because repetitive tasks deter new hires, even as wage offers rise. Equivalent output that once required 2.3 workers per manual line can now be executed by one automated cell, yielding payback periods comfortably under 18 months in labor-constrained regions. Similar gaps exist across Germany and the Netherlands, where job openings remain elevated despite an 8% annual wage increase. The labor crisis solidifies automation as a structural necessity rather than a cyclical response.
Sustainability Mandates Driving Right-Sizing Adoption
The European Union’s Packaging and Packaging Waste Regulation obligates a 15% material-use reduction by 2030. California’s SB 343 and China’s recycling directives echo this trajectory, turning sustainability from a public-relations add-on into a legal requirement. Automated right-sizers routinely reduce corrugate usage by 20% per order, helping retailers stay below regulatory thresholds while projecting an eco-friendly brand image. Patagonia and other early adopters publicly showcase their automated fulfillment lines to reassure consumers that parcels leave minimal void space. Procurement teams are increasingly embedding material-reduction targets in service-level agreements, thereby cementing right-sizing as a competitive differentiator.
Retail-Media Pressure for Premium Unboxing
Retail media generated USD 129 billion in ad revenue in 2024, and engagement metrics revealed a direct relationship between premium unboxing and advertising ROI. Amazon subsequently updated its ad console to include “unboxing experience” scores, while video algorithms across social platforms elevate polished reveal moments. Automated packagers equipped with late-stage printing and insert capabilities allow mass personalization of monograms, QR-encoded loyalty offers, and co-branded graphics without slowing line speeds. Brands leveraging this data-driven packaging approach can negotiate higher ad rates because the parcel becomes a measurable media surface, reinforcing demand for automation.
Restraints Impact Analysis*
| Restraint | (~) % Impact on CAGR Forecast | Geographic Relevance | Impact Timeline |
|---|---|---|---|
| High upfront CAPEX for SME e-tailers | -2.7% | Global, acute in emerging markets and rural regions | Short term (≤ 2 years) |
| Integration complexity with legacy WMS/OMS stacks | -1.8% | Established markets with legacy infrastructure | Medium term (2-4 years) |
| Limited standardization across parcel carriers | -1.2% | Global, fragmented by regional carrier preferences | Long term (≥ 4 years) |
| Volatility in corrugated and polymer prices | -1.5% | Global, commodity-dependent regions most affected | Short term (≤ 2 years) |
| Source: Mordor Intelligence | |||
High Upfront CAPEX for SME E-tailers
Entry-level automated pack lines cost USD 150,000–300,000, dwarfing the USD 15,000–25,000 outlay for manual benches. The Federal Reserve’s 2024 Small Business Credit Survey found that 67% of logistics-oriented firms tagged equipment financing as a primary hurdle.[2]Federal Reserve Board, “Small Business Credit Survey 2024,” federalreserve.gov Although vendors now promote “automation-as-a-service” leases, cash-flow variability keeps many operators sidelined. As e-commerce market leaders continue to absorb a larger share, the cost gap threatens to widen the competitiveness between enterprise-scale shippers and SME sellers until rental models mature.
Integration Complexity with Legacy WMS / OMS Stacks
Fulfillment centers running decade-old systems often face six- to twelve-month integration projects. Middleware development can add USD 75,000–150,000 to budgets and tie up scarce IT talent. Providers such as Bastian Solutions cite a 40% revenue spike in 2024 from retrofits that reconnect older platforms to modern pack lines, underscoring the scale of the bottleneck. The delay favors greenfield e-commerce upstarts and cloud-native operators that can plug automation into open-API stacks within weeks.
*Our forecasts treat driver/restraint impacts as directional, not additive. The impact forecasts reflect baseline growth, mix effects, and variable interactions.
Segment Analysis
By Packaging Type: Right-Sizing Systems Drive Innovation
Automated right-sizing solutions are projected to capture 18.85% CAGR potential through 2030, while boxes and mailers retained a 41.37% e-commerce fulfillment packaging automation market share in 2024. Carriers’ universal dimensional-weight pricing, adopted in 2024, penalizes oversize parcels, so fulfillment operators are flocking to variable-dimension cutters that guarantee the lowest billable weight. The e-commerce fulfillment packaging automation market size for right-sizers is projected to add nearly USD 400 million in new revenue by 2030, and several retailers already cite 18% shipping-cost reductions.
Protective materials remain essential for consumer electronics, whereas bagging systems cater to fashion’s lightweight SKUs. Hybrid lines introduced by Sealed Air switch between rigid boxes and flexible poly mailers in real time, integrating AI that prescribes the optimal format per order. Down the road, cloud analytics will capture SKU geometry, destination, and carrier service level to feed machine-learning algorithms that fine-tune each cut, fold, and glue pass.


By Automation Technology: Robotics Reshape Operations
Conveyors and sorters accounted for 35.52% of the e-commerce fulfillment packaging automation market size in 2024, providing the backbone onto which new modules can be bolted. Robotic pick-and-place units, however, are tracking a 19.26% CAGR as vision systems now recognize irregular goods. IEEE research shows yearly improvements of 34% in defect detection accuracy, enabling robots to handle fragile stock with better consistency than human packers.[3]IEEE Robotics and Automation Society, “Industrial Robotics Performance Metrics,” ieee.org
Cloud-based control layers dispatch firmware updates that reduce cycle times by 15-20% without requiring hardware changes. Collaborative robots operate within mixed-mode work cells to maintain flexibility in peak seasons, and predictive-maintenance dashboards flag wear before downtime strikes. As per-unit prices fall, smaller fulfillment centers will integrate modular cobots rather than commit to fully automated greenfield builds.
By End-user Industry: Grocery Drives Fastest Growth
Fashion and apparel led 2024 revenue with 27.71% market share, but grocery and FMCG lines are advancing at a 19.83% CAGR to 2030. Chilled, ambient, and frozen items often travel in the same order, so pack lines now incorporate temperature-partitioned inserts and rapid liner-cutting tools. Walmart’s micro-fulfillment build-outs validate the shift, specifying temperature-controlled pack modules in every new hub.
Consumer electronics continue to prioritize protective packaging to mitigate return costs, while health-and-beauty brands leverage barcode-driven quality checks for compliance. Home-and-furniture SKUs, which are frequently oversized, benefit from on-demand corrugated wraps that eliminate air shipments from the cost stack. Emerging specialty niches, such as industrial chemicals and auto parts, seek automation to manage hazardous materials (Hazardous Materials, or HazMat) documentation within the packaging flow.
Geography Analysis
North America accounted for 36.48% of the e-commerce fulfillment packaging automation market share in 2024, underpinned by tax incentives and the most acute labor vacancies. U.S. operators fast-tracked installations once the CHIPS and Science Act allowed for accelerated depreciation, and Canadian co-funding prompted mid-market shippers to automate earlier than planned. Mexico’s near-shoring wave sees new DCs going live with fully integrated pack lines rather than retrofits to secure long-term labor savings.
The Asia-Pacific region is recording the highest CAGR at 18.36%, as China’s 14th Five-Year Plan covers up to 30% of qualified equipment costs, and India’s Production-Linked Incentive scheme supports logistics modernization. Provincial grants encourage the relocation of pack-line component manufacturing within the region, compressing lead times and pricing. Japan and South Korea, already advanced in terms of robotics density, lead in AI deployments, whereas Indonesia and Vietnam prioritize low-capex, modular machines.
Europe’s progress is steady because material-reduction rules and package-weight fines propel demand. Germany couples Industry 4.0 upgrades with right-sizing mandates, the U.K. combats post-Brexit labor friction, and France’s luxury sector demands presentation-grade packaging. Poland and the Czech Republic draw automation as near-shoring keeps shifting capacity eastward, cementing a long-run uptick despite wage differentials beginning to narrow.

Competitive Landscape
North America accounted for 36.48 of % e-commerce fulfillment packaging automation market share in 2024, underpinned by tax incentives and the most acute labor vacancies. U.S. operators fast-tracked installations once the CHIPS and Science Act allowed for accelerated depreciation, and Canadian co-funding prompted mid-market shippers to automate earlier than planned. Mexico’s near-shoring wave sees new DCs going live with fully integrated pack lines rather than retrofits to secure long-term labor savings.
The Asia-Pacific region is recording the highest CAGR at 18.36%, as China’s 14th Five-Year Plan covers up to 30% of qualified equipment costs, and India’s Production-Linked Incentive scheme supports logistics modernization. Provincial grants encourage the relocation of pack-line component manufacturing within the region, compressing lead times and pricing. Japan and South Korea, already advanced in terms of robotics density, lead in AI deployments, whereas Indonesia and Vietnam prioritize low-capex, modular machines.
Europe’s progress is steady because material-reduction rules and package-weight fines propel demand. Germany couples Industry 4.0 upgrades with right-sizing mandates, the U.K. combats post-Brexit labor friction, and France’s luxury sector demands presentation-grade packaging. Poland and the Czech Republic draw automation as near-shoring keeps shifting capacity eastward, cementing a long-run uptick despite wage differentials beginning to narrow.
E-commerce Fulfillment Packaging Automation Industry Leaders
Pregis LLC
Ranpak Holdings Corp.
Packsize International LLC
CMC SpA
Sealed Air Corporation
- *Disclaimer: Major Players sorted in no particular order

Recent Industry Developments
- October 2024: Sealed Air announced a USD 180 million R&D investment in AI-enabled right-sizing and sustainable materials integration.
- September 2024: Packsize closed the USD 95 million acquisition of CMC SpA to deepen European reach.
- August 2024: Amazon Web Services released a real-time supply-chain optimization platform for packaging automation.
- July 2024: Daifuku revealed a USD 220 million North American capacity expansion set for 2025 completion.


Global E-commerce Fulfillment Packaging Automation Market Report Scope
| Boxes and Mailers |
| Protective Packaging |
| Bagging and Poly Mailers |
| Automated Right-Sizing Systems |
| Other Packaging Types |
| Conveyor and Sortation Systems |
| Robotic Pick and Place |
| Automated Packaging Machines |
| Vision and Inspection Systems |
| Software and Control Platforms |
| Fashion and Apparel |
| Consumer Electronics |
| Health and Beauty |
| Home and Furniture |
| Grocery and FMCG |
| Other End-User Industries |
| North America | United States | |
| Canada | ||
| Mexico | ||
| South America | Brazil | |
| Argentina | ||
| Chile | ||
| Rest of South America | ||
| Europe | United Kingdom | |
| Germany | ||
| France | ||
| Italy | ||
| Spain | ||
| Russia | ||
| Rest of Europe | ||
| Asia-Pacific | China | |
| India | ||
| Japan | ||
| South Korea | ||
| Australia | ||
| Rest of Asia-Pacific | ||
| Middle East and Africa | Middle East | Saudi Arabia |
| United Arab Emirates | ||
| Turkey | ||
| Rest of Middle East | ||
| Africa | South Africa | |
| Nigeria | ||
| Rest of Africa | ||
| By Packaging Type | Boxes and Mailers | ||
| Protective Packaging | |||
| Bagging and Poly Mailers | |||
| Automated Right-Sizing Systems | |||
| Other Packaging Types | |||
| By Automation Technology | Conveyor and Sortation Systems | ||
| Robotic Pick and Place | |||
| Automated Packaging Machines | |||
| Vision and Inspection Systems | |||
| Software and Control Platforms | |||
| By End-user Industry | Fashion and Apparel | ||
| Consumer Electronics | |||
| Health and Beauty | |||
| Home and Furniture | |||
| Grocery and FMCG | |||
| Other End-User Industries | |||
| By Geography | North America | United States | |
| Canada | |||
| Mexico | |||
| South America | Brazil | ||
| Argentina | |||
| Chile | |||
| Rest of South America | |||
| Europe | United Kingdom | ||
| Germany | |||
| France | |||
| Italy | |||
| Spain | |||
| Russia | |||
| Rest of Europe | |||
| Asia-Pacific | China | ||
| India | |||
| Japan | |||
| South Korea | |||
| Australia | |||
| Rest of Asia-Pacific | |||
| Middle East and Africa | Middle East | Saudi Arabia | |
| United Arab Emirates | |||
| Turkey | |||
| Rest of Middle East | |||
| Africa | South Africa | ||
| Nigeria | |||
| Rest of Africa | |||


Key Questions Answered in the Report
How large is the global e-commerce fulfillment packaging automation market in 2025?
It stands at USD 752.41 million and is forecast to expand at a 16.57% CAGR to reach USD 1,619.54 million by 2030.
Which packaging technology segment is growing fastest?
Automated right-sizing systems post the highest growth trajectory at an 18.85% CAGR through 2030.
What region is expected to record the highest growth rate?
Asia-Pacific, driven by China’s and India’s automation subsidies, is projected to log an 18.36% CAGR over the forecast period.
Why are labor shortages influencing pack-line investments?
Vacancies of 430,000 logistics jobs in the U.S. during 2024 and similar gaps in Europe shorten automation payback periods to under 18 months.
What is the main restraint for small online sellers?
High upfront capital outlays USD 150,000-300,000 for entry-level systems limit adoption despite growing as-a-service rental options.
How are sustainability regulations affecting packaging choices?
EU and California rules mandate material-use cuts, prompting retailers to deploy right-sizers that reduce corrugate consumption by around 20%.
Page last updated on:


