
Contract Packaging And Fulfillment Service Market Size and Share
Market Overview
| Study Period | 2020 - 2031 |
|---|---|
| Market Size (2026) | USD 121.87 Billion |
| Market Size (2031) | USD 207.67 Billion |
| Growth Rate (2026 - 2031) | 11.25 % |
| Fastest Growing Market | Asia Pacific |
| Largest Market | North America |
| Market Concentration | Medium |
Major Players *Disclaimer: Major Players sorted in no particular order Image © Mordor Intelligence. Reuse requires attribution under CC BY 4.0. | |
Contract Packaging And Fulfillment Service Market Analysis by Mordor Intelligence
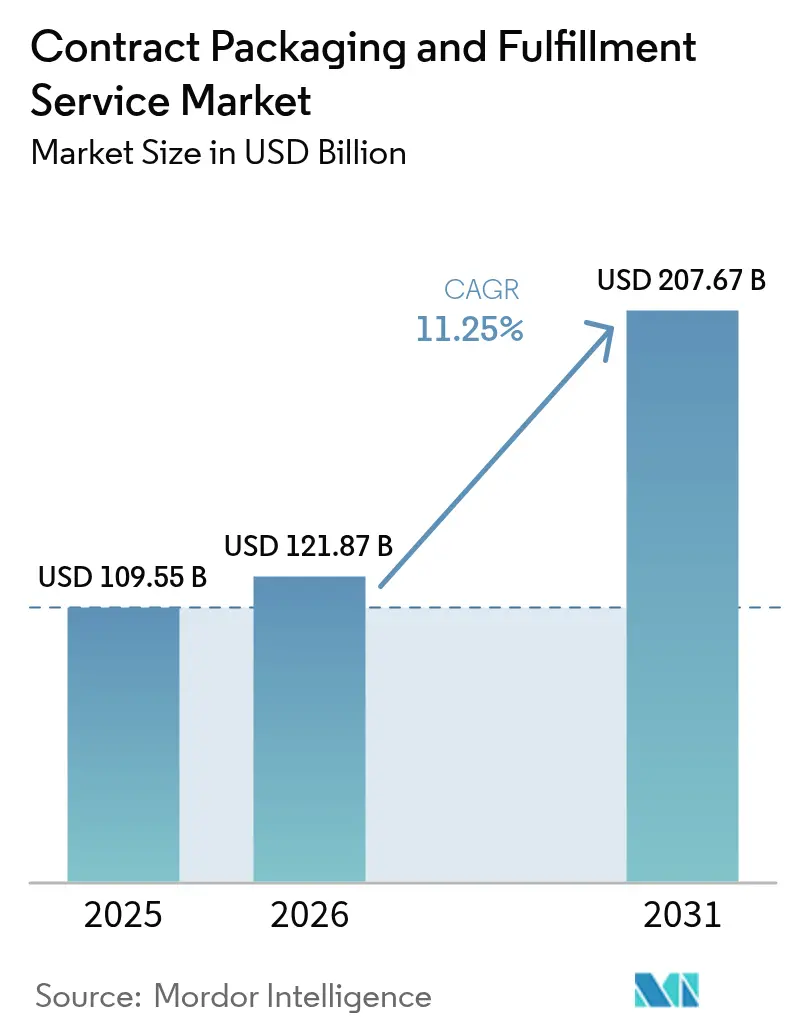
The contract packaging and fulfillment services market size was valued at USD 109.55 billion in 2025 and estimated to grow from USD 121.87 billion in 2026 to reach USD 207.67 billion by 2031, at a CAGR of 11.25% during the forecast period (2026-2031). This fast-rising trajectory reflects manufacturers’ steady migration toward outsourcing as they pursue lower operating costs, leverage advanced automation, and comply with widening sustainability mandates. E-commerce parcel volumes, which continue to expand by double digits, add layers of fulfillment complexity that only highly specialized partners can navigate efficiently. At the same time, policymakers in North America and the European Union tighten circular-economy rules, so brands increasingly depend on third-party experts to monitor waste, materials traceability, and extended-producer-responsibility filings. Finally, rapid progress in robotics, computer vision, and cloud analytics reduces per-unit packaging costs, allowing contract packagers to scale profitably even as wages rise in developed markets.
Key Report Takeaways
- By packaging material, plastic commanded 54.63% of the contract packaging and fulfillment services market share in 2025, biodegradable and compostable formats are projected to expand at a 13.22% CAGR through 2031.
- By service type, contract packing led with 44.78% revenue share in 2025, service type, packaging design and prototyping is forecast to grow at a 12.6% CAGR to 2031.
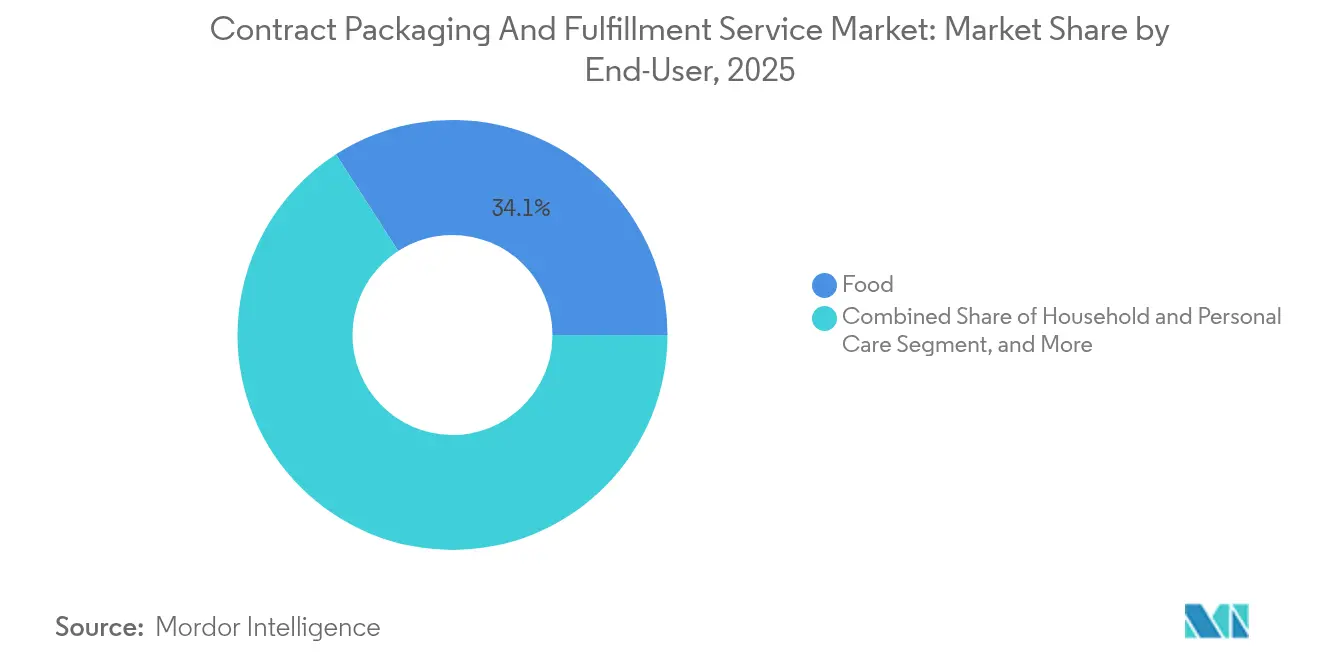
- By end-user, food applications accounted for 34.12% share of the contract packaging and fulfillment services market size in 2025, household and personal care is advancing at a 12.2% CAGR through 2031.
- By fulfillment channel, e-commerce B2C held 38.05% of revenue in 2025, e-commerce B2C is set to rise at a 11.98% CAGR through 2031.
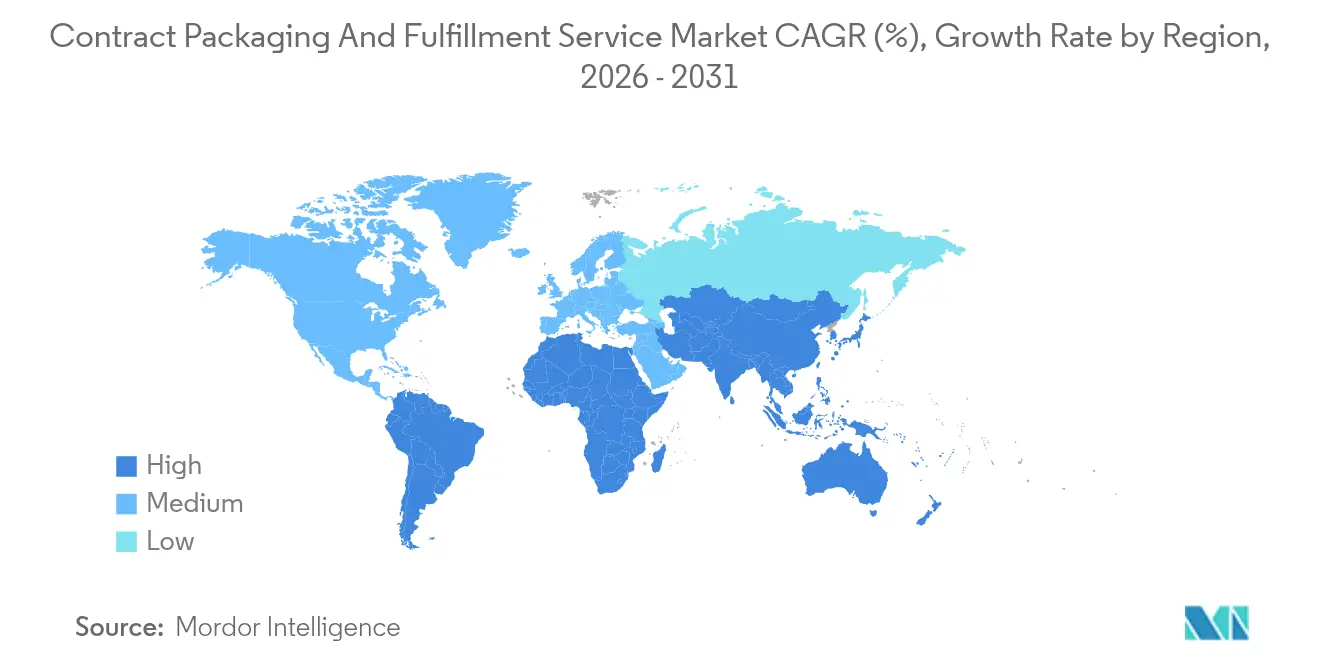
- By geography, North America captured 39.05% of 2025 revenue, Asia-Pacific is poised for the fastest 13.28% CAGR through 2031.
Note: Market size and forecast figures in this report are generated using Mordor Intelligence’s proprietary estimation framework, updated with the latest available data and insights as of 2026.
Global Contract Packaging And Fulfillment Service Market Trends and Insights
Drivers Impact Analysis*
| Driver | (~) % Impact on CAGR Forecast | Geographic Relevance | Impact Timeline |
|---|---|---|---|
| Outsourcing non-core operations for cost optimisation | +2.8% | Global, with concentration in North America and Europe | Medium term (2-4 years) |
| Growing F and B demand for ready-to-eat formats | +2.1% | Global, strongest in APAC urban centers | Short term (≤ 2 years) |
| 3PL warehousing entrants fostering packaging innovation | +1.9% | North America and EU core, expansion to APAC | Medium term (2-4 years) |
| Subscription-box D2C boom requiring agile fulfilment | +1.7% | North America and EU, emerging in APAC metros | Short term (≤ 2 years) |
| ESG-linked outsourcing to lower Scope-3 emissions | +1.5% | EU and North America regulatory focus, spillover globally | Long term (≥ 4 years) |
| AI-driven slotting and personalised packs | +1.3% | Technology hubs in US, EU, China, Japan | Medium term (2-4 years) |
| Source: Mordor Intelligence | |||
Outsourcing Non-Core Operations for Cost Optimisation
Manufacturers allocate scarce capital toward product innovation while redirecting packaging lines to contractors that spread fixed costs across multiple clients. A typical brand now realizes 15-25% cost reductions by moving from legacy in-house lines to automated multi-client facilities that operate around the clock. Pharmaceutical companies illustrate the shift, with providers such as Catalent adding capacity for blister serialization, cold-chain assembly, and GMP-certified labeling. Beyond savings, decision makers value liability transfer: specialized partners shoulder recall risks, maintain ISO documentation, and calibrate inspection equipment under validated protocols. Inflation-linked wage spikes in 2024 merely accelerated the calculation, making the outsourcing premium look modest versus the staffing, utilities, and compliance overhead internal plants must carry. Sophisticated cost-modeling software, plugged into enterprise resource planning platforms, now compares total landed cost scenarios in real time and surfaces packaging outsourcing as the financially superior option across most mid-sized SKUs.
Growing F and B Demand for Ready-to-Eat Formats
Urban consumers gravitate toward convenience meals, meal kits, and single-serve snacks that call for portion control, protective atmospheres, and shelf-life assurance. Ready-to-eat categories expanded 18% in 2024, and every incremental unit required hermetic sealing, modified-atmosphere flushing, or retort pouches that few brand owners can support internally. Contract packagers stepped in with clean-room extensions, high-speed form-fill-seal lines, and real-time microbial monitoring to satisfy food-safety regulators. Asia-Pacific hubs from Bangkok to Ho Chi Minh City show the starkest spike, pulled by dual-income households and tight city kitchens that favor grab-and-go offerings. Meanwhile, Western retailers press for clear labeling on allergens and nutrition, prompting specialist printers to add digital presses that deliver serialized, variable data directly on pack. As functional beverages and nutraceutical gummies rise, barrier films and dose-specific blistering drive another layer of outsourcing demand.
3PL Warehousing Entrants Fostering Packaging Innovation
Logistics giants such as GXO Logistics invested USD 200 million during 2024 to bolt robotic pack stations onto existing distribution campuses. The new model collapses pallet breakdown, right-size boxing, and courier labeling into a single automated touchpoint. Legacy contract packagers, accustomed to discrete projects, now compete with providers that already hold inventory and transportation legs, allowing seamless postponement until an online shopper confirms color, flavor, or bundle preference. Integration between warehouse management and packaging execution systems captures SKU velocity and assembles package dimensions that slash dimensional-weight fees by 8-12%. This tight data loop reduces void fill consumption, contributing to customers’ sustainability key performance indicators. Europe’s cross-docking leaders likewise retrofit pack-to-light modules, challenging long-established co-packers to respond with value-added engineering and shorter change-over times.
Subscription-Box D2C Boom Requiring Agile Fulfilment
Online beauty, pet-care, and gourmet-snack subscriptions mushroomed 435% over the past decade, creating demand spikes tied to influencer campaigns and seasonal curation. Contract packagers developed modular cells equipped with pick-to-voice directives and multi-head labelers that inject each recipient’s name, note, or QR code. Presentation matters as much as protection: premium substrates, soft-touch varnishes, and tissue wrapping elevate the unboxing moment, driving repeat signups. Agility proves critical; a cosmetics client can swap shades weekly without re-tooling costs because magnetically fixed dies and digital press plates pivot within hours. Providers also manage insert collation, sample sachet gluing, and return instruction leaflets, consolidating functions once spread across merchandising agencies and in-house marketing teams. The result is a frictionless brand experience that would strain a manufacturer’s conventional line designed for homogeneous volume.
Restraints Impact Analysis*
| Restraint | (~) % Impact on CAGR Forecast | Geographic Relevance | Impact Timeline |
|---|---|---|---|
| Stringent extended-producer-responsibility (EPR) rules | -1.8% | EU primary, expanding to North America and APAC | Medium term (2-4 years) |
| Competition from in-house packaging lines | -1.2% | Global, strongest in developed manufacturing regions | Short term (≤ 2 years) |
| Skilled labour shortages in specialised fulfilment centres | -0.9% | North America and EU core, emerging in APAC | Short term (≤ 2 years) |
| Recycled-material cost volatility compressing margins | -0.7% | Global, with regional price variations | Short term (≤ 2 years) |
| Source: Mordor Intelligence | |||
Stringent Extended-Producer-Responsibility Rules
Revised European legislation obliges brand owners to finance collection, sorting, and material recovery schemes, pushing compliance costs up by 3-5% of packaging spend. Contract packagers must now capture resin identification codes, post-consumer content ratios, and geographic destination data at pallet level, or risk fines. Tracking technology RFID tags and blockchain registers requires capital and skilled compliance staff that small providers struggle to fund, tilting share toward global players. Similar statutes in four U.S. states and pilot programs in Japan widen the administrative footprint. Cross-border contracts therefore bundle audit clauses, life-cycle-assessment deliverables, and recycling verification, adding negotiation overhead that slows project onboarding. For cost-sensitive clients, high EPR fees can tempt reconsideration of packaging-intensive design concepts, suppressing overall outsourced volume until new materials emerge that lower levy brackets.
Competition from In-House Packaging Lines
Prices for servo-driven cartoners, collaborative case packers, and vision-guided palletizers fell 20-30% in 2024 as component suppliers scaled production. Large food and household-chemicals plants analyze total cost of ownership and find payback periods under three years for turnkey high-volume lines. With intellectual-property leakage and supply security on executive dashboards, some Fortune 500 companies allocate capex to reclaim control over final pack appearance and product launch timing. Although internal lines excel on uniform SKUs, they lack the flexibility of multi-client co-pack hubs when promotional variants, seasonal bundles, or micro-runs hit the calendar. Contract packagers defend share by emphasizing clean-room certification, multi-material proficiency, and quick format swaps that an amortized fixed line cannot justify. The battle thus hinges on service breadth, not hourly throughput alone.
*Our forecasts treat driver/restraint impacts as directional, not additive. The impact forecasts reflect baseline growth, mix effects, and variable interactions.
Segment Analysis
By Packaging Material: Plastic Dominance Faces Sustainability Pressure
Plastic resins retained a 54.63% contract packaging and fulfillment services market share in 2025, buoyed by low cost, machinability, and barrier versatility. The segment’s commanding position nonetheless invites regulatory scrutiny under single-use-plastics bans and recycled-content quotas. Contract packagers hedge exposure by qualifying bio-based polyethylene and compostable polylactic acid films that align with forthcoming EPR fee tiers. Glass and metal containers resurge in premium beverages and cosmeceuticals that market heritage and recyclability, although their heavier weight complicates emissions targets. Paperboard, boosted by e-commerce cartons and molded-fiber mailers, sits at the nexus of renewable sourcing and curbside recovery. Rising resin prices in 2024 nudged brand owners to right-size packaging, intensifying demand for simulation software that predicts puncture resistance at lower gram weights.
Biodegradable and compostable categories forecast a 13.22% CAGR to 2031, yet supply chain constraints persist. Limited fermenter capacity, feedstock price swings, and inconsistent end-of-life infrastructure can erode theoretical sustainability gains. Contract packagers therefore add in-house laboratories to test seal integrity, migration, and shelf-life across myriad biopolymer grades, ensuring they do not jeopardize food safety. Successful trials position providers to command premium rates as clients chase carbon-neutral claims. Meanwhile, standard plastic grades remain indispensable for pharmaceuticals requiring moisture-barrier blister packs that bioplastics cannot yet match. The evolutionary path thus blends incremental downgauging, hybrid structures, and circular recycling streams rather than an abrupt material substitution.




By Service Type: Value-Added Services Drive Growth
Contract packing generated the largest 44.78% revenue slice in 2025, but price sensitivity and automation parity compress margins. Customers increasingly reward design thinking, prompting suppliers to cultivate creative studios fluent in consumer psychology, shelf impact, and reuse cues. Packaging design and prototyping is projected to clock a 12.6% CAGR, illustrating the pivot from commodity labor toward intellectual property and rapid iteration. Digital twins, rendered in mixed reality, allow marketers to preview branding elements under store lighting before a single die-cut hits the press, accelerating decision cycles.
Downstream, lab-based validation gains traction. Vibration, drop, and compression rigs mimic multichannel shipping pathways, while environmental chambers expose packs to tropical humidity or arctic freeze. Package-testing revenue thus swells as e-commerce exposure magnifies liability. Fulfillment-linked warehousing remains essential, yet borderlines blur as 3PLs internalize co-pack modules and co-packers lease adjacent storage bays. The winning formula bundles concept sketches, material sourcing, inline inspection, and multicarrier dispatch under one master service agreement. Such breadth erects switching barriers, encouraging clients to sign multi-year statements of work that smooth provider cash flow.
By End-User: Food Sector Leadership with Personal Care Growth
Food applications accounted for 34.12% of the contract packaging and fulfillment services market size in 2025, thanks to stringent hygiene codes and capital-intensive machinery that tilt the business case toward outsourcing. HACCP audits, allergen segregation, and metal detection all raise the competency bar. Ready meals, high-protein snacks, and functional beverages each require distinct film chemistries and atmospheric controls, pushing single-line manufacturers to hand off complexity to multi-client specialists. Cold-chain assurance, from cryogenic tunnel freezing to validated thermal shippers, forms a moat around incumbent service providers.
Household and personal care lines, spanning skin serums to eco-laundry tabs, are projected to post a 12.2% CAGR through 2031. Subscription models and influencer-driven product drops demand color-matched bottles, foil stamping, and secondary gift wraps that internal plants cannot switch over daily. Rising regulatory focus on microplastics in rinse-off products adds further compliance intricacies. Contract packagers answer with controlled environments, in-line vision systems for label alignment, and track-and-trace lot coding that supports voluntary and mandated recalls. Pharmaceutical customers too deepen outsourcing, though protected by serialization mandates and batch potency testing that only a handful of validated partners can perform cost-effectively.
By Fulfillment Channel: E-Commerce Drives Transformation
E-commerce B2C flows represented 38.05% of 2025 volume and continue to surge at a 11.98% CAGR, transforming package formats toward shipper-friendly, frustration-free designs. Overbox elimination strategies pair right-size algorithms with rugged mono-material flexibles to withstand 50-inch free-fall tests. Each parcel must protect contents, delight the recipient visually, and comply with retailer curbside recyclability mandates. Contract packagers responded by commissioning auto-baggers, tray formers, and paper-based cushioning dispensers tuned to volumetric shipping tariffs.
Traditional retail refill orders still dominate shelf-ready cases and pallet layers but register slower single-digit growth. Meanwhile, business-to-business distribution uses industrial totes, drums, and returnable transit packaging that optimize cubic efficiency. Omnichannel brands now expect partners to toggle between these configurations at day-to-day cadence, challenging monoline plants designed for predictable runs. Packaging line flexibility enabled by quick-swap end-effectors and recipe-driven control software thus becomes a top procurement criterion.
Geography Analysis
North America retained a 39.05% share in 2025 as the region couples mature online retail infrastructure with strict environmental regulations that privilege professional packaging specialists over in-house crews. Labor rates above USD 25 per hour spur automation adoption, and generous depreciation schedules under local tax codes encourage continuous capital refresh. U.S. demand centers on pharmaceuticals, premium snacks, and high-velocity consumer electronics requiring fast changeovers and zero-defect standards. Canada supplements volume with natural-resource processors shipping globally, necessitating reinforced export crates and humidity-resilient line boards.
Asia-Pacific records the fastest 13.28% CAGR to 2031, buoyed by China’s manufacturing heft, India’s consumer base, and Southeast Asia’s digital-platform surge. Local authorities incentivize plant upgrades to meet emerging food-safety and waste-reduction directives, fostering a transition from informal to certified co-pack hubs. Robotics adoption lags Western benchmarks but accelerates due to government grants and multinational client audits demanding traceability. Japan and South Korea push the frontier with automated kitting for gaming consoles and luxury beauty sets shipped globally within hours of release.
Europe positions itself as the sustainability test bed, pioneering cradle-to-cradle certifications and carbon-labeling schemes under the Green Deal umbrella. German automotive suppliers rely on durable, reusable dunnage, while French cosmetics houses specify compostable cellulose film windows. Scandinavia pilots fiber-based bottle prototypes, pushing service providers to build multi-material expertise. Eastern Europe offers cost-effective labor pools and proximity to Central European consumption, attracting greenfield capacity from Western multinationals keen to sidestep Brexit border friction.

Regulatory Landscape
Across major end-use categories, compliance requirements increasingly shape how brands structure outsourcing agreements with contract packagers and fulfillment providers. In the European Union, Regulation (EU) 2025/40 on packaging and packaging waste (PPWR) entered into force on 11 February 2025 and applies from 12 August 2026, introducing harmonized requirements on packaging design, composition, recyclability and reuse, alongside frameworks that link extended producer responsibility (EPR) fees to recyclability performance. As a result, co-packers operating in, or shipping into, the EU need stronger packaging-spec documentation, material traceability, and customer reporting support as part of service delivery.
For food and beverage packaging, the United States Food and Drug Administration (FDA) regulates food contact substances through pathways such as Food Contact Notifications (FCNs), and FCNs are effective only for the identified manufacturer or supplier. This shifts emphasis toward supplier-specific documentation control, change management, and material qualification within outsourced packaging programs. In 2026, FDA updates to public databases relevant to food-contact materials, including its inventory of effective FCNs (updated through at least 31 May 2026) and its public information on post-consumer recycled (PCR) plastics for food-contact articles (updated in July 2026), reinforce the need for contract packagers to keep current regulatory reference data when selecting compliant films, resins, and recycled-content inputs.
Value Chain Analysis
The value chain starts with packaging raw materials (paperboard, plastics, glass, metals, and emerging compostable substrates) and consumables (labels, inks, adhesives). Packaging machinery and automation providers then supply systems for form-fill-seal, cartoning, case packing, palletizing, inspection, and serialization. Contract packagers convert these inputs into primary and secondary packs, deliver value-added services such as design and prototyping and package testing, and connect with warehousing and fulfillment operations that execute kitting, order assembly, parcel labeling, and multicarrier dispatch for e-commerce B2C, retail replenishment, and B2B distribution.
Downstream integration with 3PLs and network consolidation is becoming more pronounced, compressing handoffs between packaging and distribution. BelPak, for example, reported integrating operations of Belvika, Coregistics, and PPG into a unified network of 25+ facilities across the United States and Canada (June 2026), reflecting buyer preference for fewer nodes and a single accountable partner across packing and fulfillment. Persistent bottlenecks center on labor availability for specialized fulfillment tasks and the pace of automation deployment, with industry surveys highlighting equipment investment priorities such as flexibility and faster changeovers (Packaging Digest, September 2025) and broad intent to add equipment to address labor and throughput constraints (PMMI, October 2025).
Competitive Landscape
The contract packaging and fulfillment services market exhibits moderate concentration: the five largest players hold roughly 45% cumulative share, while regional specialists and 3PL entrants fill niche gaps. Automation investments define winners. In 2024 GXO Logistics installed collaborative robots that trimmed labor costs by 35% across 15 North American sites. Sonoco paired with AMP Robotics to raise recycled-material capture by 25% and burnish circular-economy credentials. Catalent redirected USD 11.5 billion from a biologics divestment toward high-speed vial filling and blister thermoforming, strengthening its pharmaceutical moat.
Acquisitions remain a favorite expansion vector. CCL Industries’ USD 3.9 billion purchase of Eviosys extended metal-can and barrier-coating reach, while Deutsche Post DHL’s Singapore hub introduced solar arrays and water-recycling loops that cut carbon intensity 40%. Product innovation flows through patent filings on smart labels, self-heating meal trays, and AI-driven seal inspection over 1,200 applications entered the USPTO in 2024 alone.[3] United States Patent and Trademark Office, “Packaging Automation Patents Database,” uspto.gov To retain talent, leading firms roll out certified upskilling curricula with robotics OEMs and offer wage premiums for PLC technicians. Market entrants face high capex, regulatory compliance hurdles, and the need to integrate with customers’ enterprise resource planning stacks, all of which raise switching barriers and support mid-sized incumbents’ defensibility.
Contract Packaging And Fulfillment Service Industry Leaders
Aaron Thomas Company, Inc.
ActionPak Inc.
Assemblies Unlimited, Inc.
PAC Worldwide Corp.
AmeriPac LLC
- *Disclaimer: Major Players sorted in no particular order


Market Opportunities and Future Outlook
Regulation-driven traceability and compliance services create whitespace for providers that combine validated processes with data interoperability across customers and trading partners. In pharmaceuticals, the Drug Supply Chain Security Act (DSCSA) raises the operational value of contract packagers and fulfillment providers that can support standardized product identification (FDA-selected sNDC approach) and electronic exchange of product tracing information that has been in effect since November 27, 2023. Implementation is commonly aligned with standards-based event data such as GS1 EPCIS, which supports demand for turnkey offerings that blend packaging execution (including labeling and serialization) with systems integration, data management, and audit-ready documentation.
Sustainability-linked packaging redesign and reporting also remain an opportunity area where service breadth differentiates suppliers. The EU PPWR (Regulation (EU) 2025/40) ties harmonized packaging requirements to EPR economics through recyclability performance concepts, increasing the need for co-pack partners that can operationalize design-for-recycling specifications, materials traceability, and customer-ready compliance outputs across multiple SKUs and destinations. Capacity buildouts aimed at regulated and high-complexity packaging provide near-term avenues for specialized outsourcing, including PCI Pharma Services' announcement of major expansion of US sterile fill-finish and drug-device combination capabilities (April 2026), and Tjoapack's expansion of its US footprint with a new 170,000 sq.-ft facility in Clinton, Tennessee, covering advanced packaging, labeling, serialization, and expanded cold chain and ambient storage (March 2026). Geographic footprint additions, such as Quad's announced Salt Lake City, Utah packaging manufacturing facility slated for operational start in Q4 2026 (July 2026), further highlight how distributed nodes can support national fulfillment programs through reduced lead times.
Recent Industry Developments
- July 2026: Quad announced a new packaging manufacturing facility in Salt Lake City, Utah, planned to be operational in Q4 2026. The added node expands Quad’s end-to-end packaging services footprint and supports regional lead-time reduction by placing manufacturing capacity closer to western US demand.
- April 2026: PCI Pharma Services announced major expansions of US sterile fill-finish and drug-device combination capabilities, supported by investments exceeding USD 1 billion. The buildouts strengthen integrated packaging and device-assembly capacity at key campuses, reinforcing outsourcing pathways for regulated, high-complexity pharmaceutical packaging programs that also require cold chain and validated operations.
- September 2024: Catalent completed the divestiture of its biologics manufacturing business to Novo Holdings for USD 11.5 billion. The proceeds were positioned to fund packaging automation upgrades, supporting higher-throughput, compliance-oriented packaging operations across its contract services portfolio.


Research Methodology Framework and Report Scope
Market Definition and Coverage
This market covers third-party service revenue earned from outsourced contract packaging and order fulfillment work, starting from packaging design and pack operations and extending to warehousing, picking, and shipping for the client.
Scope exclusions: In-house packaging lines and in-house warehouse operations run by brand owners are excluded from the service market value.
Segmentation Overview
- By Packaging Material
- Paper and Paperboard
- Plastic
- Glass
- Metal
- Biodegradable / Compostable Materials
- By Service Type
- Packaging Design and Prototyping
- Contract Packing
- Package Testing
- Warehousing and Fulfilment
- Other Service Types
- By End-User
- Food
- Beverage
- Pharmaceutical
- Household and Personal Care
- Other End-Users
- By Fulfilment Channel
- E-commerce B2C
- B2B Distribution
- Retail Replenishment
- By Geography
- North America
- United States
- Canada
- Mexico
- South America
- Brazil
- Argentina
- Chile
- Rest of South America
- Europe
- Germany
- United Kingdom
- France
- Italy
- Spain
- Rest of Europe
- Asia-Pacific
- China
- Japan
- India
- South Korea
- Australia
- Rest of Asia-Pacific
- Middle East and Africa
- Middle East
- Saudi Arabia
- United Arab Emirates
- Turkey
- Rest of Middle East
- Africa
- South Africa
- Nigeria
- Kenya
- Rest of Africa
- Middle East
- North America
Data Sources, Market Sizing, and Validation
Desk Research
Desk research is used to set the market boundary and build the first set of volume and price assumptions that can be defended. We rely on public sources such as US Census Bureau manufacturing and trade tables, Bureau of Labor Statistics wage series, US International Trade Commission trade data, and Eurostat structural business statistics to understand where packaging and logistics activity is trending.
We also review information from trade bodies and official portals such as the Institute for Supply Management and industry association pages that discuss packaging, warehousing, and order fulfillment practices, then cross-check the direction with reputable press coverage. Company annual reports and investor presentations are used to confirm service mix language and the presence of pass-through pricing. For additional context, we selectively referenced paid subscriptions that cover company financials and news, patent databases, and shipment-level import-export records. The sources named above are illustrative only, and many other public documents and datasets were also used for collection, validation, and clarification.
Primary Interviews and Surveys
Primary work was used to pressure-test service scope and keep the model grounded in how contracts are priced and renewed. We spoke with packaging service providers, fulfillment operators, ecosystem contacts, and buyer-side logistics and operations leaders across APAC, EMEA, and the Americas, which helped close gaps on utilization, typical value-added charges, and regional ASP differences.
Distribution of primary research fieldwork respondents
| Company type | Respondent position | Region |
|---|---|---|
| Top tier: 37% | CXOs: 16% | APAC: 40% |
| Mid tier: 44% | Functional/Unit leaders: 28% | EMEA: 34% |
| Smaller Players: 19% | Managers: 56% | Americas: 26% |
Market-Sizing & Forecasting
Sizing starts with a top-down build where outsourcing demand is reconstructed from observable activity across end-use manufacturing and commerce flows, then filtered into the addressable service pool for packaging and fulfillment. The totals are corroborated with selective bottom-up approximations, such as sampled provider revenue checks by region and a simple volume times ASP sanity check for common work orders, and then adjusted when mismatches persist.
Inputs used in the model include e-commerce parcel growth as a demand proxy for pick-pack-ship intensity, manufacturing output trends in key end markets that commonly outsource packaging, labor cost inflation that shifts make-versus-buy decisions, warehouse space and utilization signals, and changes in packaging formats that affect value-added work (for example, kitting, labeling, and testing). Where direct inputs are thin, ranges are set using interview-derived guardrails and then tightened using regional cross-checks so outliers do not drive the total.
Forecasts are produced using scenario analysis supported by short lists of drivers that are easy to track each year, including macro consumption, fulfillment throughput, and ASP movement from labor and material pass-through clauses. Scenario weights are reviewed with experts to ensure the final projection is not overly optimistic or overly conservative, and the final numbers are presented as the base case.
Data Validation & Update Cycle
Outputs are validated through triangulation across independent signals, followed by variance checks against expected ranges by region and service intensity. When a region's modeled growth or ASP movement looks unusual, analysts re-check source assumptions, re-run sensitivity cases, and re-contact selected respondents to confirm whether a real market shift has occurred.
Before sign-off, the model and narrative go through multiple review steps so calculation logic, scope alignment, and math consistency are verified. Reports are refreshed annually, and interim updates are made when major events materially change demand, pricing, or operating constraints. Right before delivery, a fresh review pass is completed so clients receive the most current view available.
Mordor Intelligence's Contract Packaging and Fulfillment Service Market Size Versus Other Published Estimates
Published market sizes for contract packaging and fulfillment services can look far apart because firms do not always align currency conversion, price updates, and scope checks in the same way. Differences also come from how provider revenue is treated when packaging work and fulfillment work are bundled into one contract.
The spread is often driven by refresh cadence and ASP logic, since labor pass-through, fuel surcharges, and peak-season pricing can move service revenue even when volumes are steady. A tighter annual reset of exchange rates, refreshed regional ASP bands informed by field checks, and step-by-step anomaly reviews are what keep Mordor Intelligence aligned to a repeatable 2026 demand and pricing base.
Benchmark comparison
| Source | Market Size | Gaps in Research Methodology |
|---|---|---|
| Mordor Intelligence | USD 121.87 B (2026) | |
| Trade Journal A | USD 84.80 B (2024) | Anchors the value to an earlier year and a contract packaging-only framing in the cited release, which can leave out bundled fulfillment revenue and miss later-period ASP inflation. |
| Industry Report B | USD 72.40 B (2025) | Uses a narrower service bundle and a different timing for currency translation, and it appears to rely on slower price progression assumptions that smooth out surcharges and peak season effects. |
The table suggests that timing and scope are the biggest drivers of the spread, rather than any single demand indicator. When the same scope is applied and the price refresh is aligned to the same base year, results typically converge into a tighter range that is easier to explain and track over time.


Key Questions Answered in the Report
How fast is the contract packaging and fulfillment services market expected to grow through 2031?
The contract packaging and fulfillment services market is projected to expand at an 11.25% CAGR, reaching USD 207.67 billion by 2031.
Which end-user category currently contributes the most demand to co-packers?
Food applications lead with 34.12% of 2025 revenue thanks to stringent safety rules and the boom in ready-to-eat formats.
Why are e-commerce brands turning to contract packagers?
High parcel volumes, damage-reduction needs, and the importance of a differentiated unboxing experience push online sellers to specialized partners with automated right-sizing and personalized labeling.
What is the biggest sustainability challenge facing contract packagers?
Compliance with expanding extended-producer-responsibility regulations drives investment in material traceability systems and recyclable or compostable alternatives.
Which region is growing the fastest for outsourced packaging services?
Asia-Pacific is forecast to post a 13.28% CAGR to 2031, underpinned by manufacturing expansion, digital-commerce adoption, and supportive government modernization programs.
How are 3PLs influencing the competitive landscape?
Major logistics providers add robotic pack cells inside warehouses, offering integrated storage, packaging, and dispatch that pressure traditional co-packers to broaden capabilities.
Page last updated on:





