E-commerce Returns And Reverse-Logistics Packaging Market Size and Share
Market Overview
| Study Period | 2019 - 2030 |
|---|---|
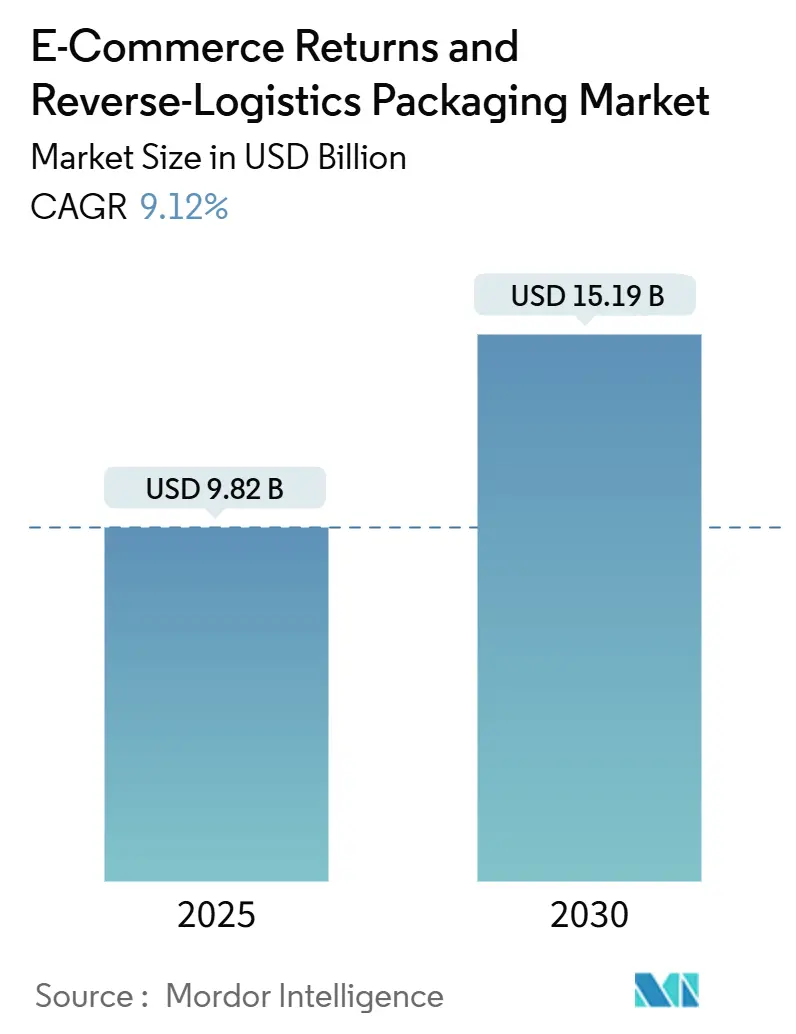
| Market Size (2025) | USD 9.82 Billion |
| Market Size (2030) | USD 15.19 Billion |
| Growth Rate (2025 - 2030) | 9.12% CAGR |
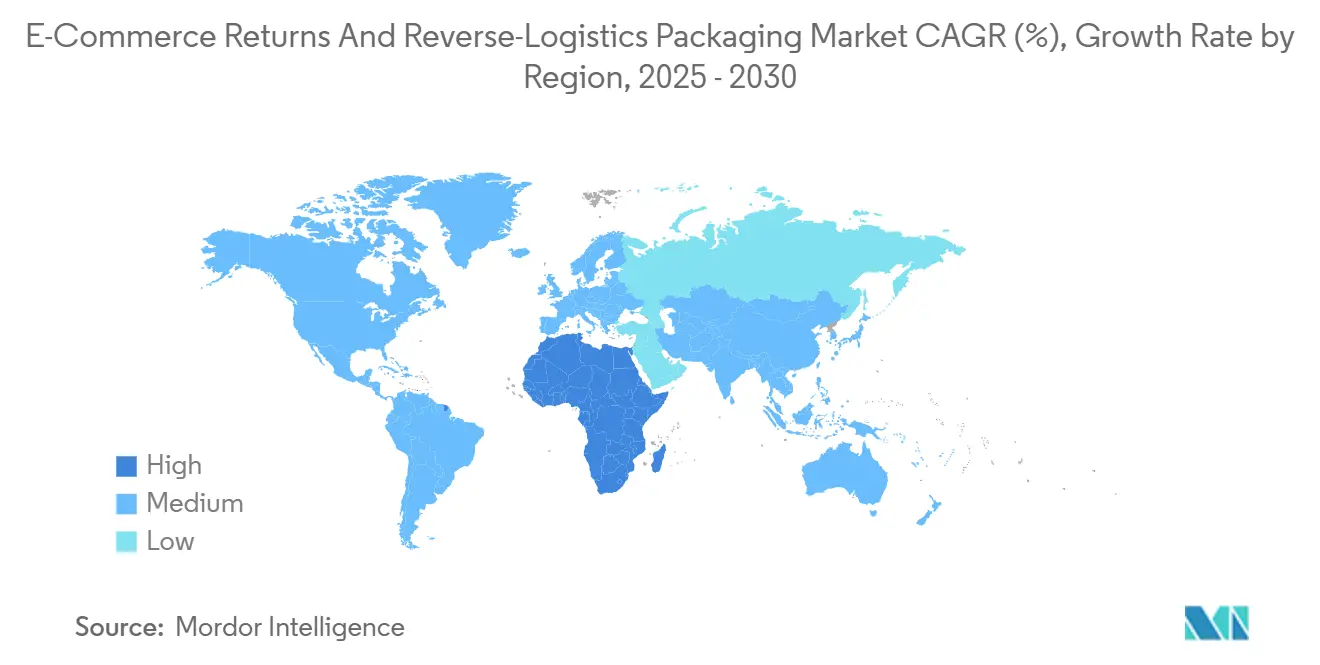
| Fastest Growing Market | Middle East |
| Largest Market | Asia Pacific |
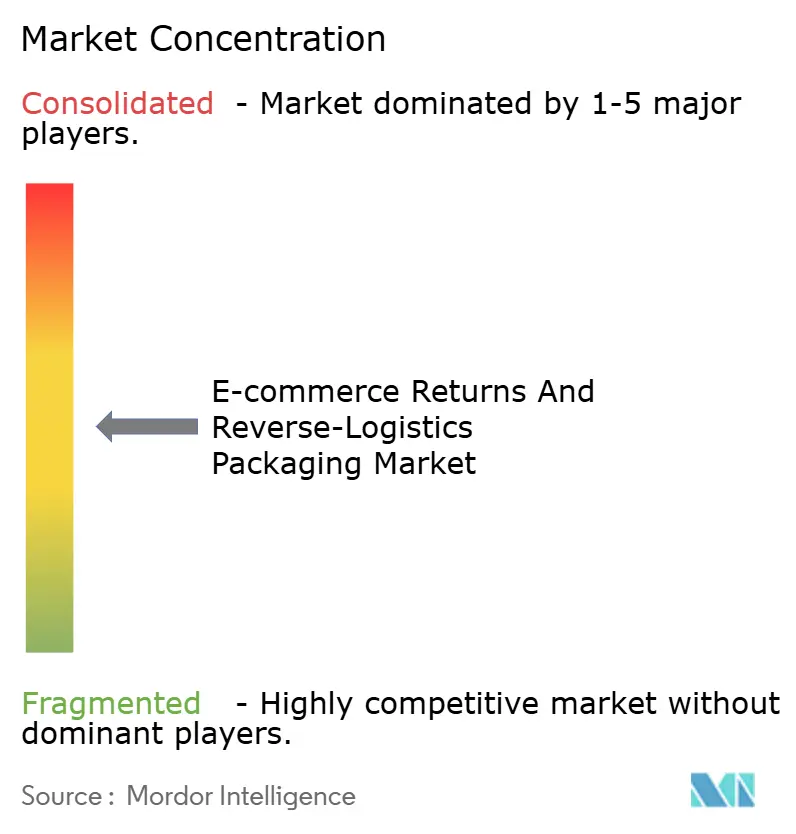
| Market Concentration | Medium |
Major Players *Disclaimer: Major Players sorted in no particular order Image © Mordor Intelligence. Reuse requires attribution under CC BY 4.0. | |
E-commerce Returns And Reverse-Logistics Packaging Market Analysis by Mordor Intelligence
The E-commerce Returns And Reverse-Logistics Packaging Market size reached USD 9.82 billion in 2025 and is forecast to touch USD 15.19 billion by 2030, reflecting a 9.12% CAGR. The expansion of omnichannel retail, regulatory mandates for free returns, and brand commitments to circular supply chains position the e-commerce returns and reverse logistics packaging market for sustained growth. Surging cross-border transactions increase the demand for packaging that can withstand longer transit cycles while meeting diverse recycling rules. The adoption of AI-based right-sizing systems reduces material use and freight costs, further strengthening the competitive case for investment. Heightened consumer awareness of environmental impact is steering brands toward reusable solutions, and technology-driven partnerships between logistics providers and packaging firms are accelerating integrated offerings that address both outbound and reverse flows.
Key Report Takeaways
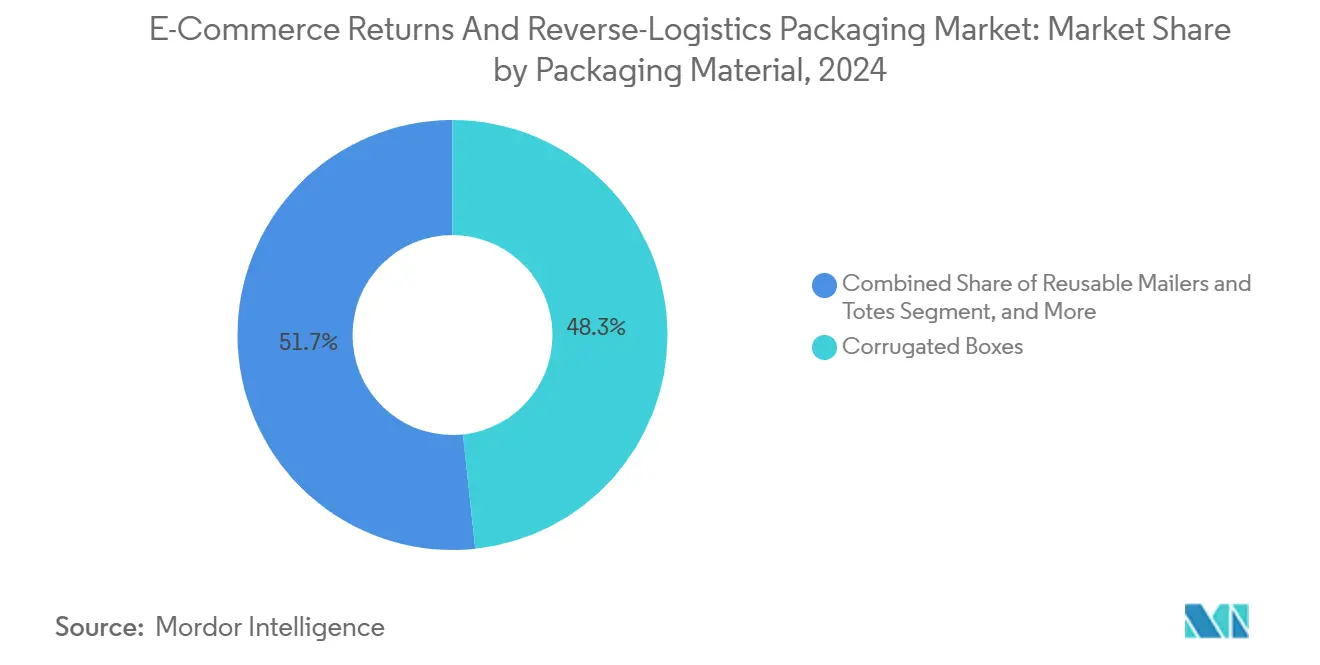
- By packaging material, corrugated boxes captured 48.31% of the E-commerce Returns And Reverse-Logistics Packaging Market share in 2024.
- By return method, the E-commerce Returns And Reverse-Logistics Packaging Market size for automated locker systems is forecast to advance at a 10.37% CAGR through 2030.
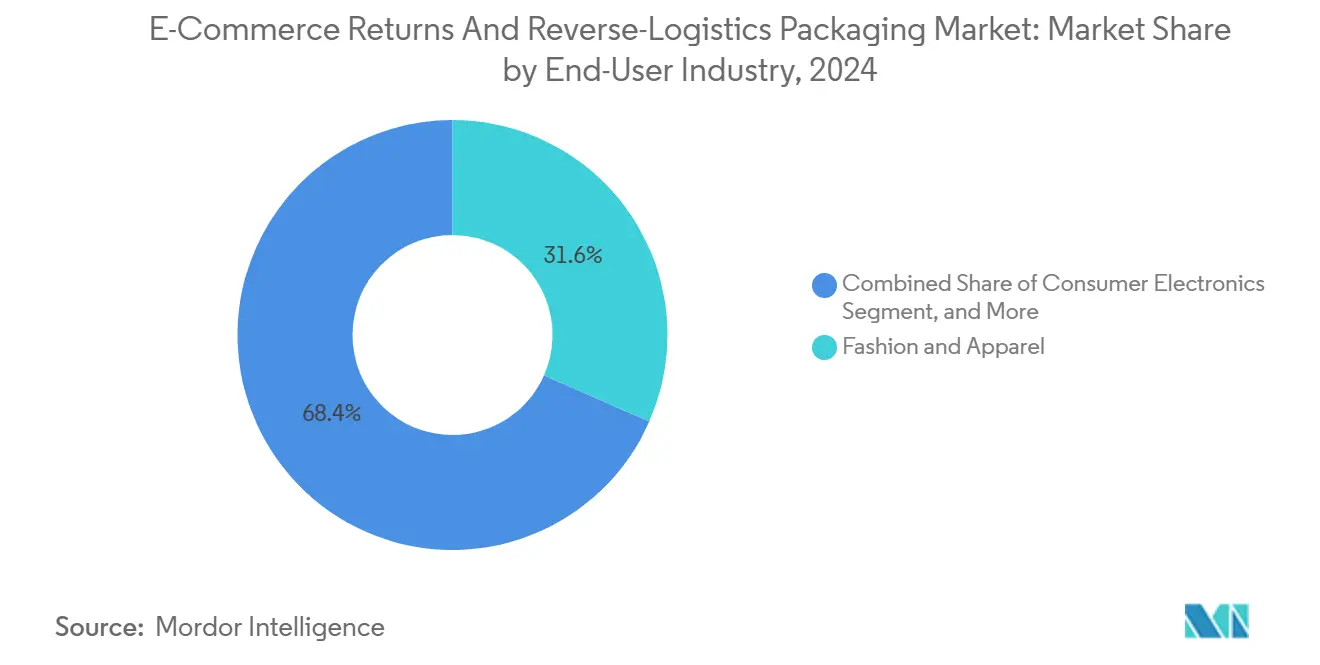
- By end-use industry, fashion and apparel captured 31.59% of the E-commerce Returns And Reverse-Logistics Packaging Market share in 2024.
- By channel, the E-commerce Returns And Reverse-Logistics Packaging Market size for subscription commerce is forecast to advance at a 10.45% CAGR through 2030.
- By geography, Asia-Pacific captured 38.34% of the E-commerce Returns And Reverse-Logistics Packaging Market share in 2024.
Note: Market size and forecast figures in this report are generated using Mordor Intelligence’s proprietary estimation framework, updated with the latest available data and insights as of January 2026.
Global E-commerce Returns And Reverse-Logistics Packaging Market Trends and Insights
Drivers Impact Analysis*
| Driver | (~) % Impact on CAGR Forecast | Geographic Relevance | Impact Timeline |
|---|---|---|---|
| Rising omni-channel return rates | +2.3% | Global – North America and Europe strongest | Medium term (2-4 years) |
| Growth of legislation mandating free returns | +1.8% | Europe and North America, expanding to Asia-Pacific | Long term (≥ 4 years) |
| Brand differentiation via sustainable return packaging | +1.5% | Global, early adoption in developed markets | Medium term (2-4 years) |
| Expansion of AI-driven right-size packaging systems | +1.2% | North America and Asia-Pacific, Europe following | Short term (≤ 2 years) |
| Implementation of digital ID / QR for reverse logistics | +0.9% | Asia-Pacific and North America, gradual EU adoption | Medium term (2-4 years) |
| Circular-economy goals of major retailers | +1.4% | Global, with strict rules in EU and California | Long term (≥ 4 years) |
| Source: Mordor Intelligence | |||
Rising Omni-Channel Return Rates
Return rates surpass 30% in fashion and 15% in consumer electronics, creating persistent demand for specialized packaging that endures multi-touchpoint journeys.[1]Sarah Nassauer, “Omnichannel Returns Create Packaging Complexity,” Wall Street Journal, wsj.com Buy-online-return-in-store models require formats that allow quick inspection, while digital tracking rules under the EU Digital Services Act add documentation layers that shape design. Retailers equipped with adaptable packaging minimize handling damage, accelerate restocking, and elevate customer satisfaction.
Growth of Legislation Mandating Free Returns
France’s anti-waste law and California’s proposed statutes transfer return shipping costs from consumers to retailers, forcing brands to re-engineer packaging for cost, protection, and sustainability. Compliance frameworks drive demand for certified biodegradable materials and provide right-sized solutions that reduce freight surcharges.
Brand Differentiation via Sustainable Return Packaging
Reusable mailers and compostable options serve as loyalty builders, with programs such as Patagonia’s circular packaging driving measurable repeat-purchase gains.[2]Peter Smith, “Packaging Regulations Drive Circular Economy Adoption,” Financial Times, ft.com Public ESG disclosures require quantifiable waste-reduction metrics, turning packaging decisions into visible performance indicators.
Expansion of AI-Driven Right-Size Packaging Systems
Machine learning engines embedded in fulfillment centers reduce material use by up to 25% and eliminate void-fill waste, enabling the real-time alignment of box profiles with SKU dimensions. Adoption speeds ahead as cloud-based tools become available to third-party sellers, lowering barriers for midsize merchants.
Restraints Impact Analysis*
| Restraint | (~) % Impact on CAGR Forecast | Geographic Relevance | Impact Timeline |
|---|---|---|---|
| Fragmented recycling infrastructure in emerging markets | -1.6% | Asia-Pacific emerging, Latin America, Africa | Long term (≥ 4 years) |
| High volatility in recycled fibre prices | -1.2% | Global, high sensitivity in cost-focused segments | Short term (≤ 2 years) |
| Reverse-logistics cost inflation outpacing outbound rates | -0.8% | Global, peak in North America and Europe | Medium term (2-4 years) |
| Consumer fatigue toward re-packing complexity | -0.7% | Developed markets with high return frequency | Medium term (2-4 years) |
| Source: Mordor Intelligence | |||
Fragmented Recycling Infrastructure in Emerging Markets
Uneven regional capabilities in India and parts of Latin America compel brands to maintain multiple packaging variants, raising inventory and compliance complexity. This barrier slows scalable deployment of reusable or advanced bio-based formats.
High Volatility in Recycled Fibre Prices
Recycled cardboard prices swung 40% in 2024, undermining budget predictability for merchants that rely on thin margins.[3]Jacob Bunge, “Recycled Fiber Price Volatility Impact,” Wall Street Journal, wsj.com Price hedging strategies lock capital, creating entry hurdles for smaller e-commerce brands and raising the attractiveness of durable multi-use designs that amortize material cost over several cycles.
*Our forecasts treat driver/restraint impacts as directional, not additive. The impact forecasts reflect baseline growth, mix effects, and variable interactions.
Segment Analysis
By Packaging Material: Shift From Single-Use to Circular Alternatives
Corrugated boxes retained a 48.31% share of the e-commerce returns and reverse logistics packaging market in 2024, serving as the backbone of high-volume fulfillment. The e-commerce returns and reverse logistics packaging market size tied to corrugated solutions remains resilient because rigid structures safeguard large electronics and household goods during transit. Yet, reusable mailers and totes post an 11.29% CAGR, underscoring a brand migration toward lower lifetime costs per shipment. AI-enabled right-sizing machinery further enhances corrugated efficiency by trimming excess void and lowering dimensional weight penalties.
Growing subscription services accelerate the adoption of durable textiles, polymers, and coated papers engineered for 20 or more cycles. Loop’s program validates cost savings of nearly 60% over one-way formats, enticing retailers to shift capital from single-use corrugated to pooled inventories of return-ready totes. Protective cushioning inside reusable mailers now incorporates recycled content, aligning with circular economy goals championed by EU regulators.


By Return Method: Automation Enhances Convenience Economics
Drop-off stores and parcel shops handled 42.94% of returns in 2024, utilizing their existing retail footprints to provide assisted service. Automated locker systems grow at a 10.37% CAGR, driven by 24-hour access and labor cost efficiency. Return lockers process 40% more transactions per square foot than staffed counters, validating the scalability of self-service models.
Courier pick-up remains relevant for premium electronics and bulky goods, yet labor inflation narrows margins. The integration of mobile QR codes enables contactless handovers, which shorten queue times and improve tracking precision. As urban density rises, micro-hub lockers embedded in transit stations reduce final-mile emissions and extend locker coverage to commute corridors, reinforcing convenience as a competitive differentiator.
By End-Use Industry: Electronics Narrow the Gap With Fashion
Fashion and apparel commanded a 31.59% share in 2024, primarily due to high return rates related to fit and lightweight parcel characteristics. The E-commerce Returns And Reverse-Logistics Packaging Market size for consumer electronics is, however, expanding at a 10.11% CAGR as protective, anti-static, and tamper-evident solutions become mandatory for high-value items. Electronics brands utilize molded pulp and foam-in-place inserts to protect devices from shock while maintaining recyclability.
Beauty and personal care require leak-proof formats and temperature resistance, prompting innovation in laminated paper structures that withstand multiple uses. Home-and-living items continue to rely on reinforced corrugated with honeycomb inserts that mitigate breakage. The grocery sector remains niche due to perishability constraints, although reusable cold-chain totes in pilot programs hint at future growth once cost hurdles are overcome.
By Channel: Subscriptions Optimize Lifetime Packaging Economics
Marketplace sellers accounted for 46.91% of channel volume in 2024, benefitting from standardized parcel dimensions and scale purchasing power. Direct-to-consumer brands view packaging as a brand canvas, often selecting premium textures that complement the unboxing experience. The subscription segment grows at a 10.45% CAGR because predictable volumes justify investment in durable packaging that amortizes cost across repeated deliveries.
Rental and resale platforms favor robust, easy-to-sanitize totes that withstand varied product conditions and geographies. Stitch Fix achieved a 25% reduction in packaging cost after migrating to data-informed sizing algorithms that harmonize box profiles with fashion item bundles. Blockchain tags integrated into subscription parcels monitor cycle counts, enabling data-driven redeployment or recycling at the end of life.
Geography Analysis
Asia-Pacific led the E-commerce Returns And Reverse-Logistics Packaging Market with a 38.34% share in 2024 on the back of China’s e-commerce scale and circular-packaging directives. Government incentives in Japan and South Korea accelerate AI-enabled optimization, and regional manufacturers benefit from cost-competitive raw materials and high-speed converting lines. India’s rapid online retail growth fuels demand for economical mailers, but patchy recycling facilities slow the uptake of advanced bio-composites.
North America remains an innovation hub thanks to mature fulfillment infrastructure and early adoption of cloud-based packaging analytics. California’s stringent waste-reduction rules stimulate the development of premium biodegradable options, while extended producer responsibility frameworks in Canada encourage reusable pilot programs. Mexico’s rising cross-border trade requires bilingual labeling and customs-compliant return forms, thereby deepening collaboration between carriers and packaging converters.
Europe embeds sustainability leadership via the EU circular-economy action plan, which imposes explicit reuse and recyclability thresholds. Germany’s deposit-refund regimes shape design guidelines, and post-Brexit United Kingdom policies create niche demand for country-specific compliance labeling. The Middle East posts the fastest regional CAGR at 10.15%, underpinned by the Gulf states’ Vision 2030 ambitions, which couple digital-commerce expansion with environmental stewardship. Saudi Arabia and the United Arab Emirates are piloting smart lockers and luxury-grade reusable packaging that aligns with their high-value retail positioning.

Competitive Landscape
The industry structure is moderately fragmented, yet technology-led consolidation is gathering momentum. AI specialists, packaging converters, and third-party logistics providers form alliances to deliver integrated forward and reverse logistics solutions. Optoro acquired niche machine-learning ventures to refine predictive packaging analytics, which reduce excess material and expedite the triage of returned goods. Happy Returns leverages PayPal integration to streamline QR-based drop-offs, trimming queues and enabling packaging size reductions during restocking.
Traditional corrugated manufacturers pursue sustainability by integrating recycled-fiber supply assurance and launching bio-resin-coated papers. Polymer innovators develop lightweight, reusable mailers engineered for 20-plus cycles before mechanical recycling. Logistics incumbents partner with locker-network operators to scale unattended returns, which reduce labor overhead and enhance data capture. White-space remains in temperature-controlled and anti-static niches, where performance requirements exceed current return packaging standards.
Capital inflows target circular-economy themes. Loop secured USD 25 million in Series B funding to expand pooled tote networks across North America, signaling investor confidence in asset-sharing models. AWS, Narvar, and other tech vendors monetize SaaS packaging analytics that bolt onto warehouse-management systems, democratizing access to right-size decisioning for SMEs. Competitive intensity now hinges on proprietary data insights, sustainability proof points, and the ability to integrate seamlessly with e-commerce storefronts and carrier APIs.
E-commerce Returns And Reverse-Logistics Packaging Industry Leaders
Happy Returns LLC (UPS)
Xariable, Inc. (dba Loop Returns)
Narvar, Inc.
ReverseLogix Corp.
Inmar, Inc.
- *Disclaimer: Major Players sorted in no particular order

Recent Industry Developments
- January 2025: The European Commission published draft guidance on digital product passports for packaging, outlining QR-code standards for reuse tracking.
- October 2024: Loop announced a USD 25 million Series B round to expand reusable packaging infrastructure across North American platforms.
- September 2024: Amazon Web Services introduced AI tools that recommend optimal packaging based on return likelihood and SKU fragility.
- August 2024: Optoro and Walmart deployed automated QR-based return systems in 500 U.S. stores, cutting processing time by 40%.


Global E-commerce Returns And Reverse-Logistics Packaging Market Report Scope
| Corrugated Boxes |
| Paper Mailers and Envelopes |
| Poly Mailers |
| Reusable Mailers and Totes |
| Protective Inner Packaging |
| Pre-Paid Label Courier Pickup |
| Drop-Off Store / Parcel Shop |
| Locker / Kiosk Returns |
| Carrier Pick-Up on Demand |
| Fashion and Apparel |
| Consumer Electronics |
| Beauty and Personal Care |
| Home and Living |
| Grocery and FMCG |
| Other End-User Industries |
| Marketplace Sellers |
| Direct-to-Consumer Brands |
| Subscription Commerce |
| Rental and Resale Platforms |
| North America | United States | |
| Canada | ||
| Mexico | ||
| South America | Brazil | |
| Argentina | ||
| Rest of South America | ||
| Europe | Germany | |
| United Kingdom | ||
| France | ||
| Italy | ||
| Spain | ||
| Russia | ||
| Rest of Europe | ||
| Asia-Pacific | China | |
| Japan | ||
| India | ||
| South Korea | ||
| South-East Asia | ||
| Rest of Asia-Pacific | ||
| Middle East and Africa | Middle East | Saudi Arabia |
| United Arab Emirates | ||
| Turkey | ||
| Rest of Middle East | ||
| Africa | South Africa | |
| Nigeria | ||
| Rest of Africa | ||
| By Packaging Material | Corrugated Boxes | ||
| Paper Mailers and Envelopes | |||
| Poly Mailers | |||
| Reusable Mailers and Totes | |||
| Protective Inner Packaging | |||
| By Return Method | Pre-Paid Label Courier Pickup | ||
| Drop-Off Store / Parcel Shop | |||
| Locker / Kiosk Returns | |||
| Carrier Pick-Up on Demand | |||
| By End-User Industry | Fashion and Apparel | ||
| Consumer Electronics | |||
| Beauty and Personal Care | |||
| Home and Living | |||
| Grocery and FMCG | |||
| Other End-User Industries | |||
| By Channel | Marketplace Sellers | ||
| Direct-to-Consumer Brands | |||
| Subscription Commerce | |||
| Rental and Resale Platforms | |||
| By Geography | North America | United States | |
| Canada | |||
| Mexico | |||
| South America | Brazil | ||
| Argentina | |||
| Rest of South America | |||
| Europe | Germany | ||
| United Kingdom | |||
| France | |||
| Italy | |||
| Spain | |||
| Russia | |||
| Rest of Europe | |||
| Asia-Pacific | China | ||
| Japan | |||
| India | |||
| South Korea | |||
| South-East Asia | |||
| Rest of Asia-Pacific | |||
| Middle East and Africa | Middle East | Saudi Arabia | |
| United Arab Emirates | |||
| Turkey | |||
| Rest of Middle East | |||
| Africa | South Africa | ||
| Nigeria | |||
| Rest of Africa | |||


Key Questions Answered in the Report
What is the projected value of the E-commerce Returns And Reverse-Logistics Packaging Market by 2030?
The market is expected to reach USD 15.19 billion by 2030 based on a 9.1% CAGR forecast.
Which packaging material currently dominates the space?
Corrugated boxes lead with 48.31% revenue share thanks to cost efficiency and universal recyclability.
Why are automated locker returns growing rapidly?
Locker systems provide 24-hour access and cut labor costs, supporting a 10.37% CAGR in this return method.
How do subscription commerce models influence packaging choices?
Predictable shipment volumes allow brands to invest in reusable packaging that lowers per-cycle cost and waste.
What regional markets are expanding the fastest?
The Middle East, particularly Saudi Arabia and the UAE, is growing at 10.15% CAGR due to Vision 2030 commitments.
How are AI tools changing packaging design?
Machine learning optimizes box dimensions in real time, reducing material use by up to 25% and lowering freight charges.
Page last updated on:


