Label Market Size and Share
Market Overview
| Study Period | 2020 - 2031 |
|---|---|
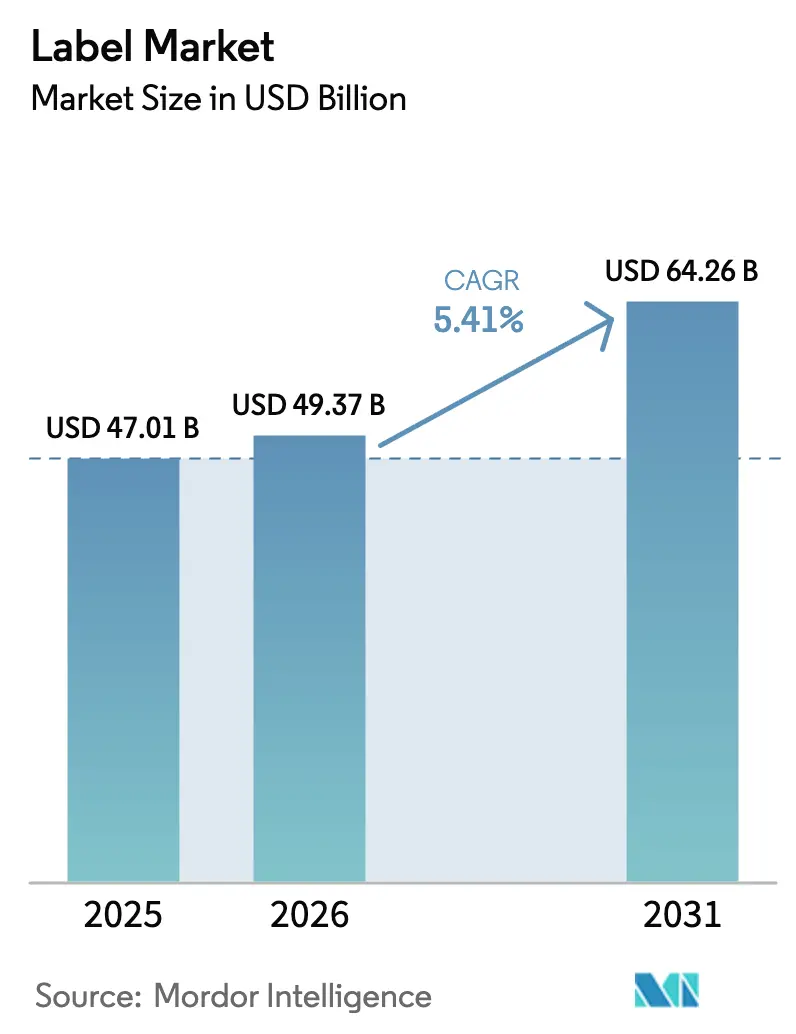
| Market Size (2026) | USD 49.37 Billion |
| Market Size (2031) | USD 64.26 Billion |
| Growth Rate (2026 - 2031) | 5.41% CAGR |
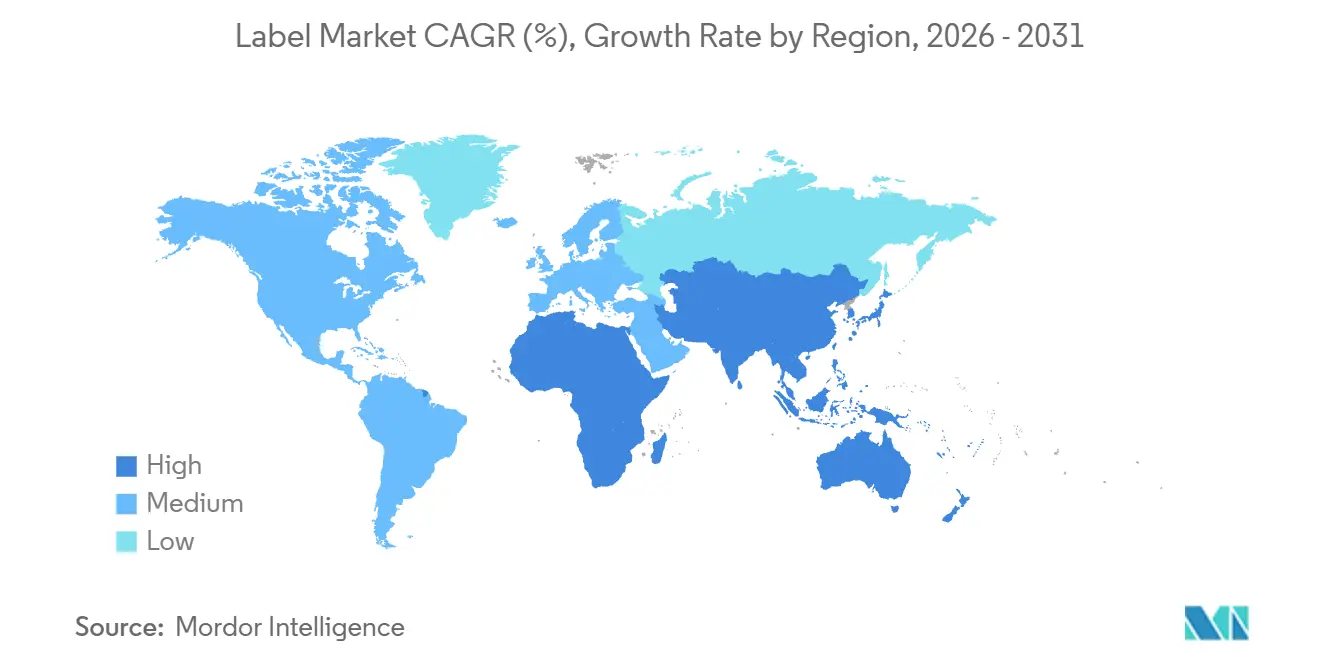
| Fastest Growing Market | Middle East and Africa |
| Largest Market | Asia Pacific |
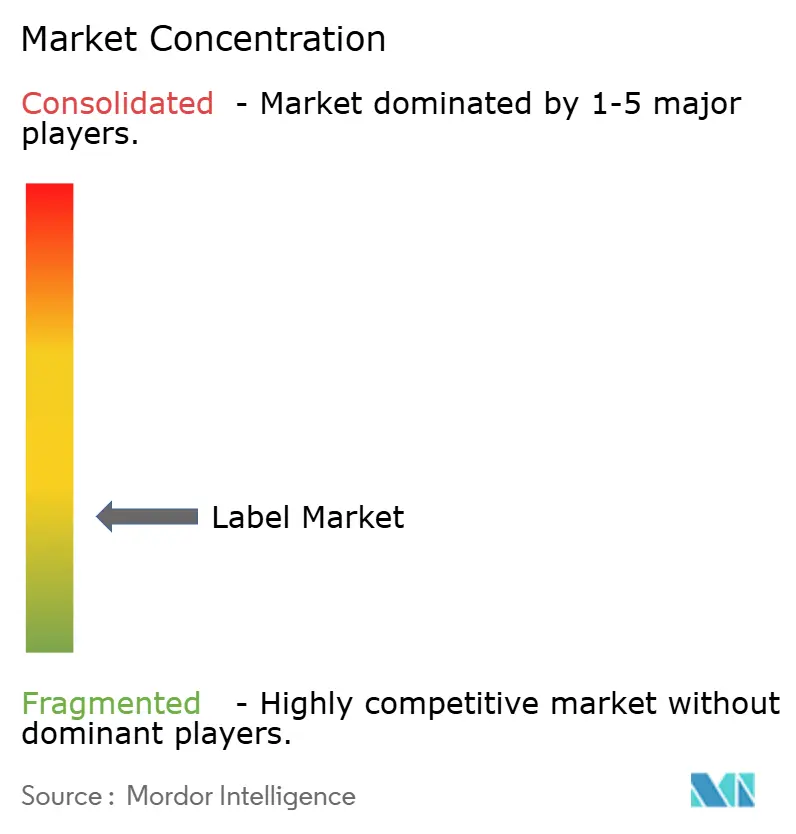
| Market Concentration | Low |
Major Players *Disclaimer: Major Players sorted in no particular order Image © Mordor Intelligence. Reuse requires attribution under CC BY 4.0. | |
Label Market Analysis by Mordor Intelligence
The label market size is expected to increase from USD 47.01 billion in 2025 to USD 49.37 billion in 2026 and reach USD 64.26 billion by 2031, growing at a CAGR of 5.41% over 2026-2031. Strong e-commerce logistics, stricter sustainability regulations, and rapid deployment of smart and connected-packaging formats are anchoring this steady expansion. Beverage and cosmetics brands are gravitating to full-body shrink sleeves that remove secondary packaging, while liner-less pressure-sensitive formats appeal to retailers facing landfill-reduction mandates. Material substitution is gathering pace as brand owners pivot to recycled polyethylene terephthalate (rPET) facestocks compatible with bottle-to-bottle loops. At the same time, converters are investing in high-speed digital inkjet presses that combine variable-data capability with shorter lead times, a prerequisite for serialization and limited-edition product drops. Moderate competitive intensity prevails because scale economies in adhesive formulation and digital-press fleets allow the largest players to secure multi-year global contracts.
Key Report Takeaways
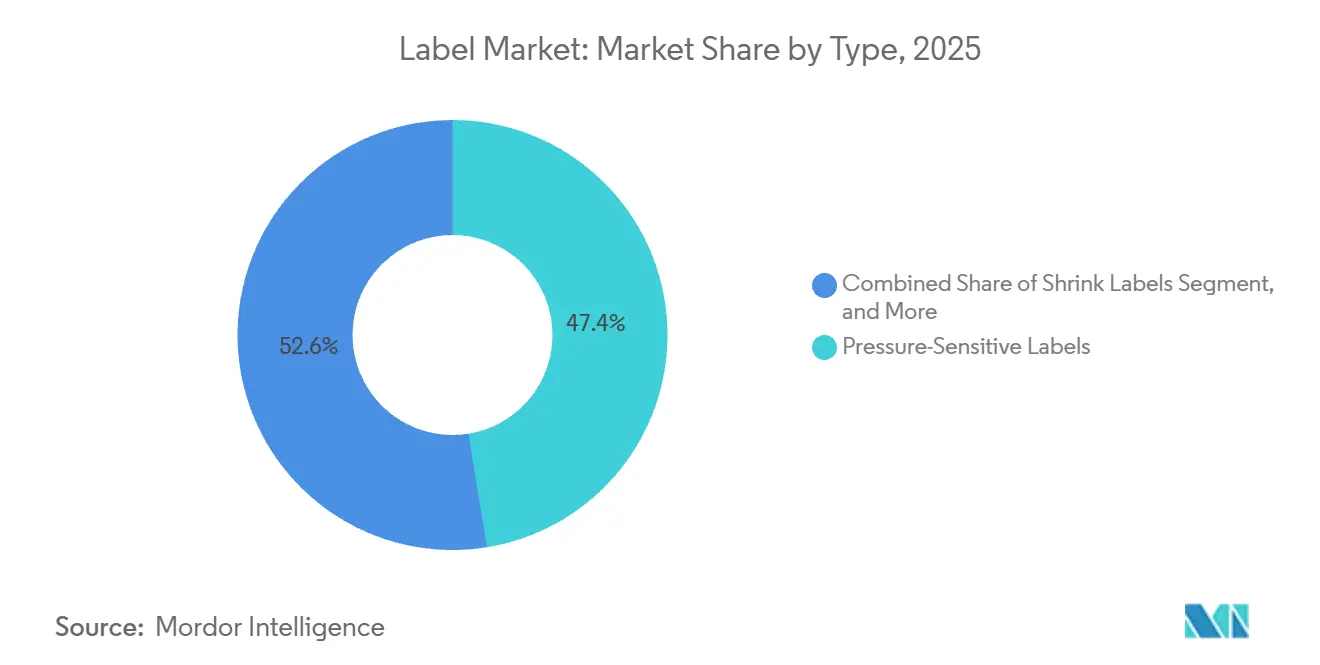
- By type, pressure-sensitive labels led with 47.44% of the label market share in 2025, while shrink labels are projected to expand at a 6.25% CAGR through 2031.
- By material, polypropylene accounted for 36.77% share of the label market size in 2025, and polyethylene terephthalate is forecast to grow at a 6.72% CAGR between 2026-2031.
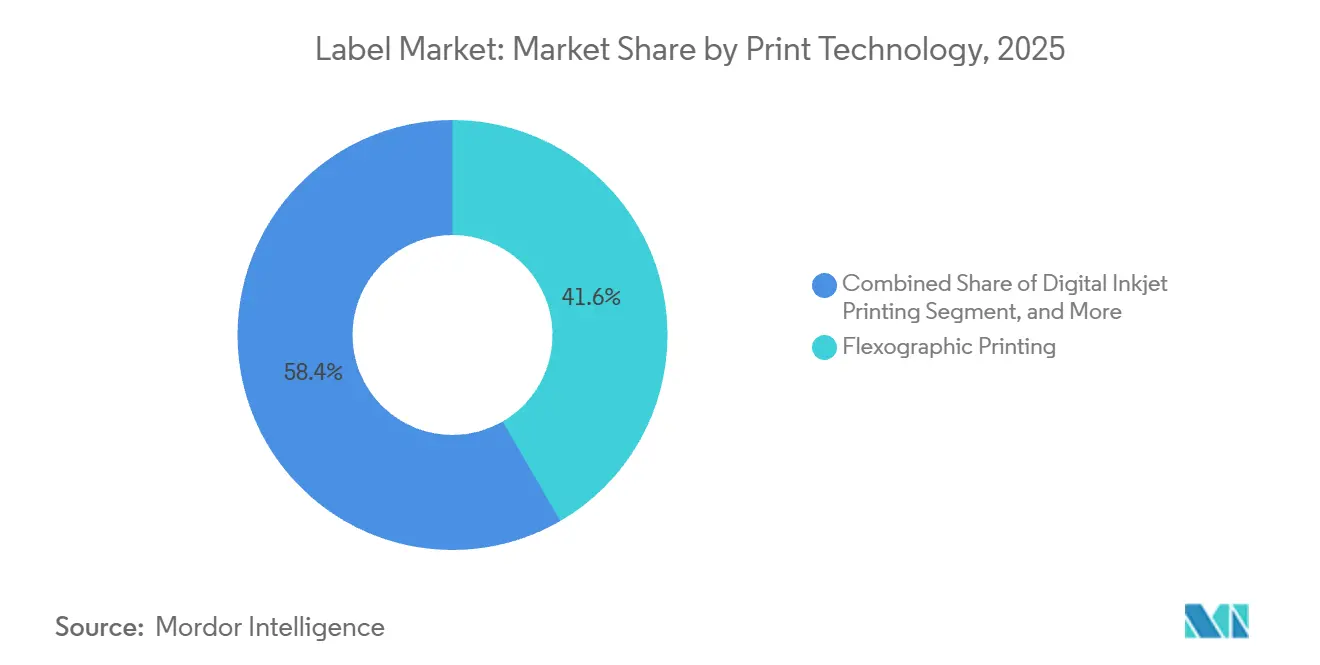
- By print technology, flexography captured 41.63% of market share in 2025, whereas digital inkjet is advancing at a 6.91% CAGR to 2031.
- By end-user industry, food applications held 34.76% of market share in 2025, yet cosmetics and personal care are rising at a 7.32% CAGR over 2026-2031.
- By Geography, Asia-Pacific commanded 40.14% of the market share in 2025, and the Middle East and Africa are poised to record the fastest 7.11% CAGR through 2031.
Note: Market size and forecast figures in this report are generated using Mordor Intelligence’s proprietary estimation framework, updated with the latest available data and insights as of 2026.
Global Label Market Trends and Insights
Drivers Impact Analysis*
| Driver | (~) % Impact on CAGR Forecast | Geographic Relevance | Impact Timeline |
|---|---|---|---|
| E-commerce Boom Driving Variable-Data Shipping Labels | +1.2% | Global, with concentration in North America, Europe, and Asia-Pacific urban corridors | Short term (≤ 2 years) |
| Sustainability Regulations Accelerating Liner-less and Recyclable Formats | +1.5% | Europe and North America, spillover to Asia-Pacific and Middle East | Medium term (2-4 years) |
| Smart and Connected Packaging Unlocking New Revenue Streams | +1.0% | Global, early adoption in North America, Europe, and Japan | Medium term (2-4 years) |
| Food and Beverage Demand for Premium Compliance-Driven Packaging | +0.9% | Global, regulatory influence strongest in North America, Europe, and India | Long term (≥ 4 years) |
| EV Battery-Safety Mandates Spurring High-Spec Pressure-Sensitive Labels | +0.4% | North America, Europe, China, South Korea | Medium term (2-4 years) |
| ASEAN Label-Free Bottle Pilots Catalyzing Direct-to-Container Printing | +0.3% | ASEAN core, pilot spillover to Europe and South America | Long term (≥ 4 years) |
| Source: Mordor Intelligence | |||
E-commerce Boom Driving Variable-Data Shipping Labels
Global parcel volumes surpassed 21 billion units in 2024, and every box still needs at least one scannable identifier. Converters are responding with high-speed digital inkjet presses that print unique barcodes above 100 meters per minute, enabling same-day fulfillment for flash-sale retailers. Pharmaceutical cold-chain logistics adds complexity because temperature-indicator labels must also carry batch and expiry codes required by the U.S. Drug Supply Chain Security Act. Cross-border parcels entering the European Union must display QR codes linked to digital product passports introduced under the Packaging and Packaging Waste Regulation in 2025. Converters lacking digital capacity risk share loss to agile peers already scaled for short runs and variable data.
Sustainability Regulations Accelerating Liner-less and Recyclable Formats
The European Union now requires all packaging to be recyclable by 2030 and mandates 30% rPET in bottles by the same year. These rules push label market participants to adopt wash-off adhesives and liner-less constructions that remove silicone-coated release liners. UPM Raflatac’s RafCycle network, recently expanded to Poland and Thailand, diverts about 10 000 metric tons of liner waste annually.[1]UPM Raflatac, “RafCycle – Label Waste Recycling,” upmraflatac.com Similar programs are emerging in North America as extended producer responsibility laws roll out in California and Oregon. Brand owners also face PFAS bans in food-contact labels, prompting converters to invest in fluorine-free coatings certified under ISO 14021.
Smart and Connected Packaging Unlocking New Revenue Streams
Embedded NFC and RFID tags transform a static label into a data carrier that authenticates goods, streamlines inventory, and engages shoppers. Avery Dennison disclosed double-digit growth for its intelligent-label line during 2025, citing RFID deployment in apparel and luxury goods. The U.S. Food Safety Modernization Act now obligates high-risk foods to include traceability lot codes, and many packers encode this information in QR-enabled labels that link to blockchain ledgers.[2]U.S. Food and Drug Administration, “FSMA Final Rule: Additional Traceability Records,” fda.gov Deposit-return schemes in Germany and Norway repay consumers based on barcode scans, a model expected to migrate to additional EU states by 2027. As the digital product passport expands to packaging, labels will house environmental and repairability metrics required during resale and recycling.
Food and Beverage Demand for Premium Compliance-Driven Packaging
Governments worldwide are tightening front-of-pack rules. The revised U.S. Nutrition Facts label enlarged real estate for added-sugar disclosures, while India introduced color-coded warnings for salt, sugar, and fat. Beverage brands answer with 360-degree shrink sleeves that combine premium graphics with room for regulatory statements. Fuji Seal International recorded an 8% increase in shrink-sleeve installations during 2024 as craft brewers and functional-water bottlers seek shelf impact. Traceability codes that survive refrigeration and pasteurization are now mainstream, pushing converters to develop acrylic-emulsion adhesives that maintain tack at 4 °C. Luxury spirits add embossed foils and tactile varnishes, further lifting average label price per unit.
Restraints Impact Analysis*
| Restraint | (~) % Impact on CAGR Forecast | Geographic Relevance | Impact Timeline |
|---|---|---|---|
| Raw-Material Cost Volatility in Films and Adhesives | -0.8% | Global, acute in regions dependent on imported petrochemicals | Short term (≤ 2 years) |
| Shift Toward Stand-Up Pouches and Direct-to-Object Printing | -0.6% | Global, accelerated adoption in North America, Europe, and Asia-Pacific | Medium term (2-4 years) |
| Limited Global Liner-Waste Recycling Infrastructure | -0.3% | Global, infrastructure gaps most severe in Asia-Pacific and Middle East and Africa | Long term (≥ 4 years) |
| Emerging Label-Free Bottle Regulations Reducing Wrap-Around Demand | -0.2% | ASEAN, Europe, pilot programs in South America | Long term (≥ 4 years) |
| Source: Mordor Intelligence | |||
Raw-Material Cost Volatility in Films and Adhesives
Polypropylene film traded between USD 1 200-1 600 per metric ton during 2025 as crude-oil swings and supply outages in Asia-Pacific petrochemical hubs unsettled converters.[3]ICIS, “Polypropylene Weekly Price Update,” icis.com Adhesive-resin prices for acrylic emulsions climbed 12% year on year, eroding EBITDA margins that average just 8-12% for mid-sized converters. Locked-price contracts with consumer-goods multinationals limit cost-pass-through, forcing converters to negotiate multi-year supply deals or invest in solvent-free technologies that reduce resin consumption. Recycled PET resin faced similar volatility, reflecting tight bottle-flake supplies under Europe’s 30% rPET mandate. Smaller converters, lacking vertical integration into film extrusion, carry the most exposure to these input shocks.
Shift Toward Stand-Up Pouches and Direct-to-Object Printing
Flexible pouches reached 18% of global food-packaging volume in 2025, cutting or eliminating separate labels for many snacks and liquid concentrates. Direct-to-bottle inkjet systems from Xeikon and HP Indigo also threaten wrap-around demand, as evidenced by Coca-Cola’s label-free pilot in Europe in 2024. PepsiCo now plans North American trials by 2027, signaling that major beverage categories are evaluating cost and sustainability gains from printing directly on containers. Label converters reply with ultra-thin films and liner-less formats that trim material weight, but the substitution trend persists as brands weigh packaging efficiency against established labeling workflows.
*Our forecasts treat driver/restraint impacts as directional, not additive. The impact forecasts reflect baseline growth, mix effects, and variable interactions.
Segment Analysis
By Type: Shrink Sleeves Gain as Brands Favor Full-Body Graphics
Shrink labels are forecast to grow at a 6.25% CAGR through 2031, outstripping the overall label market. Their popularity stems from 360-degree decoration that merges branding, regulatory text, and tamper evidence in one sleeve. Pressure-sensitive formats still held 47.44% of the label market share in 2025 thanks to versatility across substrates and rapid application speeds that exceed 500 units per minute. Wrap-around labels remain endemic to mainstream carbonated drinks but face pilot replacements by laser-etched or direct-print solutions. In-mold labels add process efficiency in dairy tubs and ice-cream containers by integrating decoration during blow molding, cutting a full downstream step. Smaller categories such as glue-applied and heat-transfer styles survive where glass-bottle prestige or industrial durability governs material choice. Shrink sleeves will keep gaining because low-density PET-G and PP films now separate cleanly at recycling plants, addressing circularity concerns.
Converters will still prioritize pressure-sensitive labels for pharmaceuticals, logistics, and chemical drums because stringent wash-off and variable-data needs align with that format’s modular construction. However, wider shrink-sleeve roll widths and automated seaming equipment have reduced per-unit costs, encouraging beverage brands to migrate SKUs that historically used wrap-around film. At the premium end, multi-layer heat-transfer labels with metallic accents are defending share in craft spirits that value tactile differentiation. Overall, the type segment remains a study in application-specific trade-offs where performance, recyclability, and shelf impact counterbalance cost.


By Material: PET Leads Recycled-Content Push
PET film sales are projected to grow at a 6.72% CAGR through 2031 as brand-owner commitments and regulatory quotas boost demand for rPET-ready facestocks. Polypropylene accounted for 36.77% of the market share in 2025 because of its low density and clarity, which support both shrink sleeves and in-mold labels, offering freight savings and optical quality. Paper maintains relevance in premium wine and craft-beer end-markets where textured, FSC-certified stocks evoke authenticity. Polyethylene remains indispensable for frozen foods and squeeze bottles due to its flexibility at sub-zero temperatures. Other polymers, such as PVC and PLA, have niche applications: PVC persists in beverage multipacks despite end-of-life challenges, while PLA films meet compostable-pack aspirations where industrial composting is available.
The European Packaging and Packaging Waste Regulation that enforces 30% rPET in bottles by 2030 drives converters to secure feedstock via bottle-flake supply contracts. UPM Raflatac and Avery Dennison expanded rPET film capacity in 2024-2025, signaling confidence in demand durability. Advances in mono-material polypropylene structures, aligning facestock, adhesive, and over-laminate within PP families, address circularity without material separation. Conversely, paper’s flat outlook reflects vulnerability to moisture, yet premium spirits still specify pulp-based facestocks enhanced with foil stamping and tactile varnishes for shelf appeal.
By Print Technology: Digital Inkjet Captures Variable-Data Surge
Digital inkjet printing is forecast to post a 6.91% CAGR through 2031 as serialization, personalization, and omnichannel retailing reshape the label market. Flexography, with its 41.63% of the market share in 2025, thrives on runs exceeding 10,000 linear meters thanks to quick plate changes and wide-web widths. Offset retains select share in luxury cosmetics and wine, where fine lines and metallic inks justify higher make-ready costs, while gravure declines because cylinder engraving is slow and expensive. Screen printing endures for industrial-grade battery labels and durable outdoor decals that need heavy ink laydown.
Adoption of HP Indigo and Xeikon digital presses, now surpassing 100 meters per minute for certain SKUs, enables converters to offer sub-24-hour lead times, a selling point for craft-beverage launches and seasonal promotions. Pharmaceutical lines, numbering more than 15,000 globally, integrate digital modules to apply DataMatrix codes at the unit level per U.S. and EU mandates. Flexography will continue as the workhorse for high-volume consumer staples, yet digital’s share will expand each year because brand owners value SKU proliferation and late-stage customization above marginal unit-cost savings.
By End-User Industry: Cosmetics Leads Premium-Label Adoption
Cosmetics and personal-care labels are projected to register a 7.32% CAGR through 2031, reinforcing premiumization in skincare, fragrance, and haircare. Luxury brands demand holographic foils, soft-touch coatings, and NFC tags that authenticate refills and reward loyalty via smartphone taps. Food accounted for 34.76% of the market share in 2025 because mandatory front-of-pack nutrition and allergen labeling increased the surface area. Beverage converters supply full-body shrink sleeves to craft brewers, energy-drink makers, and flavored-water brands that rely on vibrant graphics to compete for impulse purchases.
Healthcare and pharmaceutical labels remain governed by strict serialization and tamper-evidence rules, prompting investments in cold-chain compatible adhesives and thermal-indicator inks. Chemical drums, lithium-ion batteries, and industrial machinery rely on polyester facestocks that withstand solvents, abrasion, and temperatures above 150 °C. Logistics, automotive, and electronics demand high-temperature barcodes and UL-recognized safety markings. Within cosmetics, refillable packages from L’Oréal and Estée Lauder require removable, residue-free labels, opening space for repositionable adhesive platforms that allow container reuse.
Geography Analysis
Asia-Pacific retained 40.14% market share in 2025, underscoring its position as the manufacturing nucleus for global consumer goods. China’s parcel-delivery network exceeded 130 billion shipments in 2024, each driving a variable-data logistics label. India’s pharmaceutical exports to the United States necessitate serialized labels compliant with the Drug Supply Chain Security Act, while Japan pioneers NFC-enabled labels that verify brand authenticity and extend customer engagement. South Korea’s cosmetics exporters fuel demand for premium finishes, and Australia’s strict food-safety codes require moisture-resistant adhesives across fresh-produce supply chains. Growth in Southeast Asia is checked by limited liner-waste recycling, yet regional governments are drafting EPR laws that will raise collection rates over the next decade.
The Middle East and Africa is positioned for the fastest 7.11% CAGR to 2031, spurred by modern retail and infrastructure investments. The United Arab Emirates and Saudi Arabia continue building cold-chain capacity, triggering orders for low-temperature-tolerant pressure-sensitive labels. Turkey’s status as a Europe-facing manufacturing hub is attracting multinational converters aiming for near-shore supply. South Africa supplies beverage, pharmaceutical, and household-care labels across sub-Saharan Africa, while Nigeria’s urban middle class is swelling packaged-goods volumes. Despite infrastructure gaps and currency risks, harmonization with GS1 barcoding and nutrition labelling standards points to sustained label market expansion.
North America and Europe remain innovation centers rather than volume growth engines. The United States enforces traceability for high-risk foods under FSMA Section 204, pushing adoption of QR-embedded labels. Simultaneously, state-level EPR schemes shift end-of-life costs to brand owners, lifting demand for liner-less formats that lower waste tonnage. Europe’s Packaging and Packaging Waste Regulation obliges recyclable packaging by 2030 and sets progressive rPET thresholds, encouraging converters to pilot wash-off adhesives and paper-free liner-less constructions. South America, led by Brazil and Argentina, experiences middle-single-digit growth paced by beverage and soy-based food exports, although macroeconomic volatility adds forecasting uncertainty.

Competitive Landscape
The label market exhibits fragmentation. Avery Dennison continues to scale its intelligent-label segment, planning a 25% increase in RFID inlay capacity in Asia-Pacific during 2026. Multi-Color Corporation emphasizes premium wine, spirits, and personal-care labels, leveraging a fleet of HP Indigo digital presses for short runs with metallic and tactile effects. Mid-tier regional firms differentiate on service speed, offering 24-hour proofing and sub-1,000-unit production for craft beverages and boutique cosmetics. Many deploy subscription-based web-to-print portals that integrate directly with Shopify and Amazon storefronts, automating order intake and variable-data artwork.
Technology investment defines competitive advantage: digital inkjet presses, liner-waste take-back schemes, and embedded RFID drive margin uplift despite raw-material headwinds. UPM Raflatac’s RafCycle program exemplifies circular-economy positioning, collecting liner waste and converting it to recycled paper for reuse. Private-equity backed consolidation is set to continue as funds aggregate regional converters with specialty know-how to build resalable platforms.
Strategic partnerships between converters and equipment vendors are expanding. Several top-ten players have inked multi-year supply agreements with HP and Xeikon to co-develop direct-to-container print stations for carbonated soft-drink lines. Others secure long-term polypropylene resin contracts to stabilize input costs. The race is now on to commercialize fully recyclable, mono-material label constructions that meet EU and U.S. recyclability definitions without sacrificing graphics or adhesion.
Label Industry Leaders
Multi-Color Corporation
CCL Industries
Avery Dennison Corporation
Constantia Flexibles GmbH
Huhtamaki Oyj
- *Disclaimer: Major Players sorted in no particular order

Recent Industry Developments
- September 2025: Avery Dennison reported USD 2.2 billion Q3 2025 revenue, citing double-digit growth in intelligent-labels and a 25% RFID inlay capacity hike slated for 2026.
- June 2025: Avery Dennison posted USD 1.3 billion Q2 2025 label and graphic-materials revenue, highlighting demand for wash-off adhesives and rPET facestocks.
- February 2025: UPM Raflatac completed the acquisition of Metamark for EUR 130 million (USD 139 million), adding cast vinyl and reflective films to its European specialty-materials portfolio.
- January 2025: UPM Raflatac rebranded as UPM Adhesive Materials, underscoring expansion into liner-less formats and recycled-content films.


Global Label Market Report Scope
Labels are used for packaging show the contents, product specifications, contact information, health and safety warnings and directions for usage, and for any extra marketing, branding, or price information.
The Label Market Report is Segmented by Type (Pressure-Sensitive, Shrink, In-Mold, Wrap-Around, and Other Types), Material (Paper, Polypropylene, Polyethylene, Polyethylene-Terephthalate and, Other Materials), Print Technology (Flexographic, Offset, Gravure, Digital Inkjet, and Other Printing Technologies), End-User Industry (Food, Beverage, Healthcare and Pharmaceutical, Cosmetics and Personal Care, Chemicals and Industrial, and Other End-user Industries), and Geography (North America, South America, Europe, Asia-Pacific, and Middle East and Africa). The Market Forecasts are Provided in Terms of Value (USD).
| Pressure-Sensitive Labels |
| Shrink Labels |
| In-Mold Labels |
| Wrap-Around Labels |
| Other Types |
| Paper |
| Polypropylene (PP) |
| Polyethylene (PE) |
| Polyethylene-Terephthalate (PET) |
| Other Materials |
| Flexographic Printing |
| Offset Printing |
| Gravure Printing |
| Digital Inkjet Printing |
| Other Printing Technologies |
| Food |
| Beverage |
| Healthcare and Pharmaceutical |
| Cosmetics and Personal Care |
| Chemicals and Industrial |
| Other End-user Industries |
| North America | United States | |
| Canada | ||
| Mexico | ||
| South America | Brazil | |
| Argentina | ||
| Rest of South America | ||
| Europe | Germany | |
| United Kingdom | ||
| France | ||
| Italy | ||
| Spain | ||
| Rest of Europe | ||
| Asia-Pacific | China | |
| Japan | ||
| India | ||
| South Korea | ||
| Australia and New Zealand | ||
| Rest of Asia-Pacific | ||
| Middle East and Africa | Middle East | United Arab Emirates |
| Turkey | ||
| Saudi Arabia | ||
| Africa | South Africa | |
| Nigeria | ||
| Rest of Africa | ||
| By Type | Pressure-Sensitive Labels | ||
| Shrink Labels | |||
| In-Mold Labels | |||
| Wrap-Around Labels | |||
| Other Types | |||
| By Material | Paper | ||
| Polypropylene (PP) | |||
| Polyethylene (PE) | |||
| Polyethylene-Terephthalate (PET) | |||
| Other Materials | |||
| By Print Technology | Flexographic Printing | ||
| Offset Printing | |||
| Gravure Printing | |||
| Digital Inkjet Printing | |||
| Other Printing Technologies | |||
| By End-User Industry | Food | ||
| Beverage | |||
| Healthcare and Pharmaceutical | |||
| Cosmetics and Personal Care | |||
| Chemicals and Industrial | |||
| Other End-user Industries | |||
| By Geography | North America | United States | |
| Canada | |||
| Mexico | |||
| South America | Brazil | ||
| Argentina | |||
| Rest of South America | |||
| Europe | Germany | ||
| United Kingdom | |||
| France | |||
| Italy | |||
| Spain | |||
| Rest of Europe | |||
| Asia-Pacific | China | ||
| Japan | |||
| India | |||
| South Korea | |||
| Australia and New Zealand | |||
| Rest of Asia-Pacific | |||
| Middle East and Africa | Middle East | United Arab Emirates | |
| Turkey | |||
| Saudi Arabia | |||
| Africa | South Africa | ||
| Nigeria | |||
| Rest of Africa | |||


Key Questions Answered in the Report
What is the projected value of the label market by 2031?
The sector is forecast to reach USD 64.26 billion by 2031.
Which label type is growing the fastest through 2031?
Shrink sleeves are advancing at a 6.25% CAGR due to full-body graphics and recyclability advantages.
How will sustainability mandates affect label materials?
Regulations that require 30% rPET in bottles are shifting demand toward PET facestocks and wash-off adhesives compatible with bottle-to-bottle loops.
Why is digital inkjet printing gaining share in labeling?
It supports variable-data serialization and quick turnaround times, driving a 6.91% CAGR in print-technology revenue.
Which region is forecast to post the highest CAGR through 2031?
The Middle East and Africa is set to grow at 7.11% as retail modernization and food-safety regulations take hold.
Page last updated on:


