
Laminated Labels Market Size and Share
Market Overview
| Study Period | 2020 - 2031 |
|---|---|
| Market Size (2026) | USD 38.44 Billion |
| Market Size (2031) | USD 49.82 Billion |
| Growth Rate (2026 - 2031) | 5.32 % |
| Fastest Growing Market | North America |
| Largest Market | Asia Pacific |
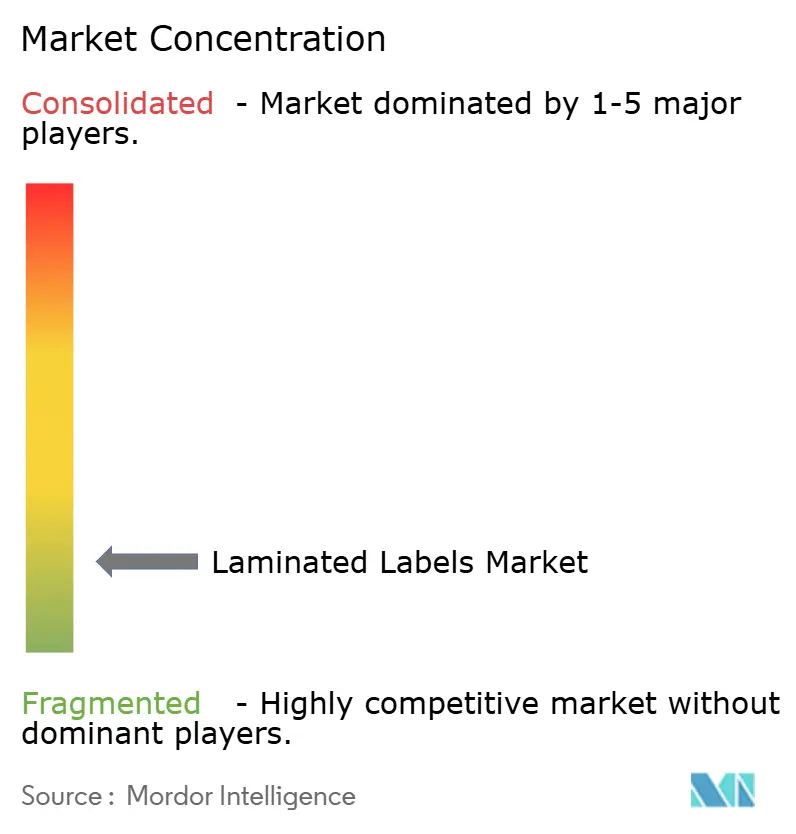
| Market Concentration | Low |
Major Players *Disclaimer: Major Players sorted in no particular order Image © Mordor Intelligence. Reuse requires attribution under CC BY 4.0. | |
Laminated Labels Market Analysis by Mordor Intelligence
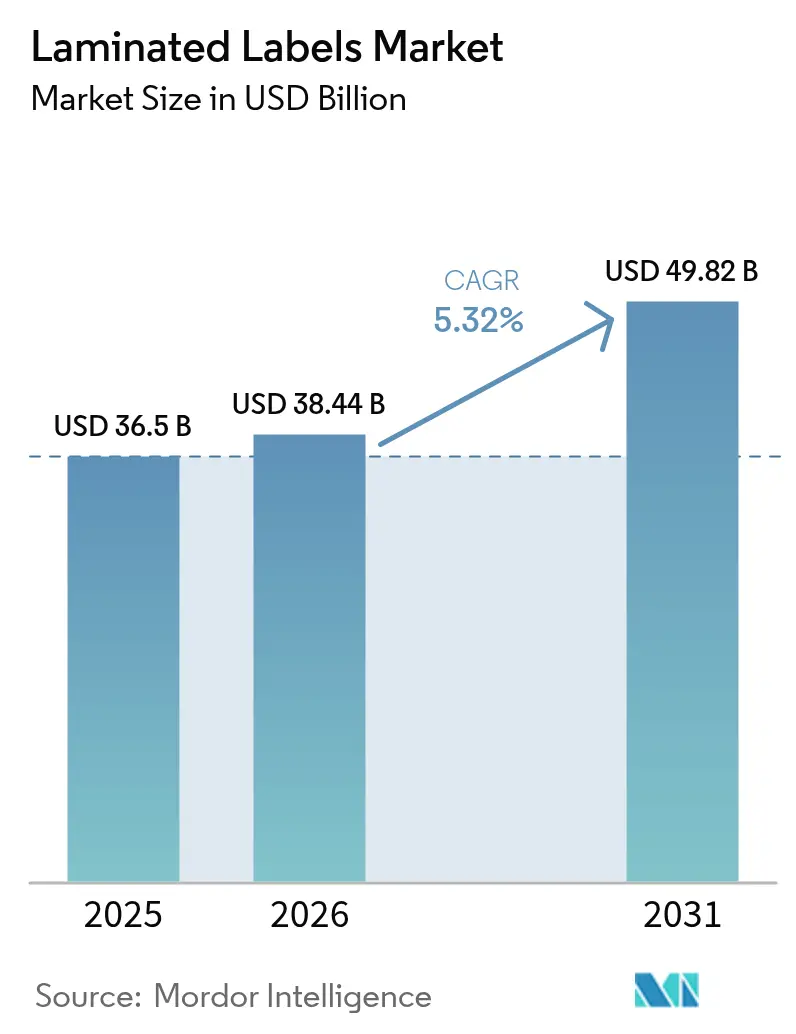
laminated label market size in 2026 is estimated at USD 38.44 billion, growing from 2025 value of USD 36.5 billion with 2031 projections showing USD 49.82 billion, growing at 5.32% CAGR over 2026-2031. Rising e-commerce shipping volumes, tougher food‐safety codes, and pharmaceutical serialization mandates are expanding the laminated label market, even as packaging rules tighten around recyclability and carbon disclosures. Demand for durable facestocks that endure automated sortation, together with linerless formats that reduce waste, is widening profit margins for converters that can supply high-performance, regulation-compliant products. Polyester retains the largest material slice, yet polypropylene’s lower cost and printability are lifting its uptake in food and beverage lines. Regionally, Asia-Pacific enjoys scale advantages, while North America is moving fastest on premium, regulation-driven applications.
Key Report Takeaways
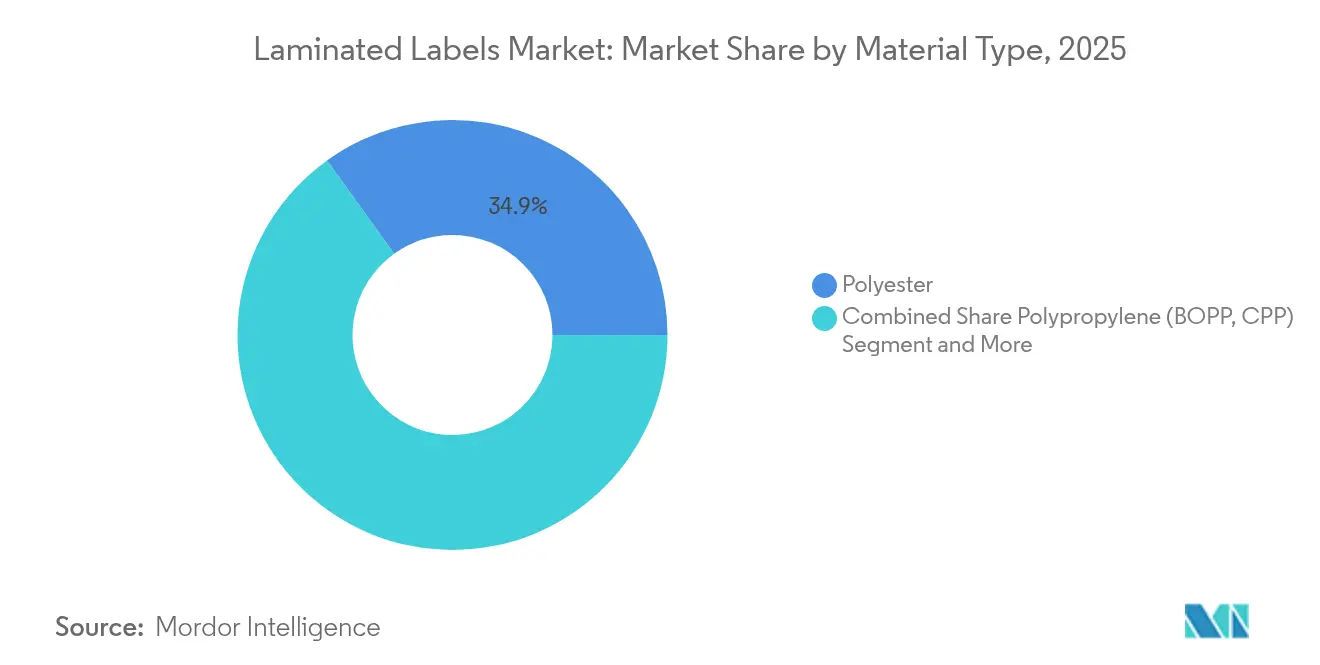
- By material type, polyester led with 34.92% laminated label market share in 2025; polypropylene is projected to expand at a 7.12% CAGR to 2031.
- By form, roll labels commanded 57.88% of the laminated label market size in 2025, while sheet labels are set for 6.28% CAGR through 2031.
- By composition, facestocks held 44.97% share of the laminated label market size in 2025; adhesives are advancing at a 6.83% CAGR.
- By printing technology, flexography led with 32.66% revenue share in 2025; ink-jet is the fastest-growing segment at an 8.44% CAGR.
- By end-user industry, food and beverage accounted for 34.35% of the laminated label market in 2025, whereas healthcare is pacing at an 7.63% CAGR.
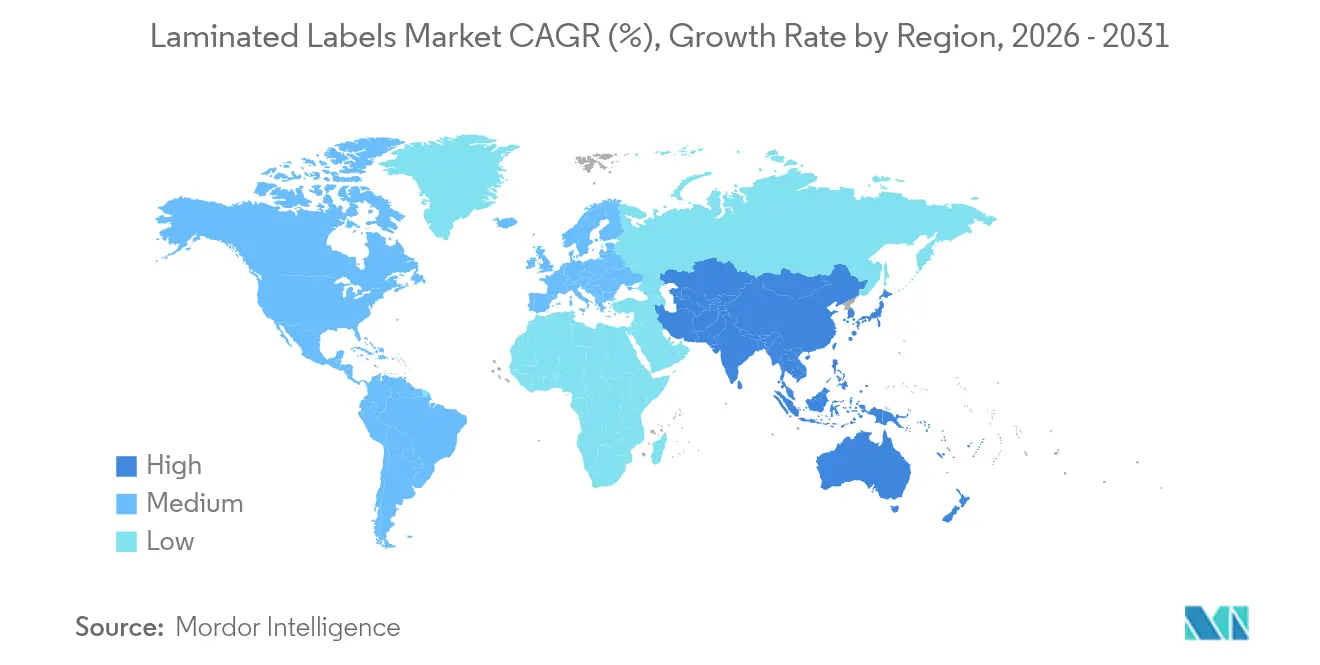
- By geography, Asia-Pacific controlled 40.98% of the laminated label market in 2025; North America is progressing at an 7.95% CAGR.
Note: Market size and forecast figures in this report are generated using Mordor Intelligence’s proprietary estimation framework, updated with the latest available data and insights as of 2026.
Market Trends and Insights
Drivers Impact Analysis of Laminated Labels Market*
| Driver | (~) % Impact on CAGR Forecast | Geographic Relevance | Impact Timeline |
|---|---|---|---|
| E-commerce boom driving durable shipping labels | +1.2% | Global, concentrated in North America & APAC | Short term (≤ 2 years) |
| Packaged food and beverage demand surge | +1.5% | Global, led by Asia-Pacific | Medium term (2-4 years) |
| Pharmaceutical serialization mandates | +0.9% | North America & EU, expanding to APAC | Long term (≥ 4 years) |
| Linerless laminated labels adoption | +0.7% | Europe & North America early adoption | Medium term (2-4 years) |
| Carbon-footprint disclosure labels | +0.5% | EU primary, North America secondary | Long term (≥ 4 years) |
| Source: Mordor Intelligence | |||
E-commerce boom driving durable shipping labels
Surging online retail volumes have pushed parcel handling intensity up by more than 60%, exposing ordinary labels to temperature swings and mechanical shocks that cause delamination. ASTM D4169-22 now requires sequential hazard testing, prompting converters to engineer substrates that stay bonded to corrugate throughout distribution cycles.[1]International Safe Transit Association, “Process Standards,” ista.org Sustainability goals add a removal-cleanly prerequisite so that labels do not disrupt fiber recycling streams. Linerless rolls such as OptiCut WashOff increase label yield by 50% and slash transport emissions, attracting logistics operators that track Scope 3 footprints. Converters report 15-20% higher margins on e-commerce-specific constructions, while digital print lets shippers embed real-time codes for tracking and returns management.
Packaged food and beverage demand surge
Urban lifestyles and single-serve preferences are lifting packaged food volumes, with India’s packaging spend growing at 26.7% CAGR as brands court rising middle-class consumers.[2] Cosmo Films, “What Is Metalized Film and Its Different Types,” cosmofilms.com India’s FSSAI now bans toluene in food-contact inks, pushing label makers toward low-migration chemistries and rigorous migration testing. Premium snack and beverage lines want metalized pressure-sensitive films that give brighter shelf appeal and barrier protection. Paper-based laminates from partnerships such as Saica-Mondelez target a 25% virgin-plastic cutback without losing heat-sealability. Regional supply diversification, especially within Asia-Pacific, is mitigating disruption risks and stimulating new local capacity additions.
Pharmaceutical serialization mandates
The Drug Supply Chain Security Act obliges U.S. prescription packs to carry unique numerical identifiers plus scannable barcodes under 21 CFR 201.25.[3]Food and Drug Administration, “21 CFR 201.25 — Bar Code Label Requirements,” ecfr.gov Europe’s parallel device-identification rules further require tamper-evident features, boosting demand for high-security laminated formats. Serial coding accuracy has elevated digital ink-jet adoption because variable data must print at production speed without smearing. Sustainability adds another layer: drug firms now favor recyclable facestocks that still accept covert inks and holographic foils. Global adoption of GS1 standards is steering multinational pharma toward suppliers that hold international regulatory know-how and multi-plant redundancy.
Linerless laminated labels adoption
Waste-reduction mandates in Europe and North America are accelerating linerless uptake. Avery Dennison’s AD LinrSave yields as many as 80% more labels per roll and trims CO₂ by 30%. Foodservice operators value the lower roll-change frequency, while parcel hubs appreciate the lighter cores that cut shipping costs. Production, however, needs precise silicone and adhesive lay-downs to stop printer jam-ups, and legacy print-and-apply lines often require retrofits. Equipment specialists now market purpose-built applicators to handle tension and feed alignment. Brands with corporate zero-waste pledges willingly pay premiums for the reduced environmental footprint.
Restraints Impact Analysis of Laminated Labels Market*
| Restraint | (~) % Impact on CAGR Forecast | Geographic Relevance | Impact Timeline |
|---|---|---|---|
| Raw-material price volatility | -1.8% | Global, acute in petrochemical-dependent regions | Short term (≤ 2 years) |
| Shift to metallized foils and shrink sleeves | -0.9% | North America and Europe premium segments | Medium term (2-4 years) |
| Solvent-borne ink and adhesive regulation | -0.7% | North America and EU primary, expanding globally | Medium term (2-4 years) |
| Closed-loop paper packs eliminating plastic labels | -0.4% | Europe primary, North America secondary | Long term (≥ 4 years) |
| Source: Mordor Intelligence | |||
Raw-material price volatility
Propylene feedstock is forecast to top 40 cents/lb by mid-2025 following refinery rationalizations, raising polyester and polypropylene film costs. December 2024 contracts already traded at 35.75 cents, telegraphing lasting inflation into 2026. Brady Corporation disclosed raw-material spikes as a chief drag on FY 2024 margins. Converters are exploring recycled or bio-based resins, yet volumes remain low and premiums high. Multi-supplier strategies and regional inventory buffers are becoming standard risk-management playbooks.
Shift to metallized foils and shrink sleeves
Premium beverage and personal-care brands are migrating from traditional laminated labels toward 360-degree shrink sleeves that contour complex bottles and deliver high-gloss graphics. Shrink films now reach 65% free-shrink at 90 °C while keeping clarity during PET recycling. As economies of scale advance, cost gaps with pressure-sensitives are narrowing, pressuring label volumes in certain high-turn categories. EU recycling targets that prefer mono-material solutions may further tilt packaging buyers toward foils or sleeves that integrate directly into container recovery streams. Digital presses able to print on shrink film strengthen the substitution threat by enabling batch-level customization once unique to labels.
*Our forecasts treat driver/restraint impacts as directional, not additive. The impact forecasts reflect baseline growth, mix effects, and variable interactions.
Laminated Labels Market Segment Analysis
By Material Type:
Polyester pre-eminent yet polypropylene risingPolyester delivered the largest slice of the laminated label market at 34.92% in 2025 thanks to chemical resistance vital for pharma, chemical drum, and outdoor-exposure uses. Polypropylene’s 7.12% CAGR through 2031 reflects food and beverage converters embracing its lower density, higher yield, and smoother print surface. EU rules dictating 30% recycled PET in packaging by 2030 are pushing buyers to recycled PET facestocks, though supply lags demand and prices remain elevated. Vinyl continues to decline amid REACH microplastics curbs. Bio-films are a niche today but attract brands pursuing compostable or bio-sourced messaging.
Looking ahead, recycled content mandates should tighten polyester’s availability and buoy prices, possibly accelerating polypropylene’s replacement rate in cost-sensitive SKUs. Simultaneously, R&D around bio-based PET and chemically recycled resins promises future volumes once scale materializes. Suppliers that can qualify recycled inputs without sacrificing clarity or stiffness will seize share as the laminated label market rewards low-carbon footprints.



By Form:
Rolls keep speed edge while sheets cater to customizationRoll configurations dominated 57.88% of laminated label market share in 2025 because automated applicators in beverages, pharmaceuticals, and logistics depend on continuous web feeds. Sheet labels, though only 42.12%, clock a 6.28% CAGR on the back of digital presses that handle short runs for craft food, cosmetics, and seasonal campaigns. Automatic splicing systems like Unisplice 413 raised line uptime by 10%, reinforcing rolls’ productivity advantage.
Sheets, however, let brand owners vary artwork across multiple SKUs without tooling, cutting inventory waste. As e-commerce microbrands proliferate, sheet demand will intensify for orders under 1,000 units where flexo setup costs are untenable. Linerless technology reinforces rolls’ appeal, yet printer retrofits required for butt-cut webs may limit adoption to large fleet owners initially.
By Composition:
Facestocks lead, adhesives innovate fastestFacestock layers accounted for 44.97% of laminated label market revenue in 2025 because substrate choice governs durability, print fidelity, and aesthetics. Adhesives, while a smaller base, are accelerating at 6.83% CAGR as water-borne, UV, and solvent-free chemistries replace N-Methylpyrrolidone formulas now under EPA scrutiny. Release-liner redesigns aim at recyclability, with FINAT’s goal of 75% liner recovery by 2025 spurring interest in glassine take-back schemes.
Growth in adhesives derives from specialty grades: removable systems for reuse loops, high-heat variants for automotive, and wash-off versions that separate cleanly in PET float-sink tanks. Integrated product bundles are emerging where converters co-optimize facestock, adhesive, and liner for a given end use, locking in customer loyalty and margin.
By Printing Technology:
Flexo dominates but digital races aheadFlexographic presses preserved 32.66% laminated label market share in 2025 as beverage, personal-care, and logistics lines rely on high-speed, low-unit-cost output. Ink-jet systems are outgrowing all rivals at 8.44% CAGR because variable data, SKU proliferation, and just-in-time fulfillment favor tool-less changeovers. Electrophotography keeps a foothold where toner opacity and color precision justify cost, such as wine and cosmetics.
Hybrid lines marrying flexo decks with digital bars are scaling because brand owners need spot varnish and metallics alongside serialized codes. Gravure and offset retreat in medium runs where digital breakevens now sit around 5,000 linear meters. Screen printing clings to niche security and tactile-varnish jobs that ink-jet cannot yet replicate at speed.

By End-User Industry:
Food rules, healthcare acceleratesFood and beverage captured 34.35% of the laminated label market in 2025, propelled by ingredient transparency laws and export traceability requirements. Saica-Mondelez’s paper transformation underscores how brands pair sustainability with shelf life. Pharmaceuticals post the quickest 7.63% CAGR as DSCSA and EU FMD serialization timelines demand tamper-proof, high-resolution codes. Industrial and electronics labels rely on chemical and heat endurance, while personal care adopts premium foils for brand impact. Logistics labels benefit directly from e-commerce throughput. Over the forecast, healthcare’s security premium plus expanding biologics pipelines make it the pivotal growth lever, but food remains volume anchor.
Geography Analysis
APAC Laminated Labels Market
Asia-Pacific held 40.98% of the laminated label market in 2025, buoyed by China’s 6% industrial output rise and 12.7% jump in chemical manufacturing that secures film feedstocks. India’s production-linked incentives aim for 25% GDP contribution from advanced manufacturing by 2025, enlarging domestic demand and export capacity. Multinationals such as Amcor added Gujarat capacity to serve regional snack and personal-care brands, confirming the region’s scale and cost edge. Japan and South Korea contribute high-precision coating know-how, whereas Southeast Asia gains from supply-chain diversification.
North America Laminated Labels Market
North America, projected at an 7.95% CAGR, is propelled by DSCSA serialization, EPA solvent regulations, and rapid parcel-shipping growth. ASTM shipping standards and consumer preference for premium graphics position the region for value-added volumes. Mexico’s role in near-shoring strengthens, illustrated by ProMach’s Etiflex acquisition that expands RFID and variable-data offerings.
Europe Laminated Labels Market
Europe maintains regulatory leadership through the Packaging and Packaging Waste Regulation, obliging full recyclability by 2028 and recycled-content thresholds that reshape material menus. FINAT’s liner recycling drive and Germany’s plant-based-ink transition underscore sustainability as the prime competitive lever. Eastern Europe may attract new coating lines as Western converters seek low-cost yet EU-compliant production bases.
MEA and South America Laminated Labels Market
Middle East & Africa and South America together form a smaller slice of the laminated label market but register brisk uptake as food-processing and agro-exporters adopt traceability stickers. Infrastructure gaps and currency swings restrain scale for now, though localized manufacturing might rise as governments court investment to cut import dependence.

Regulatory Landscape
In Europe, the Packaging and Packaging Waste Regulation (PPWR), Regulation (EU) 2025/40, entered into force on 11 February 2025 and carries a general application date of 12 August 2026. This timeline sets the focus for near-term compliance work for laminated label constructions used on packaging, particularly where design-for-recyclability and material choices determine whether labeled packs can meet recyclability requirements and extended producer responsibility obligations.
For food-contact applications, chemical-compliance requirements for laminates, adhesives, and inks continue to tighten. In February 2026, the European Commission adopted Commission Regulation (EU) 2026/245 to amend Annex I of Regulation (EU) No 10/2011, updating the Union list of authorized substances for plastic food-contact materials, which affects raw material selection for laminated label structures used on packaged foods. In the United States, FDA oversight for laminate structures used in food contact includes 21 CFR 177.1395, which sets conditions of safe use and relevant limits for laminated structures bonded with adhesives or formed by extrusion or coextrusion, shaping qualification and documentation practices for converters supplying food and beverage end users.
Competitive Landscape
The laminated label market exhibits fragmentation. Avery Dennison posted USD 8.8 billion revenue in 2024 and pushes linerless innovation that cuts CO₂ 30% and water 40%. CCL Industries generated USD 7.245 billion and deepened RFID and specialty film positions through bolt-ons. UPM Raflatac led carbon-footprint disclosure, embedding product LCA data in quotations.
Acquisition momentum signals consolidation: TOPPAN agreed to pay USD 1.8 billion for Sonoco’s thermoformed and flexible unit, expanding into integrated packs. Private-equity owner One Rock closed Constantia Flexibles to build a global platform in films and laminates. Technology entrants focus on hybrid presses and intelligent labels; legacy players answer by licensing patents or forming joint ventures to defend share.
White-space arenas include carbon disclosure labels, security overlays for biologics, and liner-free shipping solutions. Patent filings around covert taggants and high-speed ink deliver proof of sustained R&D. Regional specialists thrive by customizing adhesives for local climates or navigating country-specific food-contact rules. Overall, competition hinges on sustainability credentials, digital capability, and global service coverage.
Laminated Labels Industry Leaders
Avery Dennison Corporation
Coveris Holdings S.A.
CCL Industries Inc.
Constantia Flexibles Group GmbH
3M Company
- *Disclaimer: Major Players sorted in no particular order
Laminated Labels Market Companies Covered in this Report
- Avery Dennison Corporation
- CCL Industries Inc.
- 3M Company
- Coveris Holdings S.A.
- Torraspapel Adestor
- Constantia Flexibles Group GmbH
- R.R. Donnelley & Sons Company
- Flexcon Company Inc.
- Stickythings Ltd.
- Gipako Ltd.
- Hub Labels Inc.
- Cenveo Corporation
- Ravenwood Packaging Ltd.
- Reflex Labels Ltd.
- UPM Raflatac Oy
- Amcor plc
- Multi-Color Corporation
- Fuji Seal International Inc.
- SATO Holdings Corp.
- Lintec Corporation
- Zebra Technologies Corp.
- Brady Corporation

Market Opportunities and Future Outlook
One whitespace is recyclable-by-design laminated label solutions that maintain durable performance while fitting end-of-life pathways, especially as the EU PPWR approaches its 12 August 2026 general application date. Material and adhesive suppliers are already commercializing offerings aimed at mechanical recycling, including UPM Adhesive Materials ProCycle wash-off adhesive technologies (May 2026) and Toyochem making alkali-soluble hot-melt adhesives for roll labels (April 2026), which give converters practical options to build PET-friendly and mono-material label constructions without slowing application.
Another opportunity area is production modernization as brands add more SKUs, increase variable data, and maintain tighter compliance records. Equipment and ink platforms introduced in 2026, including BOBSTs FLEXJET module with Thalia UV Digital Inks for solvent-free, single-pass digital multilayer and glue-side printed labels (May 2026) and Domino Printings hybrid deployment with LP2i for multi-layer extended content labels using adhesive-side printing (April 2026), support higher-complexity jobs with fewer process steps. These developments point to demand for laminated labels that combine protection layers, security or traceability content, and faster changeovers, favoring suppliers that can qualify complete constructions (facestock, adhesive, liner, and overlaminate) for regulated food, pharmaceutical, retail, and logistics workflows.
Recent Industry Developments in Laminated Labels Market
- July 2026: Avery Dennison announced that its AD CleanFlake RFID tags received first-to-market RecyClass Technology Approval for PET bottle recyclability. The approval links intelligent labeling with recyclability requirements, supporting adoption of RFID-enabled laminated label solutions where brand owners need both traceability and compatibility with PET recycling streams.
- July 2025: UPM expanded North American label capacity with new coating technology at its Mills River site. The added capability strengthens regional supply resilience for pressure-sensitive materials and helps shorten lead times for converters serving high-throughput food, beverage, and logistics applications.
- October 2024: UPM Raflatac launched OptiCut WashOff linerless technology aimed at reusable plastic packaging. The launch addressed both waste reduction (via linerless formats) and improved wash-off performance, supporting circular-packaging workflows where clean label separation is required.


Laminated Labels Market Report Scope and Research Methodology
Market Definition and Coverage
For this study, the laminated labels market is defined as revenue generated from labels that use a laminate layer on top of the printed face material, mainly to improve durability, appearance, and resistance during storage, shipping, and end use.
Scope exclusions: Excludes non-laminated label formats and decoration solutions that do not use a laminate layer on the label construction.
Segments Covered in This Report
- By Material Type
- Polyester
- Polypropylene (BOPP, CPP)
- Vinyl
- Biodegradable Films
- Other Material Type
- By Form
- Rolls
- Sheets
- By Composition
- Facestock
- Adhesive
- Release Liner
- By Printing Technology
- Flexographic
- Digital - Ink-jet
- Digital - Electrophotography
- Gravure
- Offset
- Screen / Letterpress
- By End-user Industry
- Food and Beverage
- Manufacturing and Industrial
- Electronics and Appliances
- Pharmaceuticals and Healthcare
- Personal Care and Cosmetics
- Retail and Logistics
- Other End-user Industry
- By Geography
- North America
- United States
- Canada
- Mexico
- Europe
- Germany
- France
- Italy
- Spain
- United Kingdom
- Russia
- Rest of Europe
- Asia-Pacific
- China
- India
- Japan
- South Korea
- Australia
- Rest of Asia-Pacific
- Middle East and Africa
- Middle East
- Saudi Arabia
- United Arab Emirates
- Turkey
- Rest of Middle East
- Africa
- South Africa
- Nigeria
- Rest of Africa
- Middle East
- South America
- Brazil
- Argentina
- Rest of South America
- North America
Data Sources, Market Sizing, and Validation
Desk Research
Desk research was used to set the market context and to compile base indicators that explain how laminated labels track packaging demand. We reviewed public sources such as the US Census Bureau and Eurostat for packaging and converting activity, UN Comtrade for paper and plastic film trade signals, and the US Bureau of Labor Statistics for inflation and producer price movements that influence label pricing.
To keep the model aligned with actual industry behavior, we also referred to sources such as the FDA for labeling related compliance cues, trade bodies and exhibitions for process updates, and company annual reports and investor presentations for capacity additions and product mix clues. Where needed, we used paid subscriptions for company financials and intelligence, patent databases, and shipment level import-export checks to validate a few assumptions around material flows. The desk sources above are illustrative, and we used additional public and paid references to collect, verify, and clarify data points during the study.
Primary Interviews and Surveys
Primary work was used to pressure test assumptions from desk research and to close gaps on pricing and product mix, which are often missing from public statistics. We spoke with participants across the label value chain, including converters, raw material suppliers (films, papers, and adhesives), and packaging users that buy labels at scale. We also checked whether the inputs reflected demand patterns across major regions before finalizing the model.
Distribution of primary research fieldwork respondents
| Company type | Respondent position | Region |
|---|---|---|
| Top tier: 31% | CXOs: 13% | APAC: 50% |
| Mid tier: 52% | Functional/Unit leaders: 32% | EMEA: 29% |
| Smaller Players: 17% | Managers: 55% | Americas: 21% |
Market-Sizing & Forecasting
Market sizing was built using a top-down and bottom-up approach, where packaging production and trade data were first used to reconstruct the addressable label demand pool, and then the laminated share was applied based on end-use suitability and adoption feedback. The outcome was corroborated using selective bottom-up checks, such as sampled converter revenue reviews, typical price per square meter by substrate, and sanity checks on label consumption per unit of packaged output.
Key inputs in the model included packaged food and beverage output trends, pharma and personal care shipment growth, the split of pressure-sensitive versus other label formats, laminate film and paper price movement, and conversion rates between volume proxies and revenue (keeping currency timing consistent). For the forecast, scenario analysis was used, with base-case growth tied to packaged goods output and premium labeling uptake, and then adjusted using expert views on sustainability related material shifts and printing technology adoption. Where bottom-up signals were patchy in smaller countries, we used regional ratios anchored to trade and production indicators, and we applied conservative bands that were later rechecked through interviews.
Data Validation & Update Cycle
Outputs were validated through cross-checks against independent signals, including packaging output growth, trade movement in key face stocks and laminate films, and observed price changes for label materials. If a country-level result looked inconsistent with these signals, the assumptions were reopened, and respondents were re-contacted to confirm whether the driver reflected a real market change or a modeling issue.
Before sign-off, the full model goes through multiple analyst reviews, including formula checks, unit consistency checks, and variance explanations at region and end-use levels. The report is refreshed annually, and interim updates are made when major events occur, including sharp raw material price swings, regulatory shifts affecting packaging labels, or notable capacity changes. Before delivery, a final pass is done so the client receives the latest updated view available.
Mordor Intelligence's Laminated Labels Market Size Versus Other Published Estimates
Published market values for laminated labels can differ even when the growth story sounds similar, mainly because teams choose different scopes and then apply different pricing and conversion assumptions. Differences also come from how each model translates packaging activity into label demand, and how aggressively the forecast case is set.
The main gap comes from whether laminate films, facestock, and adhesive layers are all counted inside the same revenue pool. Mordor Intelligence counts only laminated label revenues at the converter and brand-facing sale level, instead of adding adjacent material-only sales that can inflate totals. Other variations typically come from the year used for currency conversion, how price escalation is handled across film and paper, and whether fast-growth end uses are given higher adoption rates without enough interview validation.
Benchmark comparison
| Source | Market Size | Gaps in Research Methodology |
|---|---|---|
| Mordor Intelligence | USD 38.44 B (2026) | |
| Industry Research Publisher A | USD 37.32 B (2025) | Uses a different base year and can understate the 2026 value if price escalation and currency timing are not harmonized, and the scope detail on what is counted as label revenue versus materials is not always explicit. |
| Industry Research Publisher B | USD 37.06 B (2025) | Uses 2025 as the anchor year and a longer forecast window, and the spread can come from different assumptions on laminated share by end use and how fast premium label uptake is applied across regions. |
The table shows that much of the spread is explained by year alignment and what gets counted inside the revenue pool, followed by how quickly laminated penetration is assumed to rise in packaged goods and regulated end uses. By keeping the demand pool tied to packaging output signals and then verifying adoption and pricing assumptions with industry feedback, we get a practical number that can be traced back to clear, repeatable steps.


Key Questions Answered in the Report
What is the current size of the laminated label market?
The laminated label market size reached USD 38.44 billion in 2026 and is projected to climb to USD 49.82 billion by 2031.
Which region is growing fastest in the laminated label market?
North America shows the highest growth, registering an 7.95% CAGR to 2031 due to stringent serialization laws and premium packaging demand.
Why are linerless laminated labels gaining traction?
They provide up to 80% more labels per roll, lower CO₂ emissions about 30%, and cut disposal costs, making them attractive for logistics and foodservice users.
What material is most used in laminated labels today?
Polyester leads with 34.92% market share because of its chemical resistance and dimensional stability.
Page last updated on:





