Thermal Printing Market Size and Share
Market Overview
| Study Period | 2020 - 2031 |
|---|---|
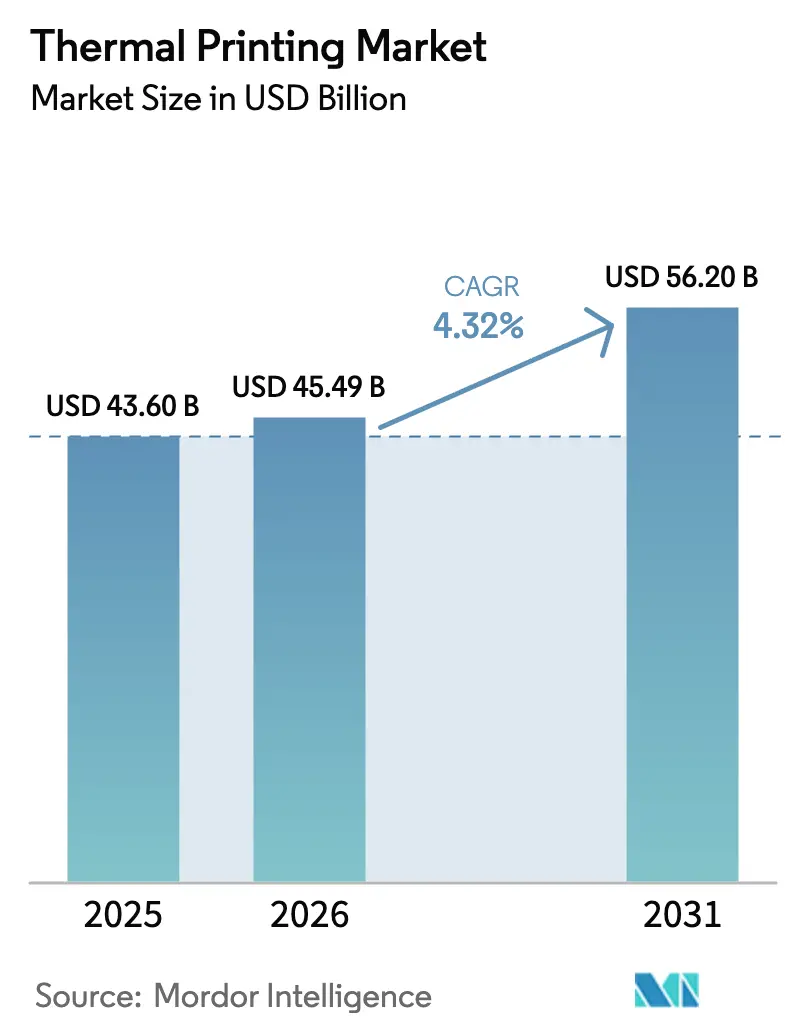
| Market Size (2026) | USD 45.49 Billion |
| Market Size (2031) | USD 56.20 Billion |
| Growth Rate (2026 - 2031) | 4.32% CAGR |
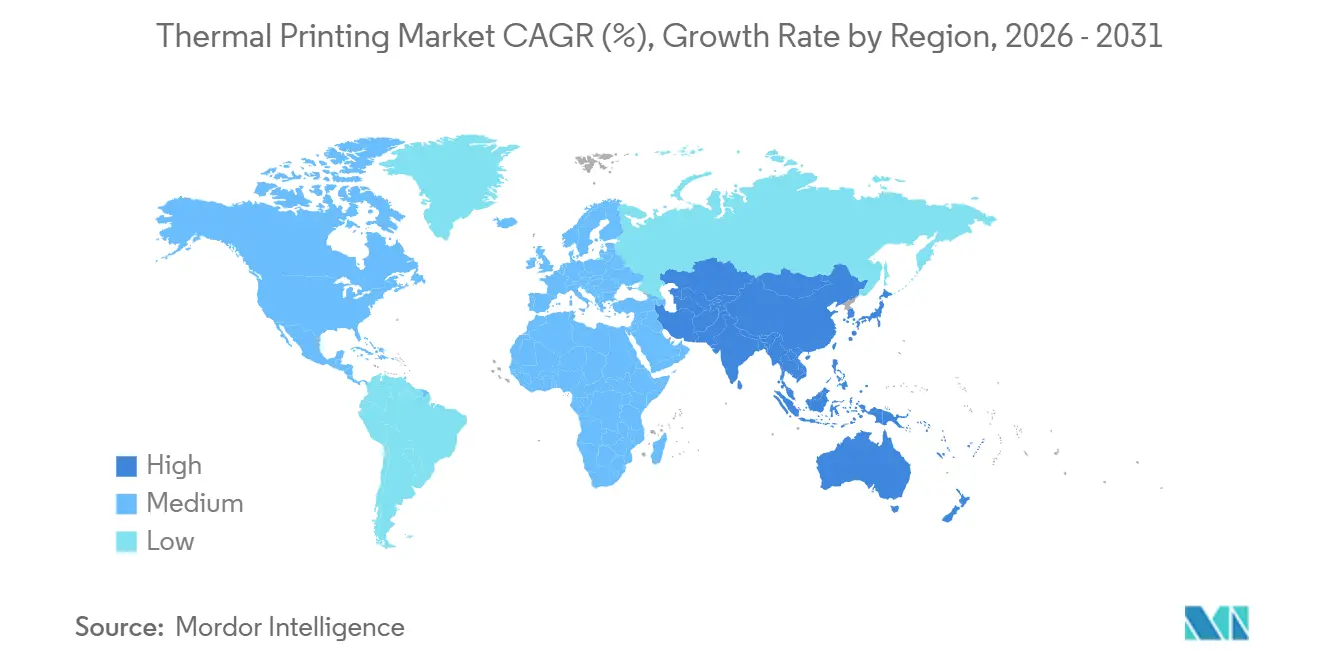
| Fastest Growing Market | Asia Pacific |
| Largest Market | North America |
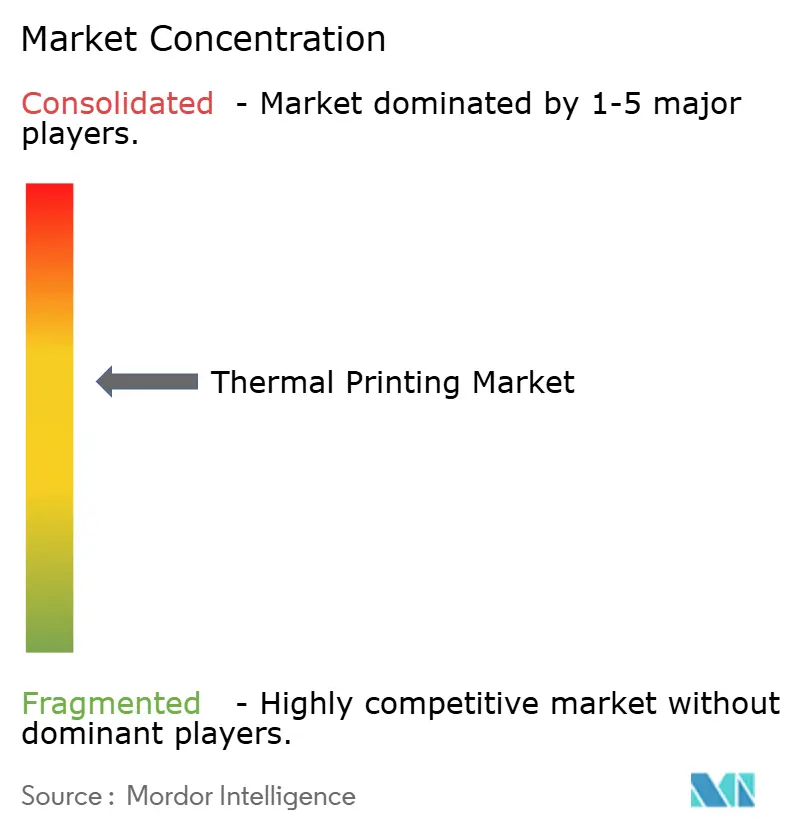
| Market Concentration | Medium |
Major Players *Disclaimer: Major Players sorted in no particular order Image © Mordor Intelligence. Reuse requires attribution under CC BY 4.0. | |
Thermal Printing Market Analysis by Mordor Intelligence
The thermal printing market is valued at USD 45.49 billion in 2026 and is projected to reach USD 56.20 billion by 2031, advancing at a 4.32% CAGR, underscoring steady growth in market size and demand for mobile and linerless solutions. Growth reflects rising parcel volumes, regulatory shifts toward electronic receipts, and sustained advantages in total cost of ownership over inkjet and laser alternatives. Wireless mobile printers continue to penetrate field-service and last-mile workflows, while phenol-free and linerless media are lowering switching costs and inviting new entrants. Investments in predictive maintenance algorithms that curtail unplanned downtime, together with expanding cold-chain logistics for biologics, are opening premium revenue streams. Geographic momentum is rebasing toward Asia Pacific, where fulfillment infrastructure and mobile point-of-sale deployments are scaling more rapidly than replacement cycles in North America and Europe.
Key Report Takeaways
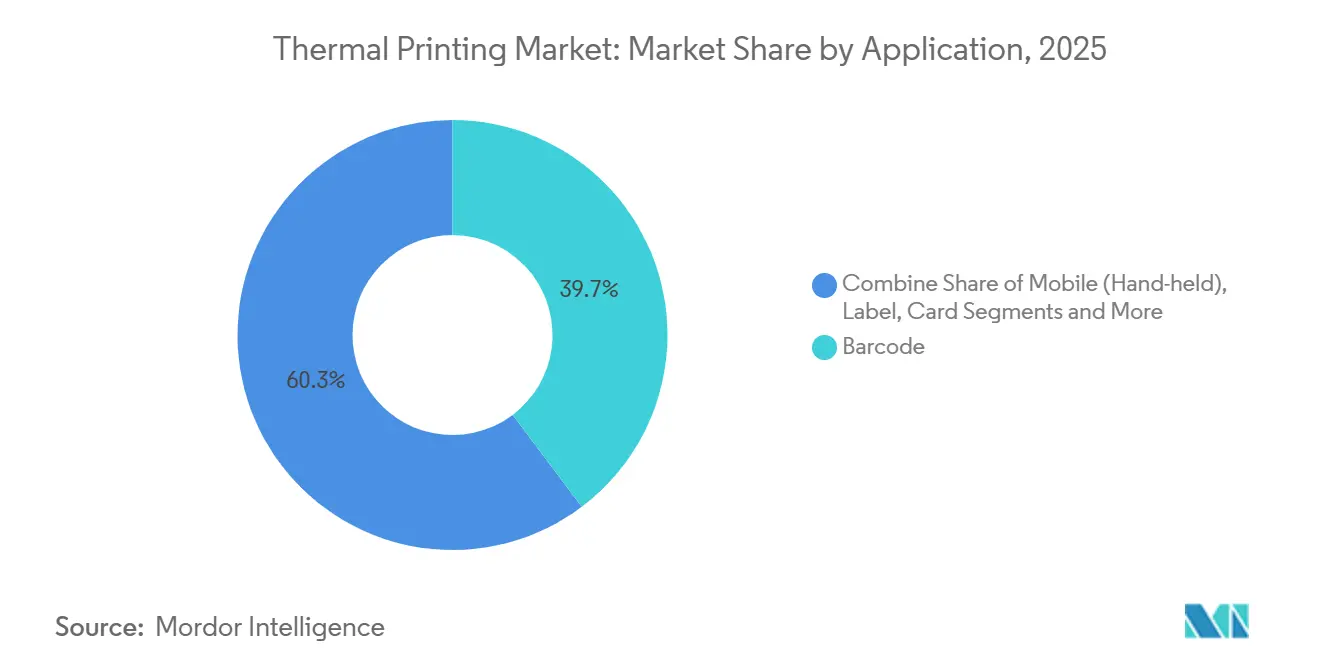
- By application, barcode printing led with a 39.73% revenue share in 2025 in the thermal printing market, while mobile handheld printers are set to record the fastest growth at a 5.06% CAGR through 2031.
- By printing technology, direct thermal held 51.74% of thermal printing market share in 2025, whereas thermal transfer is forecast to expand at a 5.65% CAGR over the same horizon.
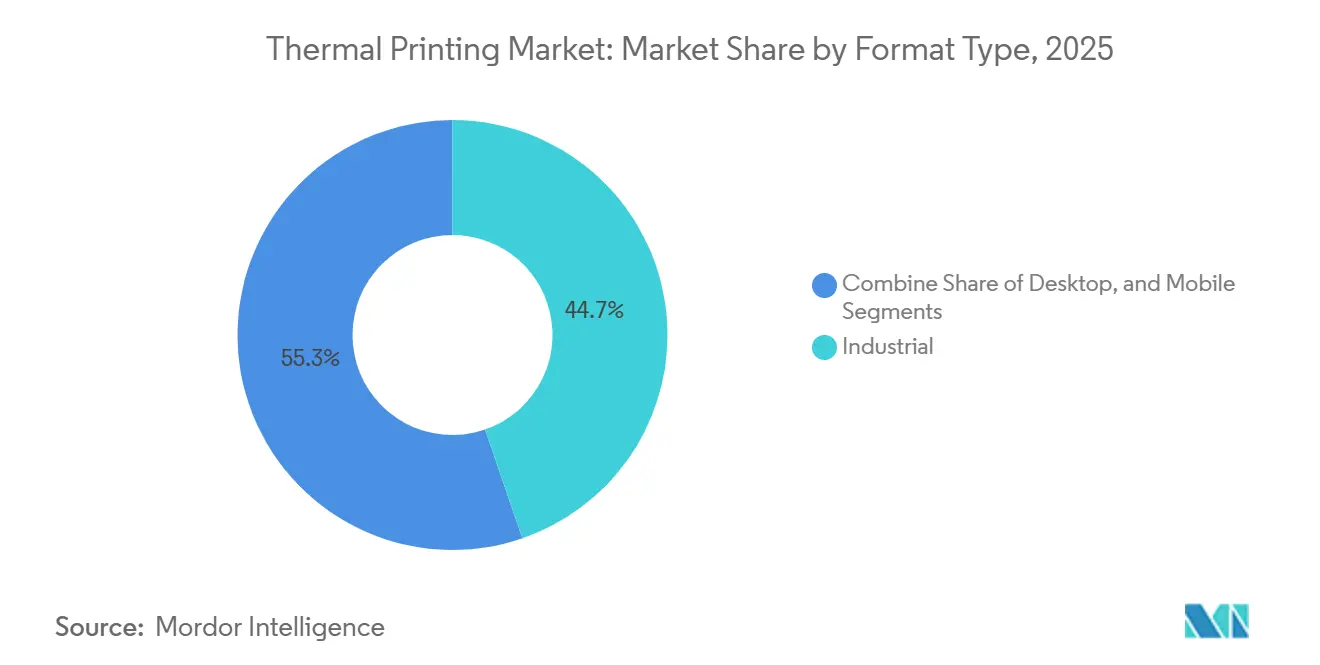
- By format, industrial printers accounted for 44.73% of thermal printing market size in 2025, yet mobile printers are poised to grow at a 5.45% CAGR to 2031.
- By end-use, retail and e-commerce dominated with 52.83% in 2025 in the thermal printing market, while healthcare is projected to rise at a 5.87% CAGR through 2031.
- By region, North America contributed 38.73% to revenue in 2025 in the thermal printing market, whereas Asia Pacific is on track for a 5.62% CAGR, reflecting robust investments in logistics networks.
Note: Market size and forecast figures in this report are generated using Mordor Intelligence’s proprietary estimation framework, updated with the latest available data and insights as of January 2026.
Global Thermal Printing Market Trends and Insights
Drivers Impact Analysis*
| Driver | (~) % Impact on CAGR Forecast | Geographic Relevance | Impact Timeline |
|---|---|---|---|
| E-commerce logistics boom fuels barcode and shipping-label volumes | +1.2% | Global, with concentration in North America, Europe, and Asia Pacific e-commerce hubs | Medium term (2-4 years) |
| Rapid adoption of wireless/mobile printers in field and last-mile ops | +0.9% | Global, particularly Asia Pacific and North America last-mile delivery networks | Short term (≤ 2 years) |
| Lower TCO versus inkjet/laser for high-volume label and receipt jobs | +0.7% | Global, strongest in Retail and E-commerce, Transportation and Logistics sectors | Long term (≥ 4 years) |
| Surge in cold-chain IoT sensors requiring on-demand frost-resistant labels | +0.6% | North America and Europe pharmaceutical cold-chain corridors, expanding to Asia Pacific | Medium term (2-4 years) |
| Rise of phenol-free, liner-less media to meet ESG scorecards | +0.5% | Europe and North America, driven by corporate sustainability mandates | Medium term (2-4 years) |
| Embedded AI diagnostics reducing print-head downtime in 24/7 fulfilment hubs | +0.4% | North America and Europe large-scale fulfillment centers, early adoption in Asia Pacific | Long term (≥ 4 years) |
| Source: Mordor Intelligence | |||
E-Commerce Logistics Boom Fuels Barcode and Shipping-Label Volumes
Parcel growth tied to cross-border digital commerce is directly lifting thermal label consumption. Express carriers enforce GS1-compliant formats that must be printed on demand, prompting small merchants to adopt desktop direct thermal units that bring per-label costs below USD 0.01.[1]UPS, “GS1 Barcode Compliance Requirements for Automated Sortation,” ups.com Omnichannel fulfillment strategies decentralize printing across micro-warehouses, multiplying consumables revenue for original-equipment manufacturers by having every node regularly replenish media and printheads. Manufacturers respond with Ethernet- and Wi-Fi-enabled printers that can be centrally queued, ensuring real-time label flow at each dock door. The compounding effect of rising parcel counts and distributed printing nodes positions shipping labels as a durable volume anchor for the thermal printing market.
Rapid Adoption of Wireless/Mobile Printers in Field and Last-Mile Operations
Bluetooth Low Energy and Wi-Fi Direct protocols have removed the need for fixed access points, making mobile printers indispensable for delivery agents, nurses, and service technicians. Brother’s RJ2150 RuggedJet 2 prints 1,100 two-inch labels per charge and meets IP54 and MIL-STD-810G durability standards.[2]Brother Industries Ltd., “RJ2150 RuggedJet 2 Mobile Printer Specifications,” brother-usa.com BIXOLON extends portability to healthcare with wipe-disinfectant certification, allowing bedside wristband printing that cuts transcription errors.[3]BIXOLON Co., “XD5-40IId Healthcare Mobile Printer,” bixolon.com Cloud label design apps let users modify templates on smartphones, reducing IT bottlenecks and shortening deployment cycles. As fleets grow, OEMs secure new annuity streams in batteries, chargers, and durable media optimized for mobile environments, deepening overall thermal printing market penetration.
Lower Total Cost of Ownership Versus Inkjet/Laser for High-Volume Jobs
Direct-thermal printers eliminate toner, fusers, and developers, bringing total print costs down to roughly USD 0.005 per 4 x 6-inch label compared with USD 0.03 for similar inkjet output. Industrial thermal-transfer models add a ribbon yet remain cheaper over five years due to lower energy draw and fewer consumables than laser peers. Honeywell’s PM45 allows on-site printhead swaps in under 10 minutes, preventing downtime losses that can exceed USD 5,000 per hour in automated fulfillment centers. The simplicity of the technology demands little operator training, a critical edge as warehouse labor costs climb. These economics reinforce the appeal of the thermal printing market to organizations processing tens of thousands of labels each shift.
Surge in Cold-Chain IoT Sensors Requiring On-Demand Frost-Resistant Labels
Biologic drugs and vaccines travel within tight temperature bands, and each parcel now embeds IoT sensors that transmit telemetry. TOPPAN’s temperature-logger label combines an integrated battery and sensor, requiring unique serialization at the final distribution node. Sensos offers a cellular smart label relaying GPS and temperature data every 15 minutes, necessitating just-in-time encoding of shipment parameters. Compliance regimes such as the European Good Distribution Practice rule mandate traceability for every item, driving adoption of industrial thermal-transfer units that incorporate RFID modules. Cold-chain requirements, though a smaller slice of current demand, command premium pricing and lift the average selling price within the overall thermal printing market.
Restraints Impact Analysis*
| Restraint | (~) % Impact on CAGR Forecast | Geographic Relevance | Impact Timeline |
|---|---|---|---|
| High maintenance and print-head replacement costs | -0.8% | Global, particularly acute in Industrial format segment with 24/7 operations | Short term (≤ 2 years) |
| RFID tags and e-receipts displacing some thermal applications | -0.6% | Europe and North America retail, expanding to Asia Pacific urban centers | Medium term (2-4 years) |
| Phenol/BPA regulations inflating specialty-paper input costs | -0.4% | Europe and North America, driven by REACH and FDA compliance requirements | Long term (≥ 4 years) |
| Pulp-price volatility disrupting global label-stock supply | -0.3% | Global, with acute impact in regions dependent on imported paper stocks | Short term (≤ 2 years) |
| Source: Mordor Intelligence | |||
High Maintenance and Print-Head Replacement Costs
Industrial printheads cost USD 400-1,200 and last 30-60 kilometers of media. Fulfillment centers running 50,000 labels daily face replacements every six to twelve months, sometimes exceeding the printer’s purchase price. Proprietary interfaces prevent interchangeability, keeping prices high and locking buyers into single-vendor ecosystems. Canon’s predictive lifespan model shows accelerated degradation under high-duty-cycle conditions, making accurate failure timing difficult to predict. While preventive swaps curb downtime, they inflate operating budgets, creating resistance among smaller enterprises and tempering the expansion of the thermal printing market.
RFID Tags and E-Receipts Displacing Some Thermal Applications
Retailers deploying item-level RFID realize inventory accuracy gains without scanning barcodes, reducing the need for printed labels on individual items. Zara and H&M mandate RFID tagging, diminishing barcode volumes in apparel outlets. Simultaneously, European regulations require merchants to issue digital receipts, and surveys show overwhelming consumer support, curbing the use of point-of-sale paper rolls. Printed labels remain necessary for logistics and regulated products, yet displacement trends shave volume growth and require vendors to innovate in durable and intelligent media to safeguard the thermal printing market’s relevance.
*Our forecasts treat driver/restraint impacts as directional, not additive. The impact forecasts reflect baseline growth, mix effects, and variable interactions.
Segment Analysis
By Application: Barcode Usage Anchors Logistics Workflows
Barcode printing commanded 39.73% of 2025 revenue, demonstrating how standardized identifiers underpin fulfillment and inventory operations across commerce and manufacturing. Mobile handheld units add flexibility, expanding at a 5.06% CAGR as drivers and technicians print labels at the point of task, reducing errors and speeding workflows. Point-of-sale and receipt applications remain sizable, but digital receipt mandates in France and Germany are moderating growth. Card printing, dominated by dye-diffusion thermal transfer, supports secure identity issuance for governments and enterprises, while kiosk and ticket printing address transportation and entertainment needs. RFID label printing merges thermal imaging with inlay encoding to satisfy omnichannel tracking requirements, and the diversity of use cases helps stabilize overall demand in the thermal printing market.
Direct thermal simplicity is particularly suited to shipping labels, where images need only remain legible throughout the parcel lifecycle. Thermal transfer dominates asset tagging and outdoor labels that must withstand chemical or ultraviolet exposure. Hybrid applications such as RFID require both printed and encoded data, reinforcing the technology’s centrality in supply-chain visibility. As cold-chain routing, smart-label adoption, and sustainability certifications converge, application-specific media formulations are proliferating, limiting commoditization and sustaining margin dispersion in the thermal printing market.


By Printing Technology: Simplicity Versus Durability Shapes Adoption
Direct thermal held 51.74% share in 2025, favored for receipt and short-lifecycle labels that benefit from ribbon-free economics. Thermal transfer is growing faster, at a 5.65% CAGR, as manufacturers require labels that remain intact for years in harsh environments, driving incremental growth in the thermal printing market in industrial sectors. Dye-diffusion thermal transfer, though niche, secures high-resolution photo ID and payment card applications, with Evolis’ 600 dpi retransfer technology enhancing edge-to-edge image quality.
Technology choice often hinges on lifecycle costs. Direct thermal strips out ribbon spend and lowers maintenance, but suffers image fade under heat or light after several months, limiting use outdoors or in long-term archives. Thermal transfer uses consumable ribbons yet yields prints that remain readable for up to a decade, providing compliance assurance in chemical, electronics, and automotive settings. Toshiba TEC’s dual-mode devices allow users to switch between methods, optimizing expense and durability in mixed-duty environments. Environmental mandates encouraging linerless and phenol-free media further influence technology selection, encouraging continual innovation across the thermal printing market.
By Format Type: Industrial Throughput Meets Mobile Flexibility
Industrial models generated 44.73% revenue in 2025, prized for fast print speeds, metal chassis durability, and high-capacity media that support three-shift operations. Mobile units, however, are scaling fastest, growing 5.45% per year as e-commerce drivers and warehouse pickers demand lightweight, battery-powered tools. Desktop printers bridge retail counters and small fulfillment cells with plug-and-play USB setups under USD 500, ensuring they remain the volume leader in unit terms. SATO’s 600-meter ribbon capacity enables unattended overnight industrial runs.
Presence of mixed fleets is typical, with organizations selecting form factors based on task criticality rather than standardizing on a single category. Brother’s RuggedJet lines demonstrate how shock resistance and sealed housings enable them to withstand construction sites or cold storage, while Star Micronics’ linerless desktop units reduce waste in quick-service restaurants. Such specialization secures niches for new entrants and sustains competitive diversity inside the thermal printing market.
By End-Use Industry: Healthcare and Logistics Drive Specialized Demand
Retail and e-commerce remained the anchor with 52.83% of 2025 revenue, thanks to receipts, shelf labels, and shipping documentation. Healthcare is forecast to grow at 5.87% through 2031 as hospitals implement barcoded patient wristbands and laboratories expand specimen tracking. Transportation operators rely on thermal waybills and pallet tags, while manufacturing lines integrate printers within conveyor systems to label work-in-process. Governments issue secure credentials on dye-sublimation card printers such as HID FARGO’s HDP6600 for motor-vehicle departments.
Diversified demand insulates suppliers from downturns in any single vertical. When hospitality receipts soften, logistics labels often rise. Nevertheless, each sector’s unique compliance and media needs impede cross-segment standardization, preserving specialized product lines and sustaining growth lanes for the thermal printing industry even as individual verticals fluctuate.
Geography Analysis
North America accounted for 38.73% of 2025 revenue, supported by mature logistics infrastructure, mandatory GS1 standards, and government contracts such as the United States Postal Service’s rollout of mobile printers for rural carriers. Canadian retailers are adopting linerless solutions to comply with plastics regulations, and Mexican near-shoring is spurring the installation of industrial printers in new warehouses. RFID uptake and digital receipts temper point-of-sale roll consumption, keeping North American growth muted but steady, thereby safeguarding regional revenue for the thermal printing market.
Asia-Pacific is the fastest-growing territory, projected to grow at a 5.62% CAGR through 2031, driven by surging parcel volumes in China, India’s tax-driven digitization of receipts, and the rise of cross-border e-commerce in Southeast Asia. China processed 132 billion parcels in 2024, cementing thermal labels as a logistics staple. India’s pharmaceutical and automotive sectors are targets for SATO’s multilingual WT4-AXB industrial printer, underlining demand for regionally tailored firmware. Regional growth rests on ongoing investments in warehousing automation and mobile point-of-sale adoption across emerging metropolitan areas, boosting overall thermal printing market size.
Europe occupies a balanced middle position, with sustainability mandates driving phenol-free and linerless adoption while digital-receipt requirements stifle some retail volumes. France’s electronic receipt law and Germany’s extended producer responsibility for label liners illustrate divergent regulatory pressures. Brexit-related customs paperwork keeps United Kingdom label usage elevated, and Southern Europe’s expanding biologics cold chain sustains demand for frost-resistant media. Meanwhile, the Middle East and Africa are channeling smart-city logistics investments into thermal infrastructure, and South America’s demand is concentrated in Brazil’s retail sectors, highlighting that future volumes depend heavily on macroeconomic stability and infrastructure expansion.

Competitive Landscape
Four multinationals, Zebra Technologies, SATO Holdings, Toshiba TEC, and Honeywell, collectively capture most of the global revenue, relying on proprietary consumables and long-term service contracts to entrench customers. Zebra’s USD 1.3 billion acquisition of Elo in January 2025 expanded its reach into interactive retail displays that integrate thermal printers as peripherals, signaling a broader ecosystem strategy. Star Micronics and Brother challenge incumbents through phenol-free and linerless innovations that lower consumable costs and ease environmental compliance, eroding legacy lock-in.
Asian challengers, notably TSC, Bixolon, and Xprinter, exploit local manufacturing cost advantages to win tenders in price-driven markets, especially among small logistics firms spinning up fulfilment nodes nationwide. To defend margins, incumbents emphasize total cost of ownership, highlighting head durability, energy savings, and superior remote service infrastructure. Sustainability has emerged as an important differentiator, such as SATO’s refreshed CL4NX Plus packaging slices CO₂ emissions by 39% across the box lifecycle, an advantage during bids with ESG scoring components.
Software ecosystems increasingly dictate hardware choice. Cloud APIs that expose printer status, job queues, and security logs let DevOps teams fold labelling into CI/CD-style architectures. Vendors bundle low-code connectors to SAP, Oracle, and Microsoft Dynamics, easing deployment friction. As asset visibility platforms pivot to edge AI, partnerships between printer OEMs and machine-vision firms bring label validation cameras under a single pane of glass. Meanwhile, IP litigation around printhead coatings and energy-efficient dot heaters intensifies as companies race to extend duty cycles. Overall, the competitive theatre balances innovation, cost pressure, and sustainability, ensuring the thermal printing market continues evolving rather than ossifying.
Thermal Printing Industry Leaders
Zebra Technologies Corporation
Sato Holdings Corporation
Honeywell International Inc.
Brother International Corporation
BIXOLON Co., Ltd.
- *Disclaimer: Major Players sorted in no particular order

Recent Industry Developments
- May 2025: Star Micronics introduced the TSP143IV SK linerless receipt printer, reducing consumable waste by 15%.
- May 2025: Brady Corporation released the M211 portable Bluetooth thermal printer for harsh industrial labeling tasks.
- March 2025: Zebra Technologies closed its purchase of Photoneo, enhancing its automation portfolio for warehouse robotics.
- February 2025: SATO completed its purchase of Checkpoint Systems’ Barcode Systems (BCS) Group, more than doubling its overseas barcode-printer revenue base and extending manufacturing and sales operations across North America, Europe, Australia, and New Zealand.


Research Methodology Framework and Report Scope
Market Definitions and Key Coverage
Our study defines the thermal printing market as global revenue generated from the sale of new direct-thermal, thermal-transfer, and dye-diffusion printers, industrial, desktop, and mobile formats, and the associated OEM supplies (ribbons and coated media) that drive recurring spend across retail, logistics, healthcare, manufacturing, banking, and government workflows.
Scope exclusion: finished labels produced by converters and aftermarket refurbished printers are outside our sizing.
Segmentation Overview
- By Application
- Barcode
- POS / Receipt
- Label
- Card
- RFID
- Kiosk and Ticket
- Mobile (Hand-held)
- By Printing Technology
- Direct Thermal (DT)
- Thermal Transfer (TT)
- Dye Diffusion Thermal Transfer (D2T2)
- By Format Type
- Industrial
- Desktop
- Mobile
- By End-Use Industry
- Retail and E-commerce
- Transportation and Logistics
- Manufacturing and Warehouse
- Healthcare and Pharma
- Government and Public Safety
- Hospitality and Entertainment
- Banking and Financial Services
- By Geography
- North America
- United States
- Canada
- Mexico
- South America
- Brazil
- Argentina
- Rest of South America
- Europe
- Germany
- United Kingdom
- France
- Italy
- Spain
- Rest of Europe
- Asia-Pacific
- China
- Japan
- India
- South Korea
- ASEAN
- Rest of Asia-Pacific
- Middle East and Africa
- Middle East
- Saudi Arabia
- United Arab Emirates
- Rest of Middle East
- Africa
- South Africa
- Nigeria
- Rest of Africa
- Middle East
- North America
Detailed Research Methodology and Data Validation
Primary Research
We interviewed printer-OEM product managers, label converters, 3PL warehouse IT heads, and hospital materials directors across North America, Europe, China, India, and Brazil. Their inputs on average print-engine lifecycles, media run-rates, and project pipelines helped validate model assumptions and refine regional growth multipliers.
Desk Research
Mordor analysts first map demand fundamentals using open datasets such as UN Comtrade codes 844332 and 482110 for printer and thermal-paper trade, US Census Bureau quarterly e-commerce sales, Eurostat retail turnover, and International Air Transport Association parcel-weight statistics. Regulations from the FDA's UDI database and EU MDR, plus patent activity pulled through Questel, clarify compliance-led adoption cycles. Company 10-Ks, investor decks, and Dow Jones Factiva news feeds enrich volume and ASP signals. (The sources named illustrate, not exhaust, the wider desk work undertaken.)
Market-Sizing & Forecasting
A top-down build starts with 2024 installed-base figures and trade-reconstructed shipment totals, which are then paired with median replacement cycles and media consumption elasticities to derive 2025 spend. Select bottom-up cross-checks, sampled vendor revenue splits, and channel ASP times unit estimates anchor totals within ±4 percent of management-guided ranges. Key variables include barcode-printer shipments, mobile-printer penetration in retail POS lanes, e-commerce parcel growth, thermal-paper price index, and healthcare wristband utilization. Multivariate regression links these drivers to historical revenue, while scenario analysis layers in BPA-free media cost swings and regional logistics capacity shifts for 2026-2030 projections. Data gaps in emerging regions are bridged by calibrated ratios to comparable GDP-per-parcel clusters.
Data Validation & Update Cycle
Outputs undergo variance screens versus independent indicators; anomalies trigger re-contacts with sources before sign-off. Reports refresh annually, with interim updates issued when currency swings, component shortages, or major M&A alter baselines.
Credibility Anchor: Why Mordor's Thermal Printing Baseline Commands Reliability
Published estimates differ because firms choose dissimilar printer-type mixes, bundle or exclude supplies, convert currencies on different dates, and apply varied refresh cadences.
Key gap drivers typically stem from counting refurbished units, assuming uniform ASP erosion, or rolling forward pre-pandemic growth curves without cross-checking parcel data spikes. Mordor's model, in contrast, locks scope to new-build hardware plus OEM supplies only, refreshes exchange rates quarterly, and weights forecasts with live primary feedback.
Benchmark comparison
| Market Size | Anonymized source | Primary gap driver |
|---|---|---|
| USD 43.61 Bn (2025) | Mordor Intelligence | - |
| USD 53.50 Bn (2025) | Global Consultancy A | Includes refurbished hardware and service contracts, uses calendar-year average FX |
| USD 49.30 Bn (2024) | Industry Journal B | Earlier base year rolled forward without adjusting for 2025 inflation and freight cost softening |
As the table shows, values diverge once scope breadth, base year, and cost assumptions shift. Because Mordor Intelligence ties every figure to traceable trade lines, live industry interviews, and yearly currency resets, decision-makers gain a balanced, reproducible baseline they can trust for budgeting and strategy moves.


Key Questions Answered in the Report
What is the projected value of the thermal printing market by 2031?
The market is expected to reach USD 56.20 billion by 2031, expanding at a 4.32% CAGR.
Which segment is growing fastest within thermal printing applications?
Mobile handheld printing is rising at a 5.06% CAGR through 2031 on the back of field-service and last-mile delivery demand.
Why do many logistics firms choose thermal over inkjet or laser printing?
Thermal printers deliver lower total cost of ownership, with per-label costs near USD 0.005 and fewer mechanical failures, making them ideal for high-volume shipping environments.
How are sustainability trends affecting thermal printing adoption?
Phenol-free and linerless media, together with regulations on single-use plastics and chemical restrictions, are spurring upgrades to environmentally friendly printers and consumables.
Which region is forecast to contribute most to incremental market growth?
Asia Pacific leads growth, with a 5.62% CAGR driven by expanding e-commerce logistics and mobile point-of-sale deployments.
Page last updated on:


