Thermal Print Label Market Size and Share
Market Overview
| Study Period | 2020 - 2031 |
|---|---|
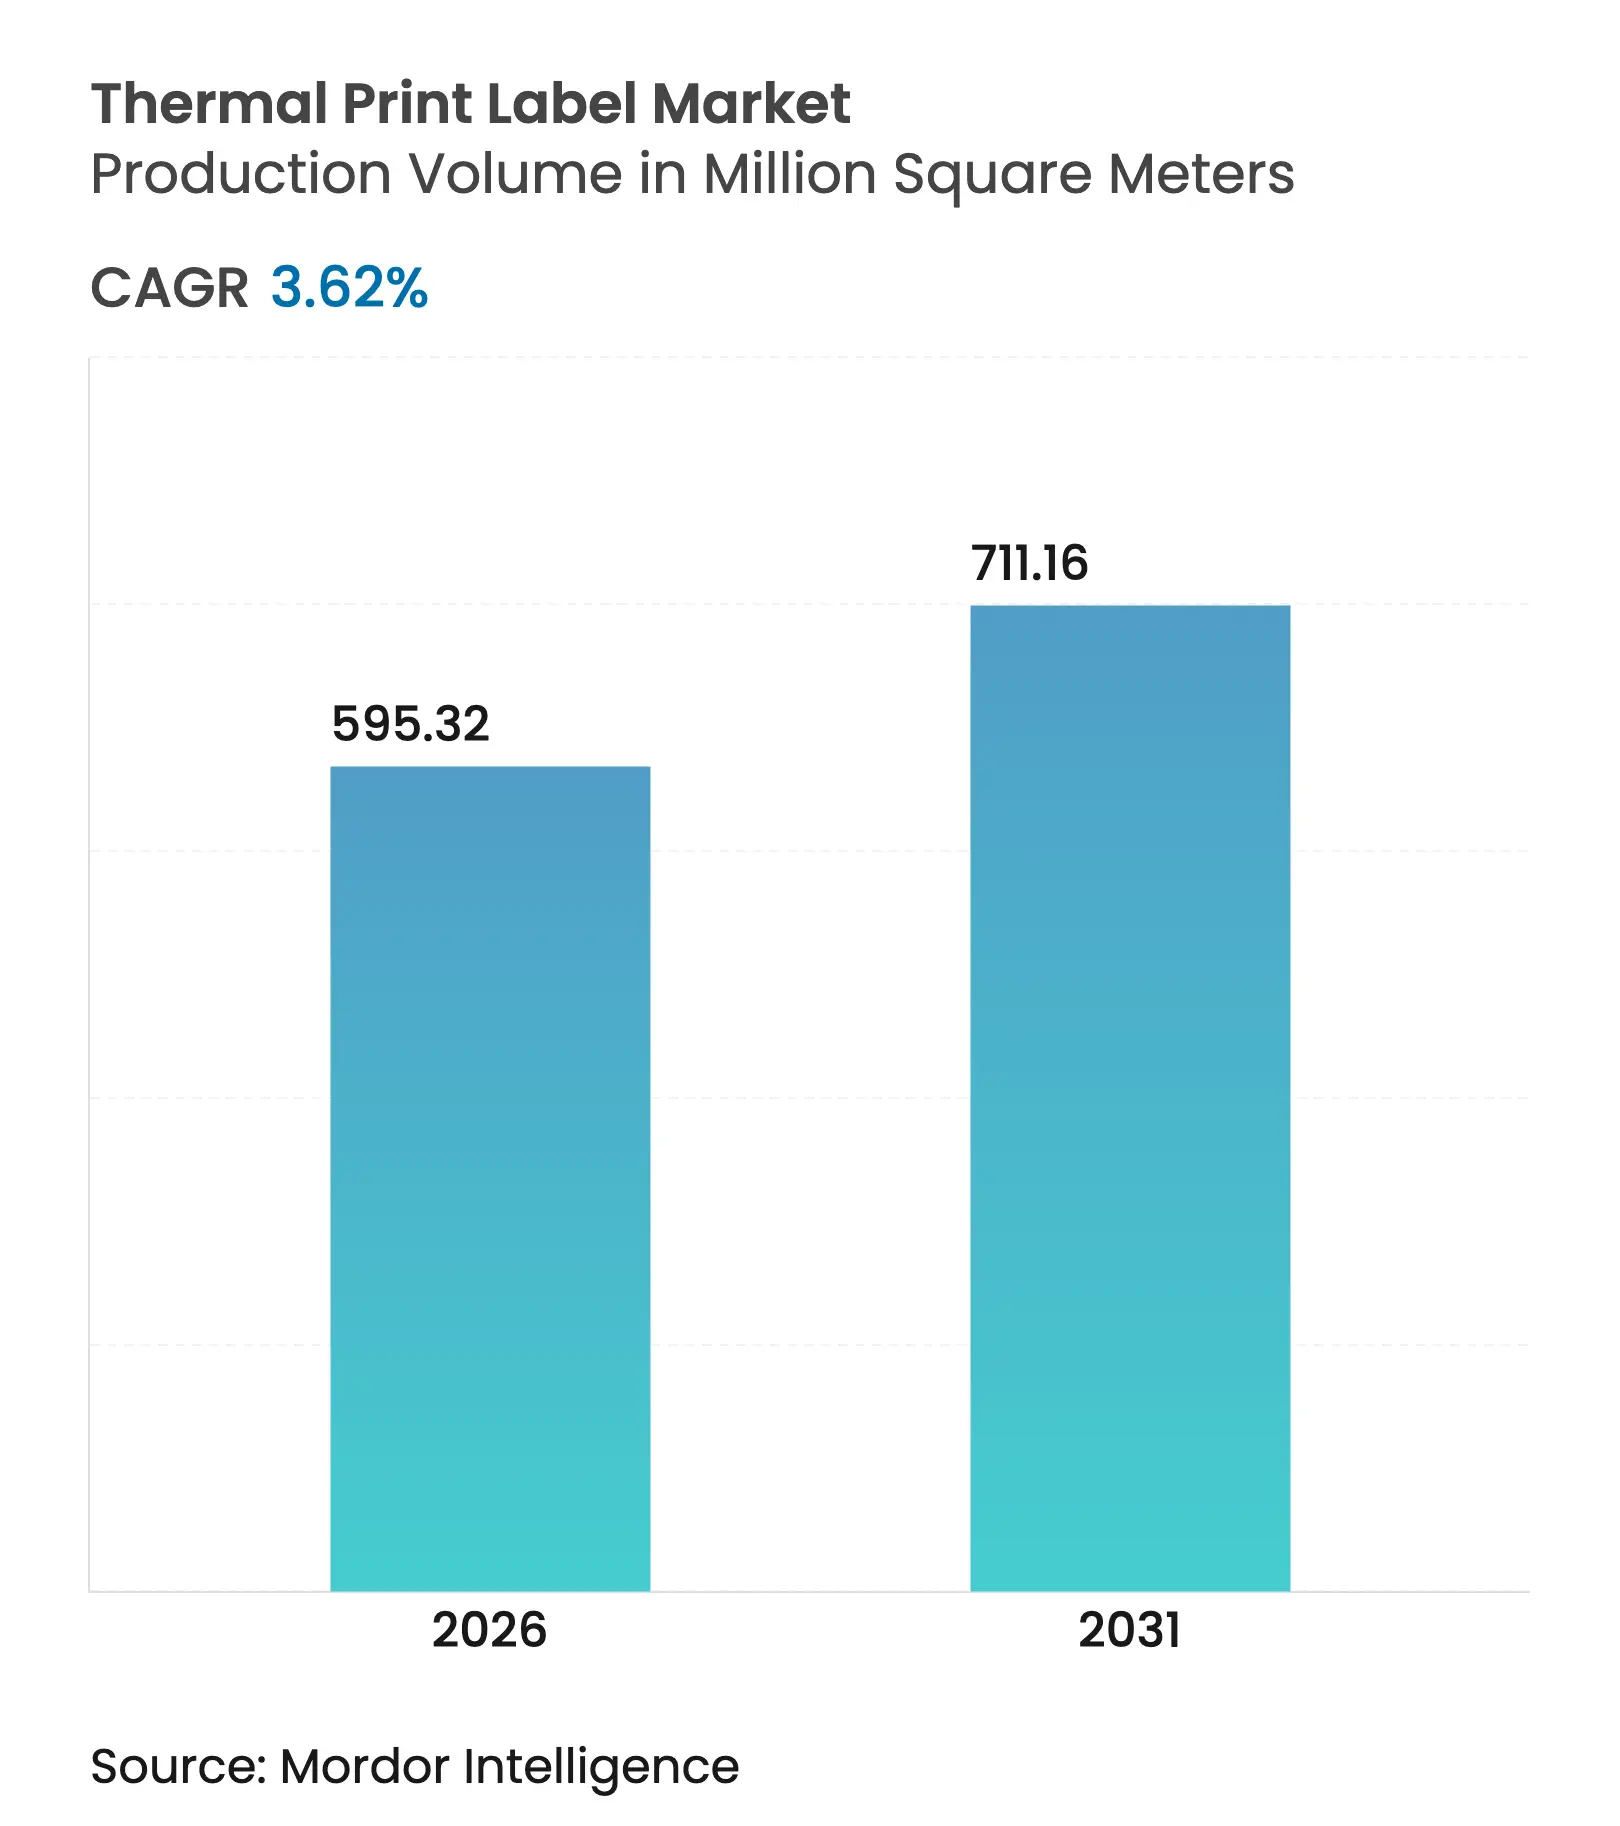
| Market Volume (2026) | 595.32 Million square meters |
| Market Volume (2031) | 711.16 Million square meters |
| CAGR | 3.62 % |
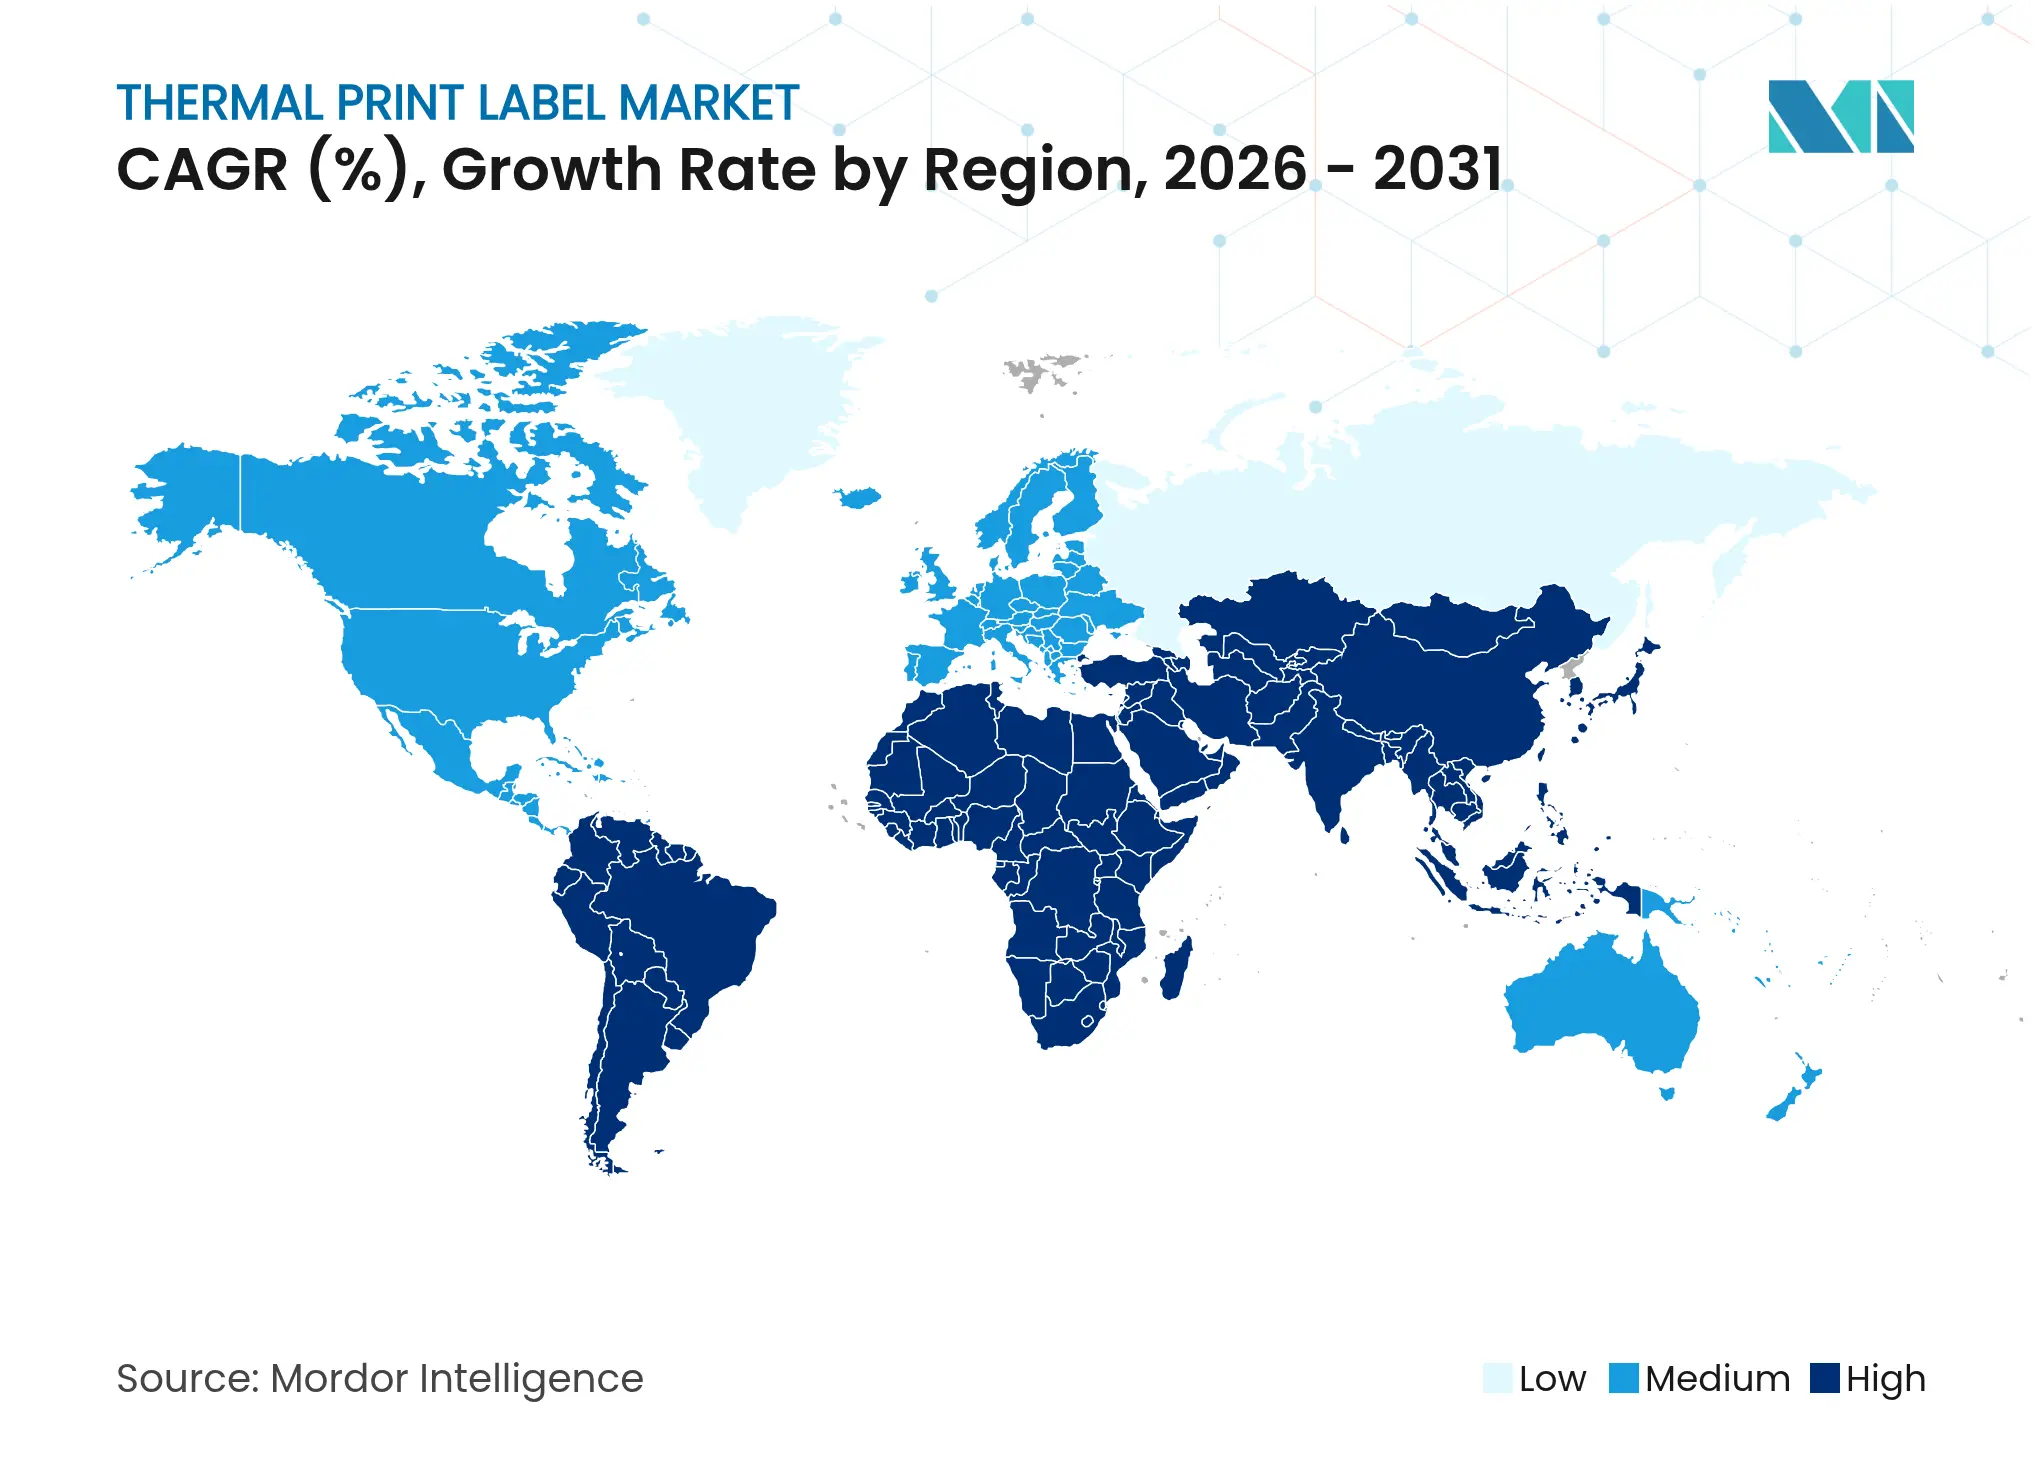
| Fastest Growing Market | Asia Pacific |
| Largest Market | North America |
| Market Concentration | Medium |
Major Players*Disclaimer: Major Players sorted in no particular order. Image © Mordor Intelligence. Reuse requires attribution under CC BY 4.0. |
Thermal Print Label Market Analysis by Mordor Intelligence
The thermal print label market size was valued at 574.52 million m² in 2025 and estimated to grow from 595.32 million m² in 2026 to reach 711.16 million m² by 2031, at a CAGR of 3.62% during the forecast period (2026-2031). This steady expansion signals a maturing yet resilient landscape in which rising e-commerce parcel flows, tightening healthcare serialization mandates, and a broad pivot toward automation keep demand moving on an upward path. Traditional paper substrates still dominate volumes, but rapid interest in synthetic, liner-less, and RFID-enabled options is reshaping product mix. Producers are battling raw-material inflation, import tariffs, and phenol-free reformulation costs even as they race to integrate sustainability credentials and smart features into next-generation labels. Strategic acquisitions accelerated through 2024–2025, giving larger converters end-to-end capabilities that address cost, compliance, and digital tracking requirements across global supply chains. Finally, the thermal print label market continues to benefit from technology’s inherent cost and speed edge over ink-based systems, balancing out headwinds from QR-code adoption and emerging digital alternatives.
Key Report Takeaways
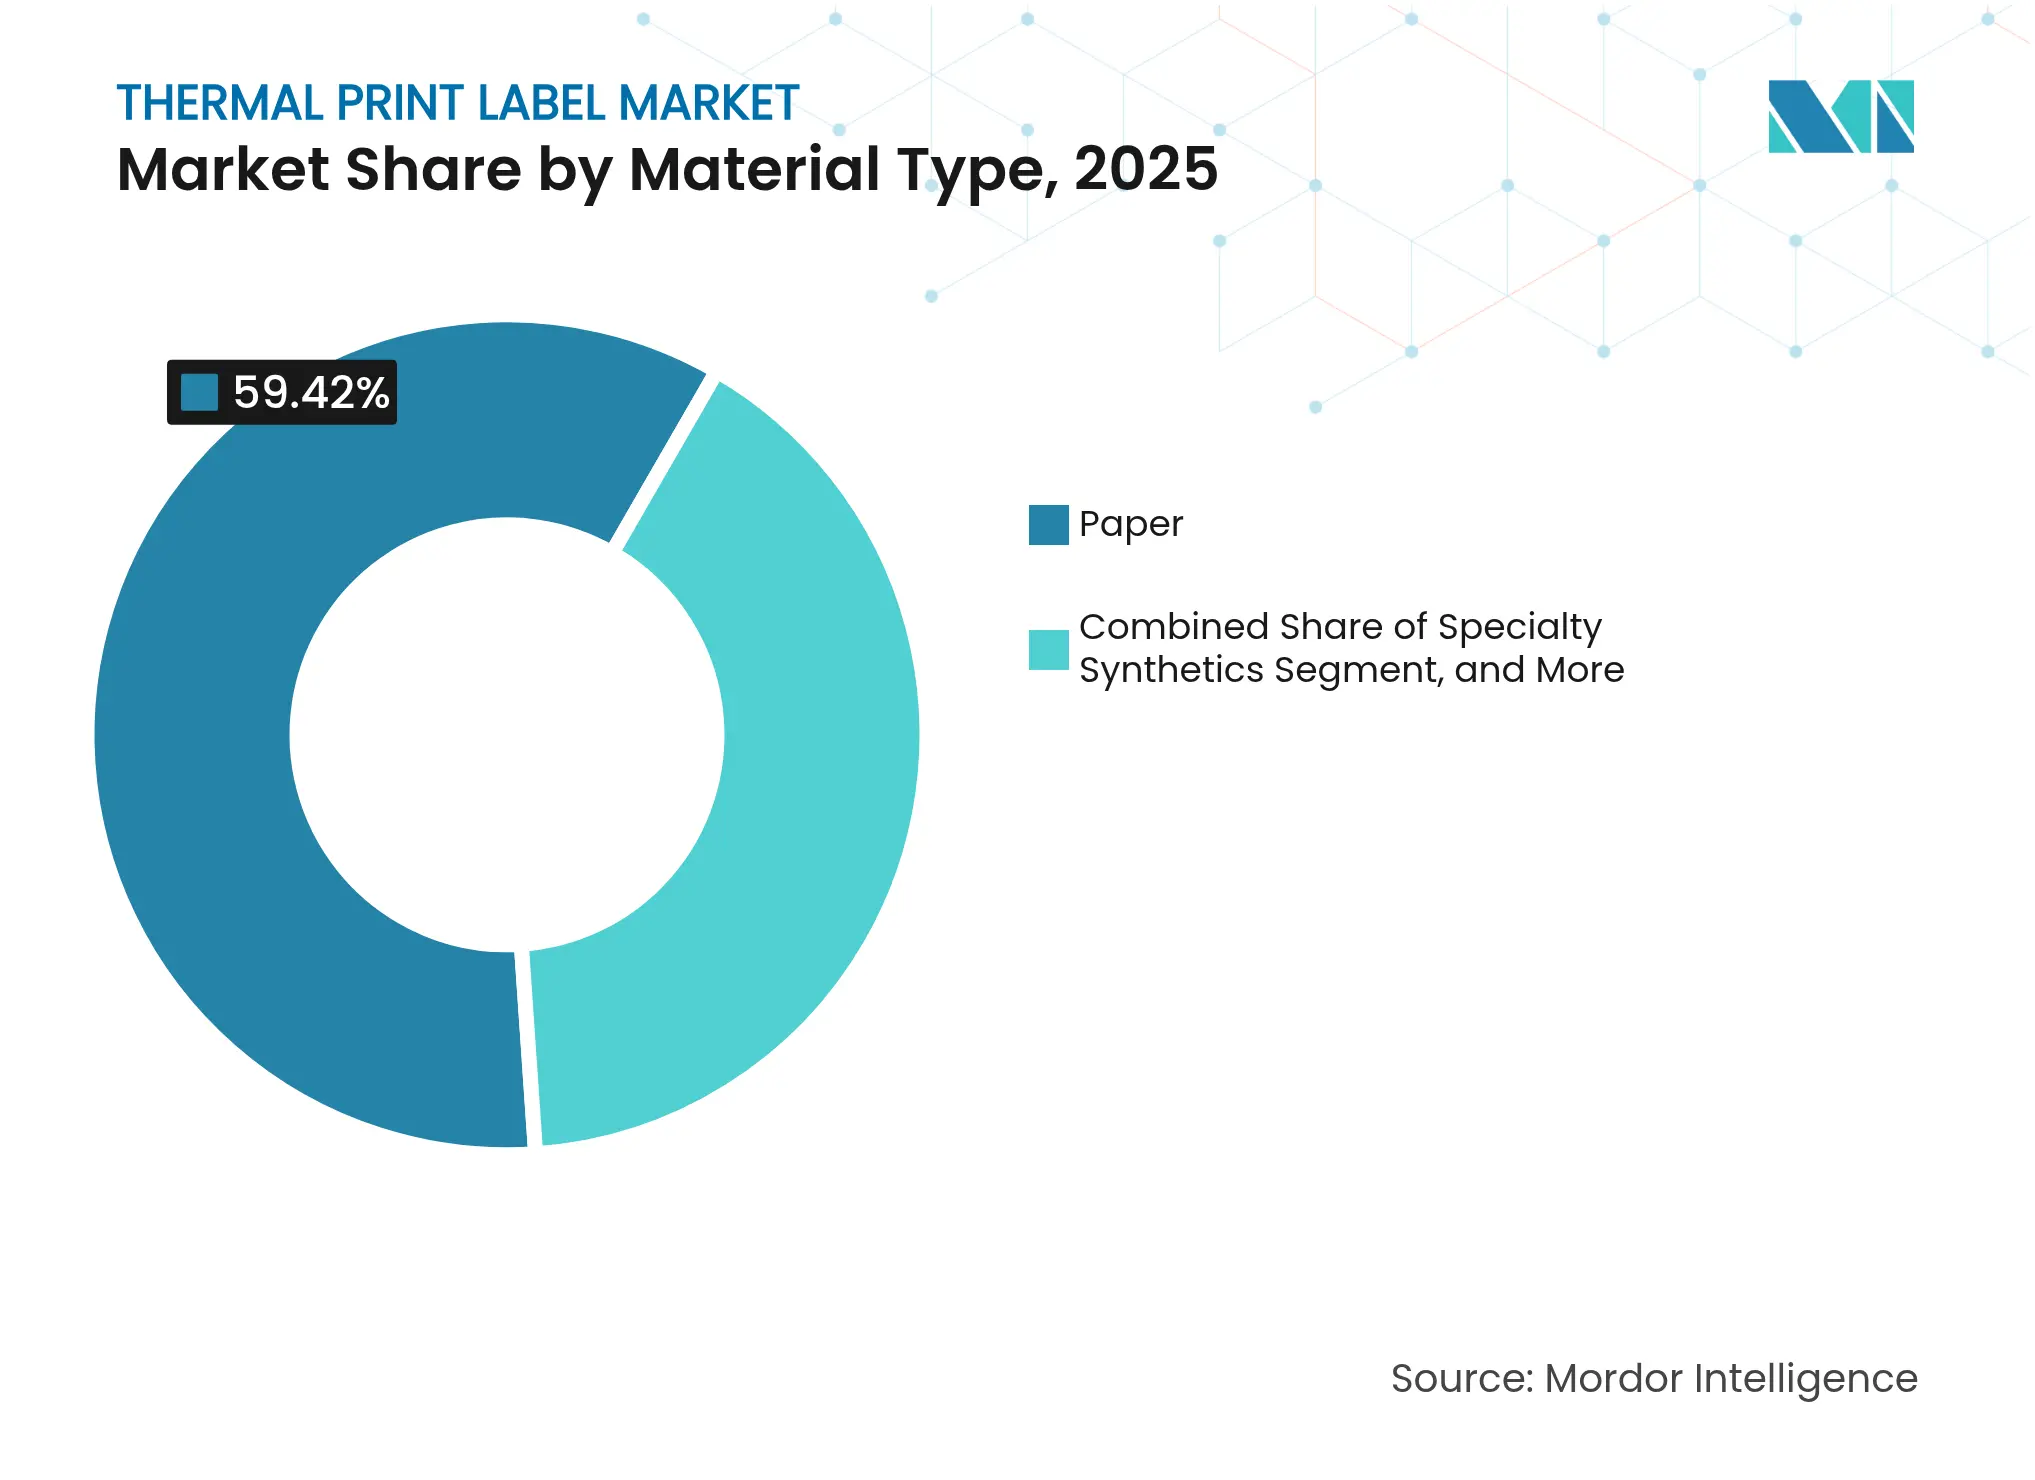
- By material type, paper labels accounted for 59.42% of thermal print label market share in 2025; specialty synthetics are on track for a 6.08% CAGR to 2031.
- By label type, direct thermal technology held 59.55% of thermal print label market size in 2025, while thermal transfer is growing fastest at 4.72% CAGR.
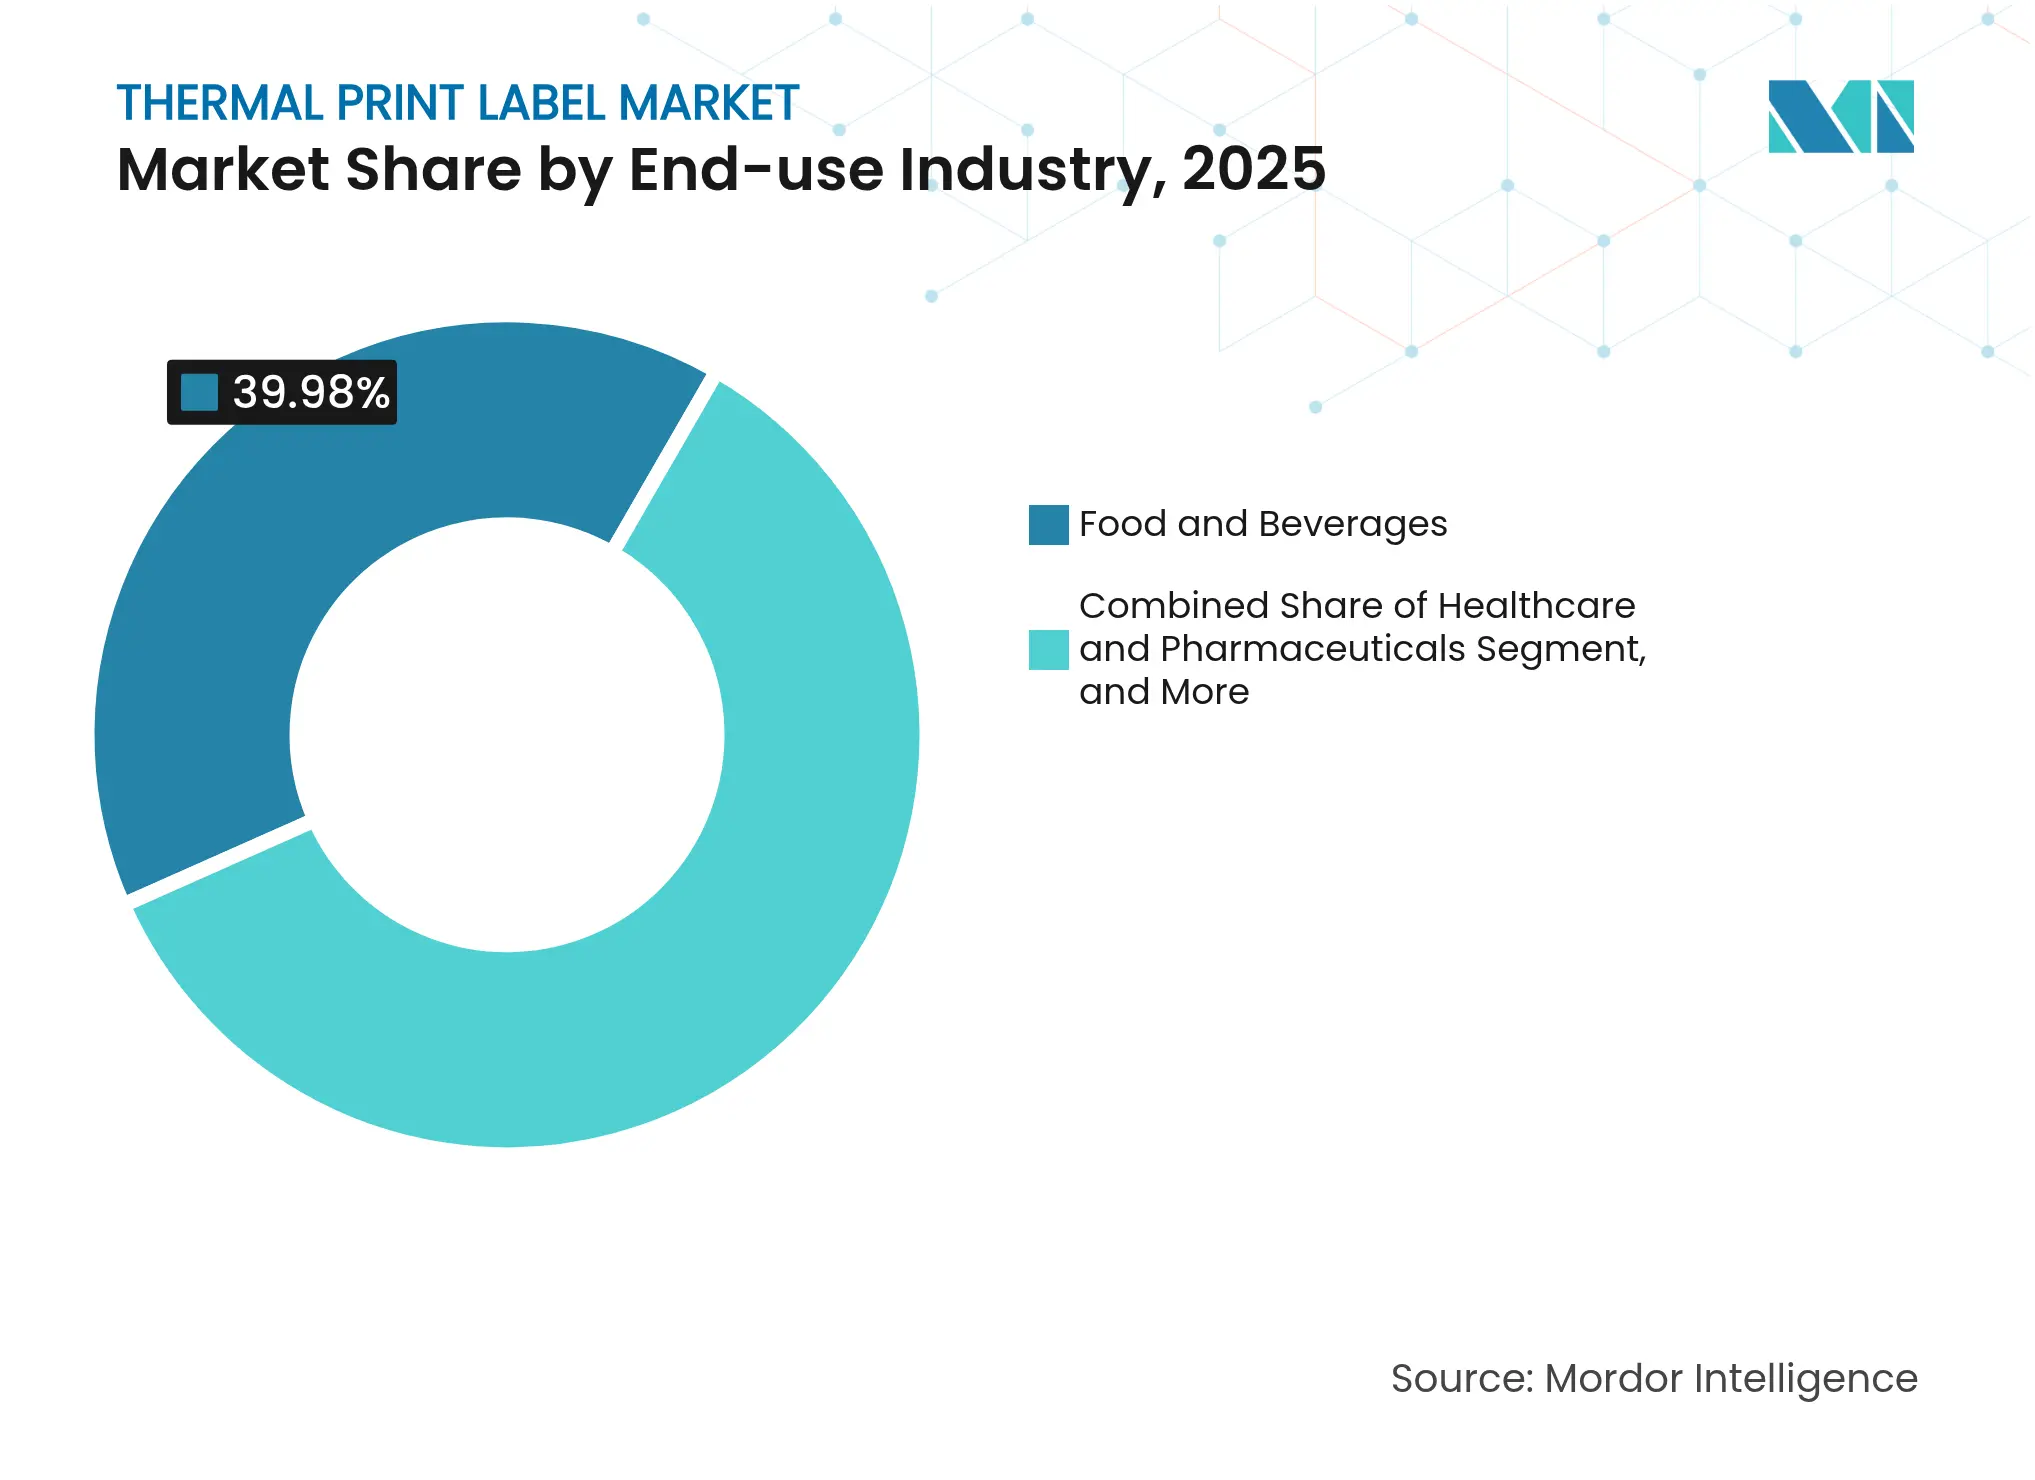
- By end-use industry, food and beverages led with 39.98% 2025 revenue share; healthcare and pharmaceuticals are forecast to expand at 7.19% CAGR to 2031.
- By printing technology, industrial printers generated 45.05% of 2025 shipments; mobile printers are projected to rise at 6.38% CAGR through 2031.
- By region, North America captured 35.12% of 2025 demand, whereas Asia-Pacific is advancing at 6.93% CAGR on the back of e-commerce and manufacturing growth.
Note: Market size and forecast figures in this report are generated using Mordor Intelligence's proprietary estimation framework, updated with the latest available data and insights as of 2026.
Global Thermal Print Label Market Trends and Insights
Drivers Impact Analysis
| Driver | (~) % Impact on CAGR Forecast | Geographic Relevance | Impact Timeline | |||
|---|---|---|---|---|---|---|
Healthcare & pharma thermal label demand
Healthcare & pharma thermal label demand
| +1.2% | North America & EU | Medium term (2-4 years) |
(~) % Impact on CAGR Forecast
:
+1.2%
|
Geographic Relevance
:
North America & EU
|
Impact Timeline
:
Medium term (2-4 years)
|
E-commerce shipping label surge
E-commerce shipping label surge
| +1.8% | North America & Asia-Pacific | Short term (≤ 2 years) | |||
Cost & speed edge over ink-based printing
Cost & speed edge over ink-based printing
| +0.7% | Global | Long term (≥ 4 years) | |||
RFID-enabled smart labels
RFID-enabled smart labels
| +0.9% | North America & EU, expanding in Asia-Pacific | Long term (≥ 4 years) | |||
Liner-less label adoption
Liner-less label adoption
| +0.6% | EU & North America | Medium term (2-4 years) | |||
Antimicrobial coated materials
Antimicrobial coated materials
| +0.4% | Developed markets | Medium term (2-4 years) | |||
| Source: Mordor Intelligence | ||||||
Rise in Demand for Thermal Labels in Healthcare and Pharmaceuticals
Global serialization deadlines in November 2024 triggered high-volume deployments of thermal print systems throughout pharma packaging lines. Drug makers centralized thousands of label files into standardized workflows that cut user error and kept pace with DSCSA lot-level tracing expectations. Blood bags, syringes, and cold-chain vials now use durable direct thermal tags that withstand refrigerated storage while preserving barcode readability for decades. Clinical-trial operators are piloting digital display labels that can update dosing data on demand without manual relabeling, raising throughput and patient safety simultaneously.[1]ISPE, “Digital Display Labeling in Clinical Supplies,” ispe.orgThe result is a stable revenue stream insulated from broader economic cycles, reinforcing the thermal print label market as an essential backbone of regulated healthcare distribution.
Surge in E-commerce Shipping and Logistics Label Volumes
Amazon Logistics processed 5.9 billion parcels in 2024, a 15.7% year-on-year jump that directly injected fresh label demand into fulfillment centers. Pitney Bowes projects 29 billion parcels in the United States by 2029, locking in multi-year thermal label purchase agreements across parcel carriers, 3PLs, and in-house shipper hubs. Warehouses are deploying automated print-and-apply robots to remove human error and achieve near-zero downtime, as shown by beverage and grocery installations completed in 2024. Same-day delivery models require extra touchpoint labels to enable real-time routing, making thermal printers an operational necessity. Prologis notes falling vacancy across last-mile facilities and predicts sustained air-cargo growth, both of which expand the installed base of high-speed label applicators.
Cost and Speed Advantages Versus Ink-based Printing
Thermal printers operate without ink or toner, trimming lifetime consumable expenses by up to 40% and powering throughput that reaches 12 ips in demanding sortation tunnels. Fewer moving parts translate into reduced maintenance schedules and extended service intervals, cutting downtime for round-the-clock facilities. Thermal units also consume about 60% less electricity than UV-curable ink platforms, an attractive metric as energy prices rise. Archival tests show direct thermal images can last 30 years in ambient warehouses, comfortably meeting most regulatory retention windows. These economics anchor the thermal print label market against competing print modalities even in price-sensitive environments.
Emergence of RFID-enabled Printable Smart Labels
Integrating RFID chips with classical thermal output delivers item-level visibility that barcode-only systems cannot replicate. Multi-Color Corporation’s purchase of Starport Technologies in late 2024 gave it embedded inlay capabilities that serve pharmaceuticals and premium CPG lines. Retailers are now adopting frictionless checkout models where RFID-encoded labels automate basket tallies, boosting demand for printers that can encode and print in one pass. Zebra Technologies partnered with Merck KGaA on the M-Trust authentication platform in 2025 to fight counterfeiting through secure thermal-printed tags. Growing IoT deployments in cold-chain monitoring further widen the application base for smart thermal labels that transmit temperature or shock events.
Restraints Impact Analysis
| Restraint | (–) % Impact on CAGR Forecast | Geographic Relevance | Impact Timeline | |||
|---|---|---|---|---|---|---|
BPA regulations & thermal paper cost swings
BPA regulations & thermal paper cost swings
| -0.8% | EU & California | Short term (≤ 2 years) |
(–) % Impact on CAGR Forecast
:
-0.8%
|
Geographic Relevance
:
EU & California
|
Impact Timeline
:
Short term (≤ 2 years)
|
Durability limits of direct-thermal in harsh settings
Durability limits of direct-thermal in harsh settings
| -0.5% | Global industrial sites | Medium term (2-4 years) | |||
QR-code shift reducing label volumes
QR-code shift reducing label volumes
| -1.1% | Global retail | Medium term (2-4 years) | |||
Printhead supply constrained by chip shortages
Printhead supply constrained by chip shortages
| -0.3% | Asia-Pacific | Short term (≤ 2 years) | |||
| Source: Mordor Intelligence | ||||||
BPA Regulations and Thermal Paper Supply Volatility
California added bisphenol S to Proposition 65 in December 2023, forcing distributors to relabel or reformulate stock by end-2024, a move that mirrored the EU’s earlier BPA ban. Studies in 2025 still detect high BPS loads in many thermal grades, spurring calls for a broader phenol crackdown that could drive another round of R&D and price hikes. Several mills announced 10% price rises in 2025 citing tariff burdens and chemistry conversion costs, squeezing converters’ margins. The uncertainty pushes end users toward synthetic ribbons or direct thermal phenol-free substrates that typically cost more per impression.
Shift to Digital QR Codes Reducing Label Volumes
GS1’s initiative to replace one-dimensional barcodes with 2D QR formats by 2027 has backing from 22 multinationals and pilots across 48 countries. Retail executives overwhelmingly expect full switchover by 2030 as QR codes embed dynamic data layers and consumer engagement tools. Australian grocer Woolworths already scans more than 9 million QR codes each week, cutting food waste by 40% through better expiry tracking. While thermal printers still produce the initial QR label, the shift tends to consolidate multiple SKU or promo labels into one, placing downward pressure on volume growth within the thermal print label market.
Segment Analysis
By Material Type: Paper Strength Meets Synthetic Innovation
Paper labels commanded 59.42% of thermal print label market share in 2025, reflecting low cost, universal printer compatibility, and established supply networks. The segment supplies high-volume applications such as shipping, receipts, and grocery price tags, where life-span demands rarely exceed a few days. Specialty synthetics delivering chemical, moisture, and UV resistance are now pacing at 6.08% CAGR to 2031 as automotive, electronics, and petrochemical customers demand longer-life identifiers. UPM Raflatac’s Carbon Action Label portfolio illustrates how bio-based films narrow the sustainability gap with paper while retaining performance. Over the forecast horizon, incremental migration toward higher-margin synthetics helps lift average selling prices inside the thermal print label market.
Market entrants that specialize in tamper-evident foils and holographic laminates find opportunities in pharmaceuticals and luxury goods, niches less sensitive to raw material inflation. Security substrates guard against counterfeit diversion by integrating color-shifting pigments readable under UV inspection. Meanwhile, liner-less paper grades begin eating into traditional coated offerings as converters adapt pressing equipment for support-free webs. Together these trends nudge the material landscape toward a balanced mix where cost, durability, and sustainability dictate substrate selection.
Note: Segment shares of all individual segments available upon report purchase
By Label Type: Direct Thermal Leadership Faces Transfer Upside
Direct thermal facestocks delivered 59.55% of thermal print label market size in 2025 owing to straightforward printer mechanics and ribbon-free operation that suits pick-pack-ship lines. However, print darkening from heat or scuffing limits their use in industrial and outdoor settings. Thermal transfer labels, combining resin or wax ribbons with paper or film, are accelerating at 4.72% CAGR. Manufacturers such as Domino rolled out high-speed thermal transfer overprinters that handle 1,200 mm ribbon rolls, slashing changeovers and downtime.Resin formulas increasingly meet UL and CSA durability ratings, widening the addressable market in electronics, automotive, and chemical drums. As retailers adopt 2D codes rich in expiration and batch data, hybrid direct-thermal topcoats engineered for better scratch resistance could temper migration but will not fully stem the expansion of transfer-based systems.
In niche coding of flexible films, overprinting onto pouches and flow wraps has become mainstream as single-serve portions proliferate. Thermal transfer thereby positions itself as the premium durability solution within the broader thermal print label market, particularly where print contrast and chemical stability carry regulatory weight.
By End-use Industry: Food Dominance Confronts Healthcare Momentum
Food and beverages absorbed 39.98% of 2025 shipments owing to stringent traceability rules, private-label SKU growth, and high-turnover supermarket supply chains. Brewer Duvel Moortgat’s full factory traceability example demonstrates the multimodal labeling layers required from brew-kettle to pallet. Looking ahead, sustainability pledges push grocers to liner-less or phenol-free stocks, offering growth headroom inside a still-dominant vertical. The healthcare and pharmaceutical channel records a 7.19% CAGR through 2031 as serialization and cold-chain management stay top of mind. Thermal labels withstand cryogenic storage on biologics and vaccines, guaranteeing scan reliability at hand-off checkpoints.
Logistics, the third-ranked adopter, scales with parcel-volume curves tied to omnichannel retail and international trade flows. Retail itself is pivoting to RFID tagging for inventory views, with Avery Dennison noting mid-single-digit growth in its Intelligent Labels unit on apparel and food applications. Additional runway appears in manufacturing plants implementing Industry 4.0, where asset monitoring and WIP tracking drive printer installs on every line.
Note: Segment shares of all individual segments available upon report purchase
By Printing Technology: Industrial Workhorses Outpaced by Mobile Growth
Industrial tabletop and in-line units generated 45.05% of 2025 printer sales, anchoring high-speed warehouses and factory cells. These systems integrate SAP or Oracle MES data streams, feeding applicators that run 24/7 with minimal intervention. Investment cycles continue as parcel carriers automate small sort centers and as new fulfillment facilities open in secondary metros. Mobile printers, however, post the fastest 6.38% CAGR to 2031 as field technicians, home-health nurses, and curbside pickup attendants demand on-the-spot label generation tied to handheld devices. Advances in Li-ion battery density and wireless protocols shrink weight and broaden duty cycles, lowering the adoption barrier further.
Desktop printers bridge the gap for SMB offices where label demand sits between 5,000 and 25,000 imprints monthly. Printhead manufacturing constraints related to semiconductor allocations eased somewhat in 2025 as Epson completed its Akita line, tripling future output capacity and alleviating backlog across all printer classes.
Geography Analysis
North America retained 35.12% of global demand in 2025 as entrenched e-commerce habits, labor cost pressures, and regulatory compliance needs stimulated ongoing thermal label investment. Amazon’s parcel volumes, combined with stringent DSCSA enforcement, anchored order pipelines for media and printer OEMs. Canada and Mexico also signal steady allocations for cross-border shipping and automotive traceability mandates.
Europe sits in second position, shaped by the EU’s phenol bans, incoming Digital Product Passport rules, and carbon-reduction targets. Converters fast-track liner-less lines to meet retailer packaging scorecards, while German machine builders export automated applicators across the region. The European Food Safety Authority’s scrutiny over chemical migration adds urgency for phenol-free paper and film adoption, creating a premium niche within the thermal print label market.
Asia-Pacific leads growth at 6.93% CAGR as China’s domestic e-commerce giants expand rural logistics networks and India digitizes its pharmaceutical supply chain. Local printhead production ramps in Japan and China, trimming lead times for regional OEMs. Southeast Asian exporters adopt English-language nutrition and country-of-origin labels to access Western markets, contributing incremental demand. South America and the Middle East trail in volume but invest in customs compliance and oil-field service labeling, often sourcing printers from multinational vendors assembled within the region.

Competitive Landscape
Market Concentration
The marketplace features a blend of diversified material science giants and regional converters, resulting in moderate fragmentation. OMNI Systems’ 2024 purchase of Honeywell Media broadened its thermal media reach, while ProMach’s acquisition of Panther Industries the same year bolstered print-and-apply automation portfolios.[3]OMNI Systems, “OMNI Systems Completes Acquisition of Honeywell Media,” omnisystem.com Multi-Color Corporation’s smart-label acquisition spree provides deeper RFID capabilities, illustrating how inorganic growth secures proprietary technology ahead of scaled competitors.
Technology rivalry centers on substrate R&D and encoding intelligence rather than bare print speed. Zebra Technologies’ M-Trust collaboration epitomizes co-development aimed at anti-counterfeiting and authentication extensions beyond shipping labels. Meanwhile, 3M channels adhesives know-how into low-energy liner-less constructions that run on legacy hardware with minimal change parts. Patent filings tracked by DayMark Safety Systems show continued innovation in date-coding formats aimed at foodservice safety.
Financial performance underscores resilience: CCL Industries logged record 8.6% sales expansion in Q1 2025 on top of nine acquisitions since 2023, while Zebra posted an 11.3% revenue lift and EBITDA margin of 22.3% in the same quarter. The quest for end-to-end solutions integrating media, hardware, and software drives further consolidation, though regional specialists remain competitive through speed of service and intimate customer knowledge.
Thermal Print Label Industry Leaders

*Disclaimer: Major Players sorted in no particular order
Recent Industry Developments
- May 2025: CCL Industries reported record Q1 2025 revenue of CAD 1.8 billion, up 8.6%, supported by recent specialty label acquisitions.
- April 2025: Zebra Technologies posted Q1 2025 net sales of USD 1.308 billion, with adjusted EBITDA margin expanding to 22.3%.
- April 2025: Avery Dennison recorded USD 2.1 billion Q1 2025 revenues; Intelligent Labels delivered mid-single-digit growth.
- March 2025: ProMach’s ID Technology division acquired Etiflex, expanding RFID label capacity in Mexico.
Table of Contents for Thermal Print Label Industry Report
1. INTRODUCTION
- 1.1Study Assumptions and Market Definition
- 1.2Scope of the Study
2. RESEARCH METHODOLOGY
3. EXECUTIVE SUMMARY
4. MARKET LANDSCAPE
- 4.1Market Overview
- 4.2Market Drivers
- 4.2.1Rise in demand for thermal labels in healthcare and pharma
- 4.2.2Surge in e-commerce shipping and logistics label volumes
- 4.2.3Cost and speed advantages versus ink-based printing
- 4.2.4Emergence of RFID-enabled printable smart labels
- 4.2.5Liner-less label adoption for sustainability and automation
- 4.2.6Antimicrobial coated label materials for food/pharma
- 4.3Market Restraints
- 4.3.1BPA regulations and thermal paper supply volatility
- 4.3.2Limited durability of direct-thermal labels in harsh environments
- 4.3.3Shift to digital QR codes reducing label volumes
- 4.3.4Semiconductor shortages affecting print-head supply
- 4.4Investment Analysis
- 4.5Supply-Chain Analysis
- 4.6Regulatory Landscape
- 4.7Technological Outlook
- 4.8Porter's Five Forces Analysis
- 4.8.1Threat of New Entrants
- 4.8.2Bargaining Power of Suppliers
- 4.8.3Bargaining Power of Buyers
- 4.8.4Threat of Substitutes
- 4.8.5Competitive Rivalry
5. MARKET SIZE AND GROWTH FORECASTS (VOLUME)
- 5.1By Material Type
- 5.1.1Paper
- 5.1.2Synthetics (PP, PET)
- 5.1.3Specialty Synthetics (laminates, foils, BOPP, etc.)
- 5.1.4Other Material Type
- 5.2By Label Type
- 5.2.1Direct Thermal Labels
- 5.2.2Thermal Transfer Labels
- 5.3By End-use Industry
- 5.3.1Food and Beverages
- 5.3.2Healthcare and Pharmaceuticals
- 5.3.3Logistics and Transportation
- 5.3.4Retail
- 5.3.5E-commerce Fulfilment Centres
- 5.3.6Manufacturing and Electronics
- 5.3.7Other End-use Industry
- 5.4By Printing Technology
- 5.4.1Desktop Printers
- 5.4.2Industrial Printers
- 5.4.3Mobile Printers
- 5.4.4In-line/TTO (Thermal Transfer Over-printing)
- 5.5By Geography
- 5.5.1North America
- 5.5.1.1United States
- 5.5.1.2Canada
- 5.5.1.3Mexico
- 5.5.2Europe
- 5.5.2.1Germany
- 5.5.2.2United Kingdom
- 5.5.2.3France
- 5.5.2.4Italy
- 5.5.2.5Spain
- 5.5.2.6Russia
- 5.5.2.7Rest of Europe
- 5.5.3Asia-Pacific
- 5.5.3.1China
- 5.5.3.2India
- 5.5.3.3Japan
- 5.5.3.4South Korea
- 5.5.3.5Australia and New Zealand
- 5.5.3.6Rest of Asia-Pacific
- 5.5.4Middle East and Africa
- 5.5.4.1Middle East
- 5.5.4.1.1United Arab Emirates
- 5.5.4.1.2Saudi Arabia
- 5.5.4.1.3Turkey
- 5.5.4.1.4Rest of Middle East
- 5.5.4.2Africa
- 5.5.4.2.1South Africa
- 5.5.4.2.2Nigeria
- 5.5.4.2.3Egypt
- 5.5.4.2.4Rest of Africa
- 5.5.5South America
- 5.5.5.1Brazil
- 5.5.5.2Argentina
- 5.5.5.3Rest of South America
6. COMPETITIVE LANDSCAPE
- 6.1Market Concentration
- 6.2Strategic Moves
- 6.3Market Share Analysis
- 6.4Company Profiles (includes Global level Overview, Market level overview, Core Segments, Financials as available, Strategic Information, Market Rank/Share, Products and Services, Recent Developments)
- 6.4.1CCL Industries Inc.
- 6.4.23M Company
- 6.4.3Brady Corporation
- 6.4.4Zebra Technologies Corporation
- 6.4.5Lintec Corporation
- 6.4.6SATO Holdings Corporation
- 6.4.7Ricoh Company, Ltd.
- 6.4.8ARMOR-IIMAK SAS
- 6.4.9Multi-Color Corporation
- 6.4.10Honeywell International Inc.
- 6.4.11Brother Industries, Ltd.
- 6.4.12Seiko Epson Corporation
- 6.4.13Avery Dennison Corporation
- 6.4.14Domino Printing Sciences plc
- 6.4.15Resource Label Group LLC
- 6.4.16OMNI Systems Inc.
- 6.4.17JK Labels Pvt. Ltd.
- 6.4.18Sai Impression Labels & Packaging Solutions
- 6.4.19STICKER’S PACK SA de CV
- 6.4.20Markem-Imaje (Dover)
7. MARKET OPPORTUNITIES AND FUTURE OUTLOOK
- 7.1White-space and Unmet-need Assessment
Global Thermal Print Label Market Report Scope
The thermal print label market encompasses the manufacturing and distribution of labels produced through thermal printing technology. The process involves applying heat to transfer ink or activating color-changing chemicals on label materials. These labels serve various industries, including retail, logistics, healthcare, and manufacturing. Their primary applications include barcoding, product identification, and shipping, where rapid, precise, and durable labeling is essential.
The thermal print label market is segmented by material type (paper, synthetics (polyesters, polypropylene), special synthetics (laminates, aluminum foils, etc.)), label type (direct thermal labels, thermal transfer labels), end-user industry (food and beverages, healthcare and pharmaceuticals, logistics and transportation, retail, e-commerce, manufacturing and electronics, other end-user industries (personal care and cosmetics, chemicals, etc.)), geography (North America [United States, Canada], Europe [Germany, United Kingdom, France, Spain, Italy, and Rest of Europe], Asia-Pacific [India, China, Japan, and Rest of Asia-Pacific], Latin America [Brazil, Mexico, and Rest of Latin America], Middle East and Africa [United Arab Emirate, Saudi Arabia, South Africa, Rest of Middle East and Africa]). The market size and forecasts are provided in terms of volume (square meters) for all the above segments.