Digital Pen Market Size and Share
Market Overview
| Study Period | 2020 - 2031 |
|---|---|
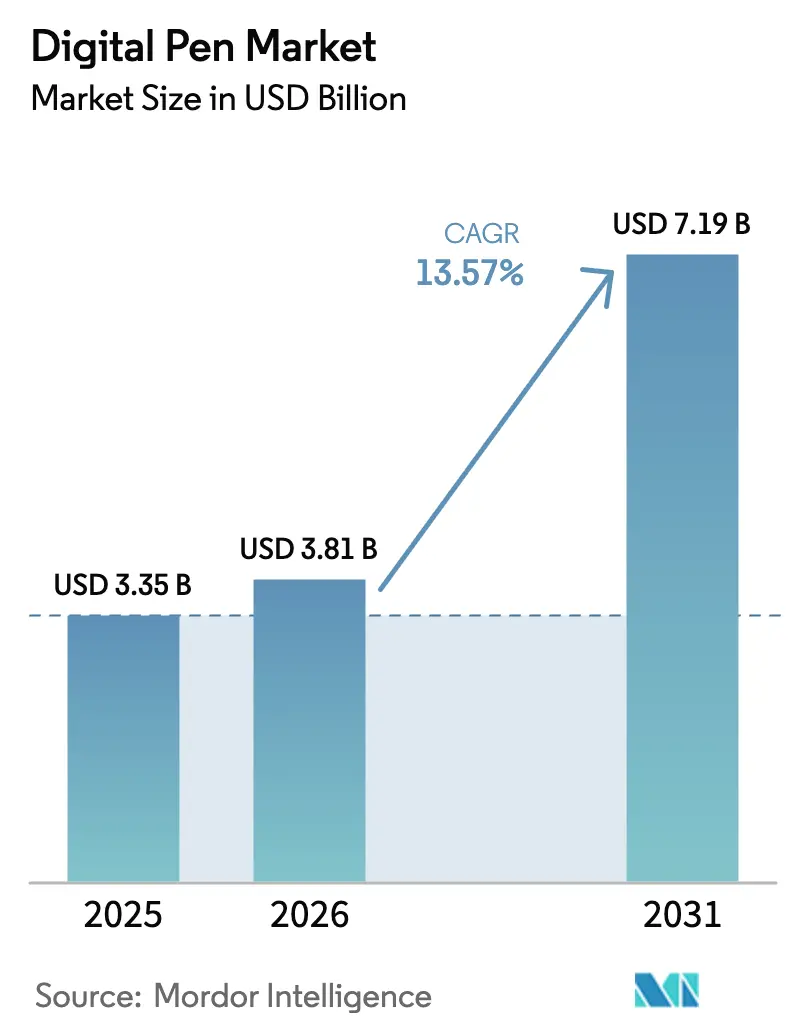
| Market Size (2026) | USD 3.81 Billion |
| Market Size (2031) | USD 7.19 Billion |
| Growth Rate (2026 - 2031) | 13.57% CAGR |
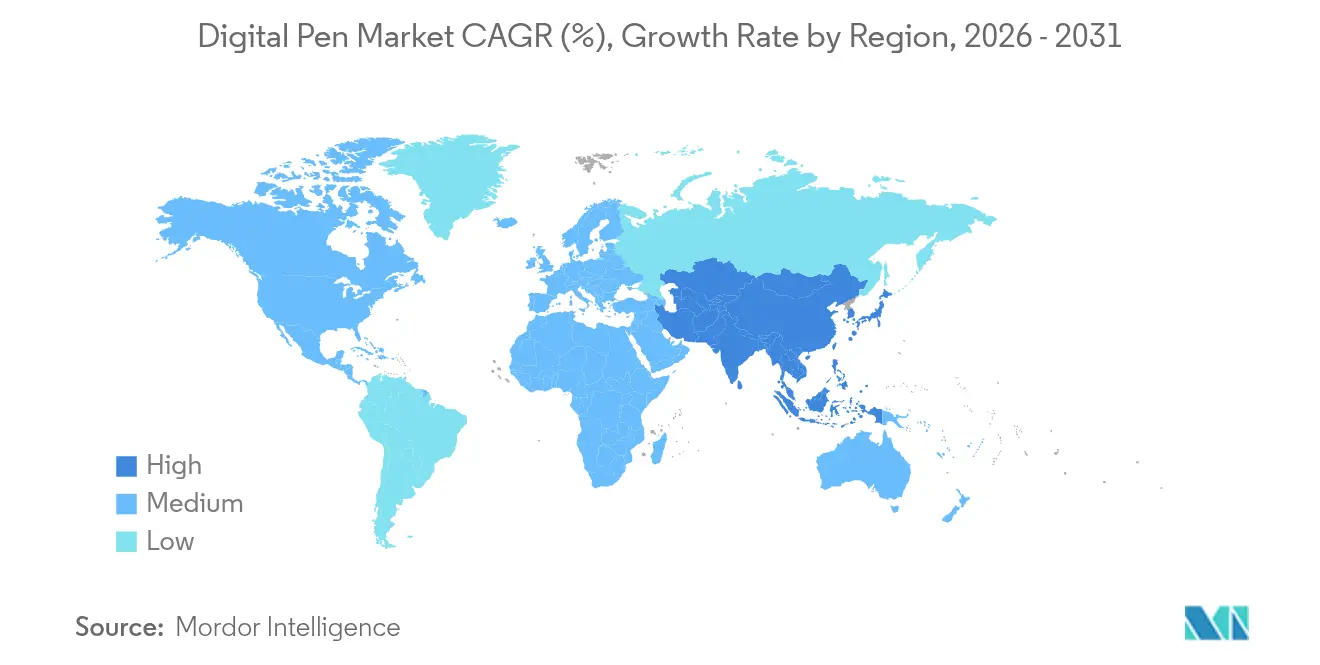
| Fastest Growing Market | Asia Pacific |
| Largest Market | North America |
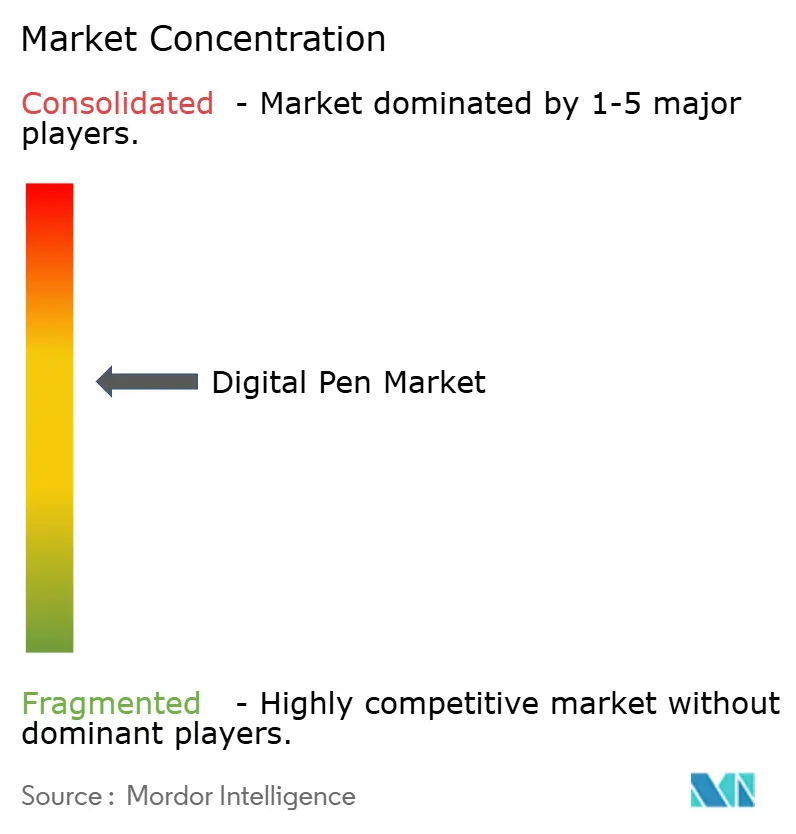
| Market Concentration | Medium |
Major Players *Disclaimer: Major Players sorted in no particular order Image © Mordor Intelligence. Reuse requires attribution under CC BY 4.0. | |
Digital Pen Market Analysis by Mordor Intelligence
The digital pen market size was valued at USD 3.35 billion in 2025 and estimated to grow from USD 3.81 billion in 2026 to reach USD 7.19 billion by 2031, at a CAGR of 13.57% during the forecast period (2026-2031). Healthcare digitization mandates, expanding e-learning ecosystems, and widening 2-in-1 device adoption are propelling the digital pen market toward mainstream input status across work, study, and creative activities. North America’s entrenched enterprise workflows, Asia-Pacific’s manufacturing scale, and Europe’s compliance-driven demand combine to create a multi-vector growth engine. Technology shifts toward battery-free EMR and low-power AES solutions address usability gaps while tightening supply chains through localized semiconductor fabrication improves component availability. Competition centers on proprietary ecosystems, with Apple, Samsung, and Wacom leveraging research and development depth, patent portfolios, and ecosystem lock-in to defend share even as AI-enabled newcomers challenge incumbent economics.
Key Report Takeaways
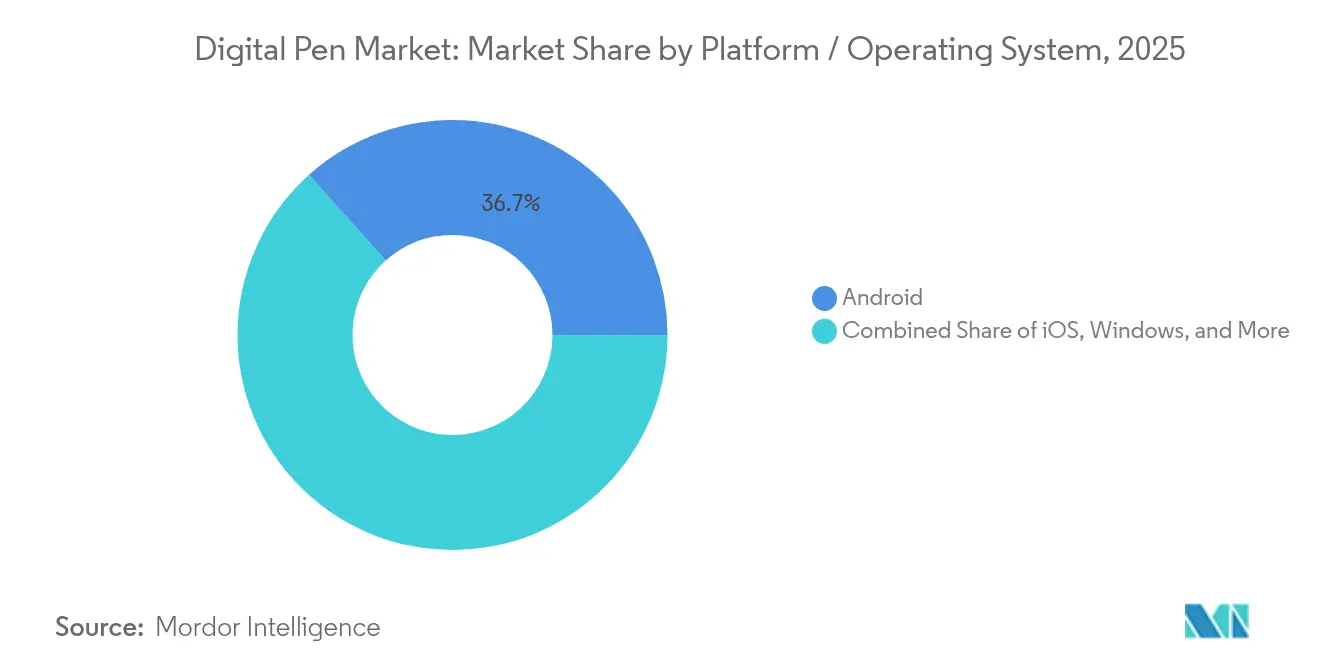
- By platform / operating system, android led with 36.65% of the digital pen market in 2025, whereas iOS is on track for a 14.19% CAGR.
- By technology, EMR commanded 41.75% of the digital pen market share in 2025; AES is projected to expand at a 15.47% CAGR through 2031.
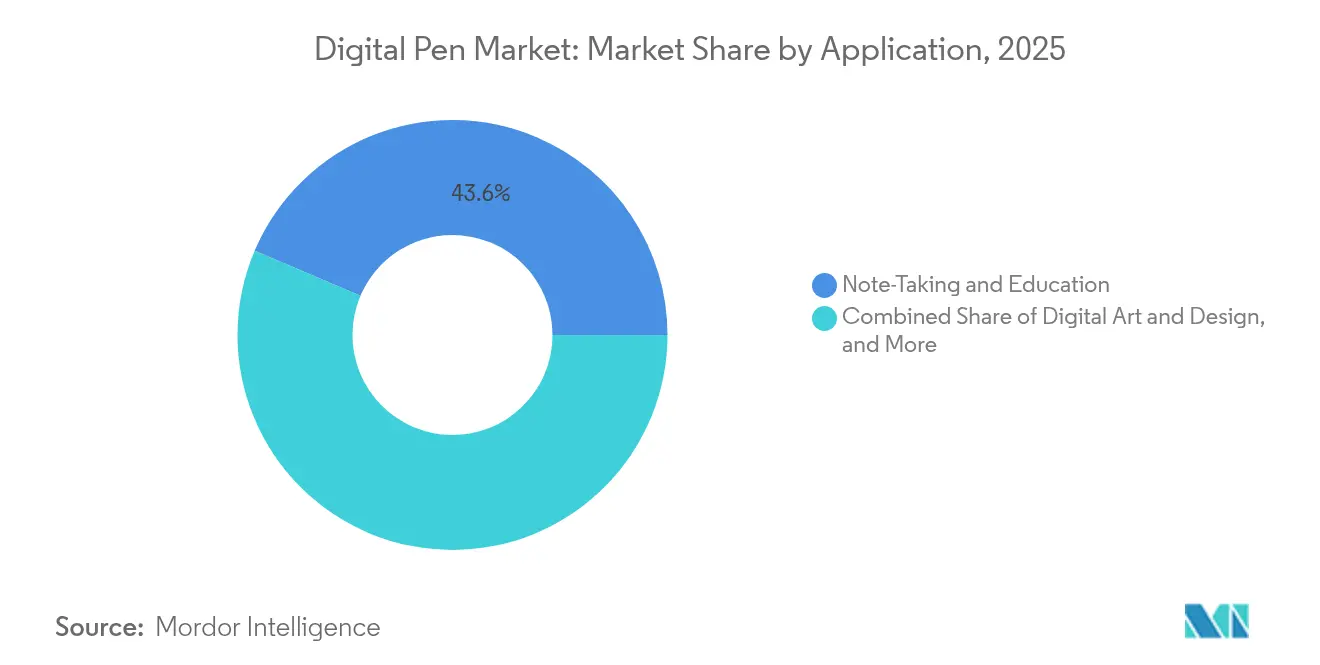
- By application, clinical and medical records captured 17.56% of the digital pen market size CAGR, surpassing note-taking and education at 43.60% share in 2025.
- By end-user industry, education held 31.25% of the digital pen market share in 2025, while healthcare is set to grow at a 12.05% CAGR to 2031.
- By geography, North America accounted for 37.15% of 2025 revenue, while Asia-Pacific is advancing at a 12.88% CAGR.
Note: Market size and forecast figures in this report are generated using Mordor Intelligence’s proprietary estimation framework, updated with the latest available data and insights as of 2026.
Global Digital Pen Market Trends and Insights
Drivers Impact Analysis*
| Driver | (~) % Impact on CAGR Forecast | Geographic Relevance | Impact Timeline |
|---|---|---|---|
| Rise of e-learning and digital note-taking | +3.5% | Global, with concentration in North America and Asia-Pacific | Medium term (2-4 years) |
| Popularity of digital art and graphic design | +2.8% | North America and Europe core, expanding to Asia-Pacific | Long term (≥ 4 years) |
| Integration of pens with 2-in-1 devices | +1.9% | Global, led by enterprise adoption in developed markets | Short term (≤ 2 years) |
| Pen-enabled e-signature compliance mandates | +1.2% | Europe and North America regulatory-driven | Medium term (2-4 years) |
| AI handwriting recognition for data capture | +0.8% | Asia-Pacific innovation hubs, spillover to global markets | Long term (≥ 4 years) |
| Growing multilingual content creation needs | +0.6% | Emerging markets, global diaspora | Long term (≥4 years) |
| Source: Mordor Intelligence | |||
Rise of E-learning and Digital Note-taking
Demand for precision input devices that blend analog familiarity with digital convenience has surged across schools and corporate training programs. Devices such as XP-Pen’s battery-free stylus tablets let educators annotate content in real time, enhancing interactivity and reducing reliance on paper. Venture funding in handwriting-centric platforms like Jotit underscores investor conviction that searchable, shareable written content improves retention and accessibility[1]FinSMEs, “Jotit raises USD 10M in seed funding,” finsmes.com. Seamless cloud sync turns every stroke into indexed data, shrinking administrative workloads while broadening access to assistive technologies for learners with diverse needs.
Popularity of Digital Art and Graphic Design
Creative professionals fuel premium demand by insisting on pressure sensitivity up to 16,384 levels and sub-millisecond latency. XP-Pen’s X3 Smart Chip Stylus shrinks initial activation force and cuts retraction distance to mimic brush feedback. Apple widened addressable markets by adding culturally specific virtual reed calligraphy strokes to the Apple Pencil Pro, targeting growth in the Middle East and South Asia. High-end buyers accept premium pricing, allowing brands to fund ongoing innovation in tilt detection, haptic feedback, and texture simulation technologies.
Integration of Pens with 2-in-1 Devices
Enterprise IT departments now specify stylus capability as standard in convertible laptops and tablets. Microsoft Surface deployments highlight productivity gains when inking coexists with keyboard and touch inputs. Wacom’s EMR platform supports battery-free pens that operate a few millimeters above the glass, delivering cursor previews and hover gestures without sacrificing battery life [2]Wacom Co. Ltd., “Technology Overview,” wacom.com. Cross-vendor initiatives to develop universal in-cell digitizer standards promise to reduce ecosystem fragmentation and smooth procurement cycles.
Pen-enabled E-signature Compliance Mandates
Healthcare, banking, and government agencies must capture legal signatures in digital form under frameworks like Europe’s eIDAS. Samsung positions the S-Pen as a secure signing instrument, meeting audit trail requirements and biometric authentication thresholds. Compliance budgets remain comparatively inelastic, insulating this segment from economic slowdowns and rewarding vendors that can bundle signature workflows with existing document management suites.
Restraints Impact Analysis*
| Restraint | (~) % Impact on CAGR Forecast | Geographic Relevance | Impact Timeline |
|---|---|---|---|
| High price of active-technology pens | -1.5% | Global, particularly price-sensitive emerging markets | Short term (≤ 2 years) |
| Cross-platform compatibility gaps | -0.9% | Global, affecting enterprise adoption rates | Medium term (2-4 years) |
| Lithium-battery air-freight restrictions | -0.3% | Global supply chain, regulatory compliance costs | Short term (≤ 2 years) |
| Legacy paper-based workflow inertia | -0.20% | SMEs in developing regions | Medium term (2-4 years) |
| Source: Mordor Intelligence | |||
High Price of Active-technology Pens
Advanced EMR and AES pens cost up to 10 times more than simple capacitive sticks, creating sticker shock for schools and small businesses. Component savings from scale remain offset by precision sensor arrays and controller ICs. Samsung and HiDeep’s battery-free R and D attempts to remove power-management circuits aim to close price gaps without losing pressure fidelity. Until costs decline, adoption will favor regions with subsidy programs or premium consumer segments.
Cross-platform Compatibility Gaps
Proprietary protocols impede stylus reuse across devices. Apple Pencil, Microsoft Surface Pen, and Wacom EMR each operate in isolated ecosystems, increasing total cost of ownership for enterprises that manage multiple operating systems. Although the Universal Stylus Initiative exists, major brands have been slow to relinquish lock-in advantages. The resulting uncertainty delays bulk upgrades, especially in mixed Windows-Android-iOS fleets where IT managers prefer standardized accessories.
*Our forecasts treat driver/restraint impacts as directional, not additive. The impact forecasts reflect baseline growth, mix effects, and variable interactions.
Segment Analysis
By Platform/Operating System: Android Dominance Faces iOS Innovation Challenge
Android retained 36.65% of 2025 revenue in the digital pen market, anchored by wide hardware choice, yet iOS is forecast to post 14.19% CAGR through 2031 as Apple’s integrated hardware-software model broadens stylus adoption. Android gains scale from entry-level tablets in education programs, but fragmentation in firmware support complicates app developers’ inking implementations. Windows devices focus on enterprise productivity with bundled pens in 2-in-1 laptops, while emerging multi-OS pens use USI standards to increase compatibility across ChromeOS and selected Android models.
Apple’s R and D spending of USD 7.9 billion per quarter underwrites new Pencil Pro capabilities such as haptic squeeze gestures that simplify tool selection without menus. Samsung counters with Galaxy S24 Ultra’s S Pen, co-engineered with Wacom to lower latency and extend hover distance. Enterprises experimenting with mixed fleets evaluate universal pens to avoid lock-in, yet full feature parity remains elusive due to proprietary firmware dependencies. The competitive narrative thus revolves around total experience rather than pen hardware alone, shaping future platform loyalty in the digital pen market.


By Technology: EMR Leadership Challenged by AES Innovation Surge
EMR claimed 41.75% of 2025 revenue in the digital pen market, earned through battery-free convenience and high sampling rates. The technology generates a magnetic field that detects pen location even before it touches the screen, enabling precise hover functions that artists value. Active Electrostatic solutions, however, will outpace at 15.47% CAGR as vendors integrate low-power piezo drivers like Boréas BOS1901 that cut consumption by 10-fold while adding rich haptic cues .
Camera-based pens remain niche, serving retrofit uses where display digitizers are absent. Accelerometer-based styli that work on plain paper address field workers but sacrifice pressure range. Samsung’s HiDeep partnership aims to fuse EMR energy harvesting with AES precision to blend strengths of both camps. If successful, hybrid architectures could redefine the digital pen market size for high-performance yet low-maintenance solutions.
By Application: Education Foundation Supports Healthcare Expansion
Note-taking and education accounted for 43.60% of 2025 revenue in the digital pen market, delivering scale economies and user familiarity that catalyze broader professional uptake. Clinical and medical record workflows, projected to expand at a 17.56% CAGR, will raise the digital pen market size for healthcare documentation as regulators mandate electronic capture of signatures and annotations. Digital art and design represents a premium-priced subset where 16,384-level pressure and 60-degree tilt translate to higher average selling prices.
E-signature workflows in banking and government bolster adoption by turning stylus input into legally binding acts. Industrial markup for field inspections emerges in rugged tablets, overcoming glove-use constraints through hover detection. Diversifying use cases dilute education budget exposure, cushioning revenue against cyclical academic funding pressures and fueling continuous R and D pipelines.
By End-user Industry: Education Base Enables Healthcare Transformation
Education generated 31.25% of the digital pen market share in 2025, cementing the base for future professional penetration. Government device subsidies and remote learning investments keep K-12 demand resilient. Healthcare, advancing at 12.05% CAGR, benefits from electronic health record mandates that need pen-level granularity for physician annotations. BFSI institutions integrate stylus-verified e-signatures into branch-less onboarding, while manufacturing uses pens for quality inspection logbooks in dusty shop-floor conditions.
Public-sector digitization drives procurement of secure stylus solutions compatible with national ID frameworks. Media and entertainment teams exploit advanced shading and color accuracy for animation workflows that shorten production cycles. The resulting cross-sector mesh diversifies revenue and buffers suppliers against industry-specific downturns, promoting stable cash flows for ongoing innovation in the digital pen industry.
Geography Analysis
North America delivered 37.15% of 2025 revenue in the digital pen market on the back of entrenched enterprise digitization, well-funded school districts, and high disposable incomes. Hospitals deploy pen-enabled EHR interfaces to speed charting while maintaining regulatory compliance, fostering recurring replacement cycles. Corporate buyers prioritize low latency and ecosystem integration, sustaining premium ASPs and encouraging vendors to bundle software subscriptions that deepen customer lock-in.
Asia-Pacific will post the fastest 12.88% CAGR by 2031 due to large-scale device rollouts in China and India, cost advantages in component manufacturing, and policy-driven classroom digitization. TSMC’s USD 165 billion Arizona-linked fab strategy exemplifies supply chain re-shoring that may mitigate geopolitical risk for US buyers while preserving East Asian cost leadership. Japanese and Korean OEMs pioneer battery-free EMR refinements, with rapid diffusion across domestic education pilots before spreading globally.
Europe records steady uptake through strict eIDAS signature requirements and enterprise document-management upgrades. Creative clusters in Germany, France, and the Nordics adopt high-spec pens for design studios, while automotive suppliers use stylus-enabled tablets for real-time quality audits on production lines. Government digitization grants reinforce uptake in schools and municipal services, reinforcing vendor positioning across public procurement channels.

Competitive Landscape
The digital pen market is moderately fragmented. Wacom’s four-decade pedigree and 3,000-plus patents anchor a formidable EMR moats, yet integrated device giants leverage vertically controlled ecosystems to tip the balance. Apple ties Pencil Pro features tightly to iPadOS, generating willingness to pay that lifts unit margins and funds aggressive R and D. Samsung balances in-house advances with licensed IP from Wacom to offer low-latency S-Pens across Galaxy products.
Emerging disruptors such as Nuwa Pen raised USD 1.65 million to commercialize AI-vision styli that digitize handwriting on any paper, highlighting investor appetite for platform-agnostic experiences. Boréas Technologies supplies piezo drivers enabling HD haptics at one-tenth the power draw, positioning component vendors as pivotal innovation catalysts. Supply chain realignment, including Arizona-based fabs, may reduce lead times and component shortages, giving North American OEMs resilience against Asia-centric disruptions. Competitive intensity now revolves around ecosystem breadth, AI handwriting accuracy, and battery-free breakthroughs rather than hardware alone.
The middle tier comprises XP-Pen, Huion, and Anoto, which target specific niches such as online art education or hybrid paper-digital workflows. Collaboration, rather than pure rivalry, defines parts of the landscape as OEMs license digitizer technology from Wacom even while challenging its market share in branded pen tablets. The convergence of hardware, software, and cloud services pushes legacy single-product firms to broaden portfolios or seek strategic alliances to sustain relevance.
Digital Pen Industry Leaders
Apple Inc.
Wacom Co., Ltd.
Microsoft Corporation
Samsung Electronics Co., Ltd.
Huion Animation Technology Co., Ltd.
- *Disclaimer: Major Players sorted in no particular order

Recent Industry Developments
- April 2024: Anoto Group AB unveiled the inq line of smartpens, notebooks, and software, positioning the brand at the intersection of traditional ink feel and digital capture.
- March 2025: XP-Pen launched the Magic Note Pad with a 3-in-1 X-Paper display and X3 Pro Pencil 2 stylus offering 16,384 pressure levels for color handwriting.
- January 2025: Jotit raised USD 10 million in seed funding led by Owl Ventures to scale its handwriting-centric educational platform that blends analog input with real-time collaboration.
- December 2024: Wacom refreshed the Intuos Pro pen tablet, adding Pro Pen 3 technology, customizable buttons, and Bluetooth multi-device support.


Research Methodology Framework and Report Scope
Market Definitions and Key Coverage
Our study defines the digital pen market as all electronic writing instruments that capture handwriting or free-form sketches and transmit, store, or display the input on a connected device in real time or near real time. The hardware covered includes active-capacitive, electromagnetic resonance, camera-based, accelerometer, and hybrid stylus formats that ship either stand-alone or bundled with tablets, convertibles, and large interactive screens; accessories without embedded electronics are not counted.
Scope exclusion: devices that operate only as passive touch pointers or graphics tablets shipped without an independent pen are outside our scope.
Segmentation Overview
- By Platform / Operating System
- Android
- Windows
- iOS
- Multi-OS / Universal
- By Technology
- EMR (Electro-Magnetic Resonance)
- AES (Active Capacitive)
- Camera-Based
- Accelerometer-Based
- Trackball / Others
- By Application
- Note-Taking and Education
- Digital Art and Design
- e-Signature and Documentation
- Clinical and Medical Records
- Industrial Mark-up / Field Service
- By End-user Industry
- Education
- BFSI
- Healthcare
- IT and Telecom
- Manufacturing
- Government and Public Sector
- Media and Entertainment
- By Geography
- North America
- United States
- Canada
- Mexico
- South America
- Brazil
- Argentina
- Rest of South America
- Europe
- Germany
- United Kingdom
- France
- Italy
- Spain
- Russia
- Rest of Europe
- Asia-Pacific
- China
- Japan
- India
- South Korea
- Australia and New Zealand
- Rest of Asia-Pacific
- Middle East and Africa
- Middle East
- Saudi Arabia
- United Arab Emirates
- Turkey
- Rest of Middle East
- Africa
- South Africa
- Nigeria
- Egypt
- Rest of Africa
- Middle East
- North America
Detailed Research Methodology and Data Validation
Primary Research
Our team interviewed educators rolling out one-to-one device programs, healthcare informatics heads, procurement managers in BFSI, and component suppliers across North America, Europe, and Asia Pacific. These conversations helped us stress-test adoption curves, seasonality, and price elasticity that were only partially visible in secondary data.
Desk Research
We began with publicly available statistics from bodies such as the International Telecommunication Union, US Census Bureau, Eurostat, and China's Ministry of Industry and Information Technology, which offer baseline indicators on connected device penetration and education digitization. Trade association white papers from the Consumer Technology Association, World Federation of the Sporting Goods Industry, and handwriting digitization journals added shipment ratios and use-case depth. Company 10-Ks, investor decks, and patent filings were mined through D&B Hoovers and Dow Jones Factiva to benchmark vendor revenue mix, average selling prices, and technology roadmaps. Our analysts then extracted customs data and import codes through Volza to validate regional flows of smart stylus hardware. This list is illustrative, as many other secondary sources supported data collection, cross-checks, and context building.
Market-Sizing & Forecasting
A top-down device-pool reconstruction anchors the model. Installed bases of tablets, convertibles, and large interactive displays are multiplied by stylus attach or replacement rates derived from primary interviews and then reconciled with customs shipment totals. Select bottom-up checks, such as sampled vendor revenue roll-ups and channel audits, ensure internal consistency before adjustments. Key variables tracked include classroom tablet penetration, electronic medical record compliance deadlines, active-stylus attach rates on new Windows convertibles, average selling price progression, and disposable income indices. Multivariate regression, combined with scenario analysis on education funding and healthcare digitization policies, produces the five-year forecast line while gap handling rules cap unexplained variances.
Data Validation & Update Cycle
Outputs undergo anomaly screening, peer review, and senior sign-off. Mordor analysts refresh every twelve months and trigger interim updates if regulatory shifts, large design wins, or supply disruptions change market dynamics. Before publication, we rerun late-breaking news checks so clients receive a current baseline.
Why Mordor's Digital Pen Baseline Commands Reliability
Published estimates differ because research houses choose dissimilar product scopes, attach-rate assumptions, and refresh cadences. We acknowledge that divergence upfront and preview the usual gap drivers before benchmarking.
Key gaps often arise when other publishers exclude bundled active pens, assume linear price drops, or rely on aged secondary data without validating with school district or hospital buyers; these choices compress their totals or inflate growth curves, whereas our continuous feedback loop keeps inputs current.
Benchmark comparison
| Market Size | Anonymized source | Primary gap driver |
|---|---|---|
| USD 3.35 B (2025) | Mordor Intelligence | - |
| USD 2.91 B (2024) | Global Consultancy A | excludes bundled pens and uses static ASP path |
| USD 1.37 B (2024) | Industry Association B | focuses only on active technology and limited geography |
| USD 0.81 B (2024) | Regional Consultancy C | relies chiefly on historic survey panels, infrequent refresh |
These comparisons show that our disciplined variable selection, balanced top-down and bottom-up checks, and annual refresh cadence give decision-makers a dependable, transparent baseline that stands up to client scrutiny and real-world audits.


Key Questions Answered in the Report
What is the current value of the digital pen market?
The digital pen market is valued at USD 3.81 billion in 2026 and is projected to reach USD 7.19 billion by 2031.
Which industry segment is growing fastest for digital pens?
Healthcare is the fastest-growing end-user segment, expanding at a 12.05% CAGR as electronic health record mandates boost demand for pen-enabled documentation.
What technology dominates the digital pen market today?
Electromagnetic resonance technology holds 41.75% of 2025 revenue due to battery-free operation and high precision, though active electrostatic solutions are growing faster.
Which region is expected to post the highest growth?
Asia-Pacific is forecast to grow at a 12.88% CAGR through 2031, driven by large-scale education deployments and manufacturing cost advantages.
Who are the leading companies in the digital pen market?
Wacom, Apple, and Samsung lead through proprietary technology, extensive patents, and ecosystem control, while emerging players like Nuwa Pen bring AI-centric innovations.
Why are battery-free pens important?
Battery-free designs cut maintenance costs, avoid lithium freight restrictions, and offer perpetual readiness, making them attractive for education and enterprise fleets.
Page last updated on:


