Digital Imaging Market Size and Share
Market Overview
| Study Period | 2020 - 2031 |
|---|---|
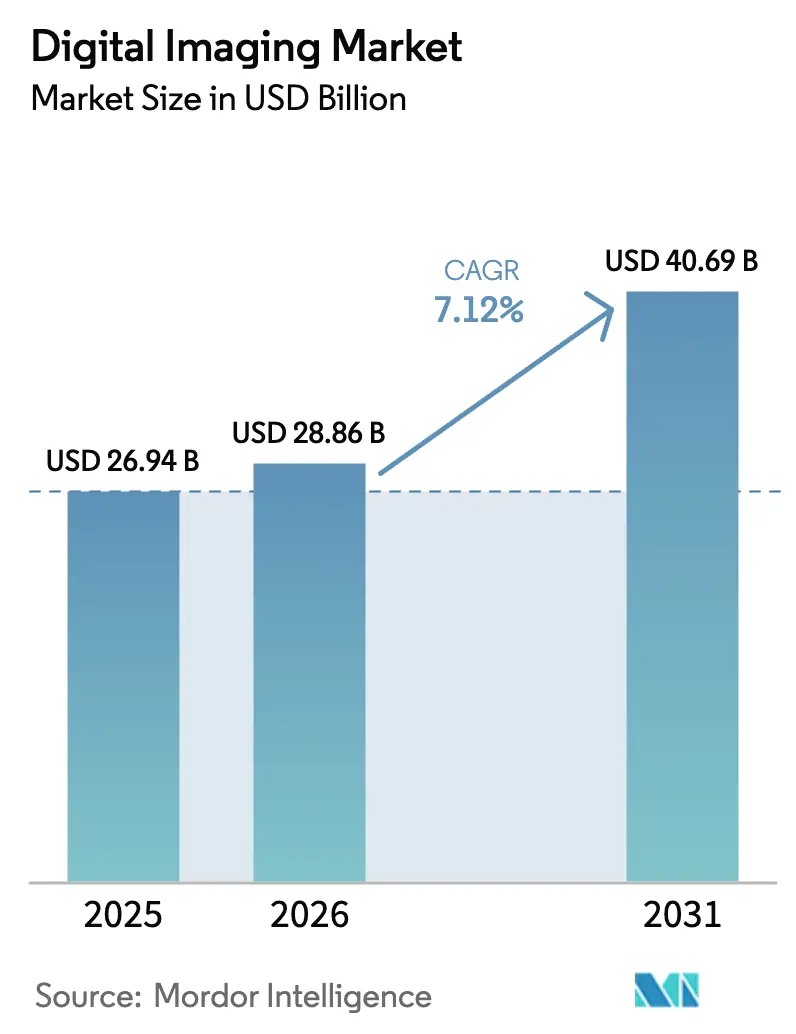
| Market Size (2026) | USD 28.86 Billion |
| Market Size (2031) | USD 40.69 Billion |
| Growth Rate (2026 - 2031) | 7.12% CAGR |
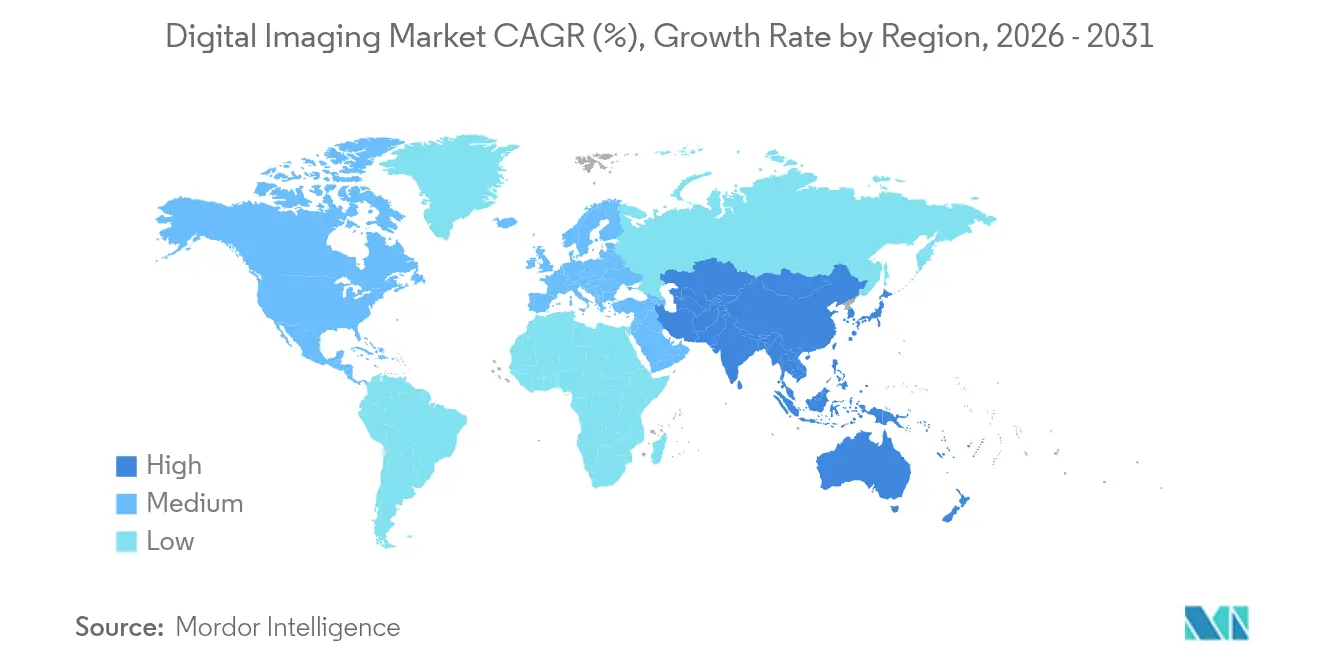
| Fastest Growing Market | Asia Pacific |
| Largest Market | North America |
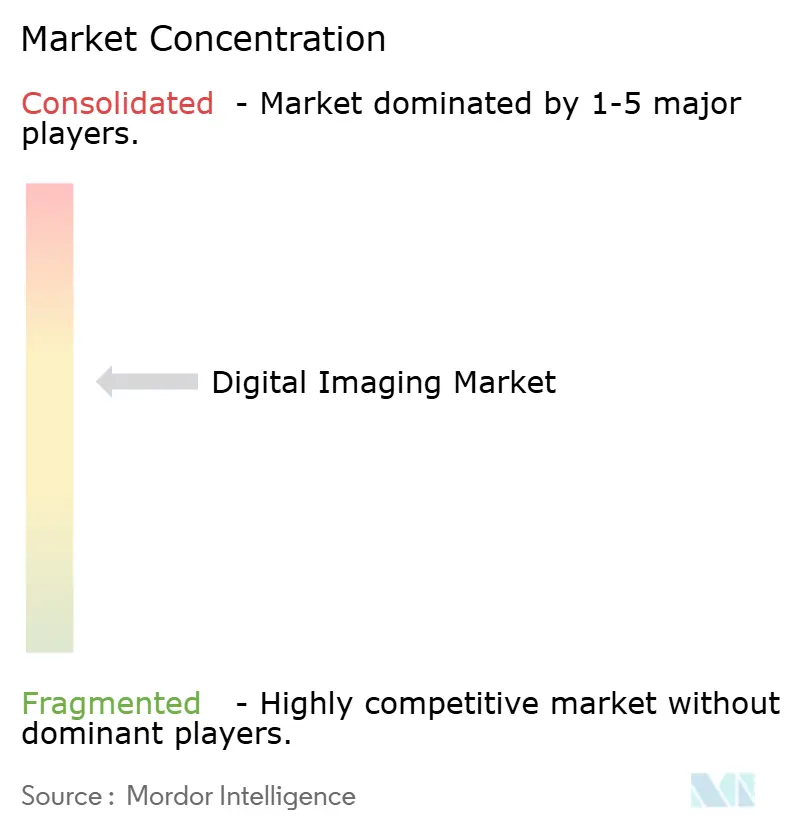
| Market Concentration | Medium |
Major Players *Disclaimer: Major Players sorted in no particular order Image © Mordor Intelligence. Reuse requires attribution under CC BY 4.0. | |
Digital Imaging Market Analysis by Mordor Intelligence
digital imaging market size in 2026 is estimated at USD 28.86 billion, growing from 2025 value of USD 26.94 billion with 2031 projections showing USD 40.69 billion, growing at 7.12% CAGR over 2026-2031. Growth stems from lower sensor prices, stronger AI algorithms, and expanding Industry 4.0 deployments that push vision systems from isolated inspection points to fully embedded production controls. Software-defined imaging platforms are lengthening hardware life while opening new revenue pools for analytics-driven upgrades. North America keeps the lead thanks to sustained healthcare and industrial automation spending, whereas APAC is setting the growth pace as factories scale robotics and governments fund digitalization. Technology advances such as quantum-dot SWIR detectors and compact LiDAR units are broadening inspection use cases, while stricter quality mandates in high-value industries heighten demand for metrology-grade resolution. Competitive pressure is intensifying as semiconductor firms enter end-to-end offerings and software specialists build ecosystems that shift value creation away from legacy hardware.
Key Report Takeaways
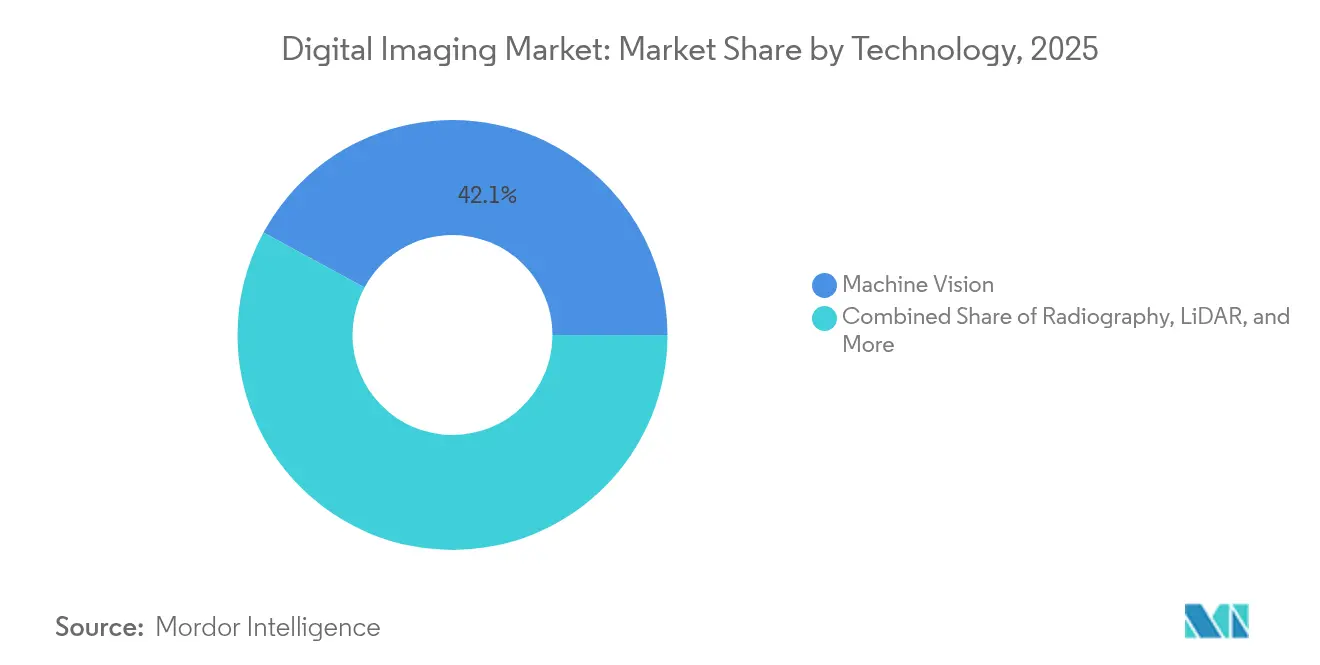
- By technology, Machine Vision led with 42.10% of the digital imaging market share in 2025; LiDAR is projected to rise at a 14.66% CAGR through 2031.
- By industry, Automotive held 23.55% of the digital imaging market size in 2025, while Healthcare and Life Sciences is set to grow fastest at a 12.74% CAGR during 2026-2031.
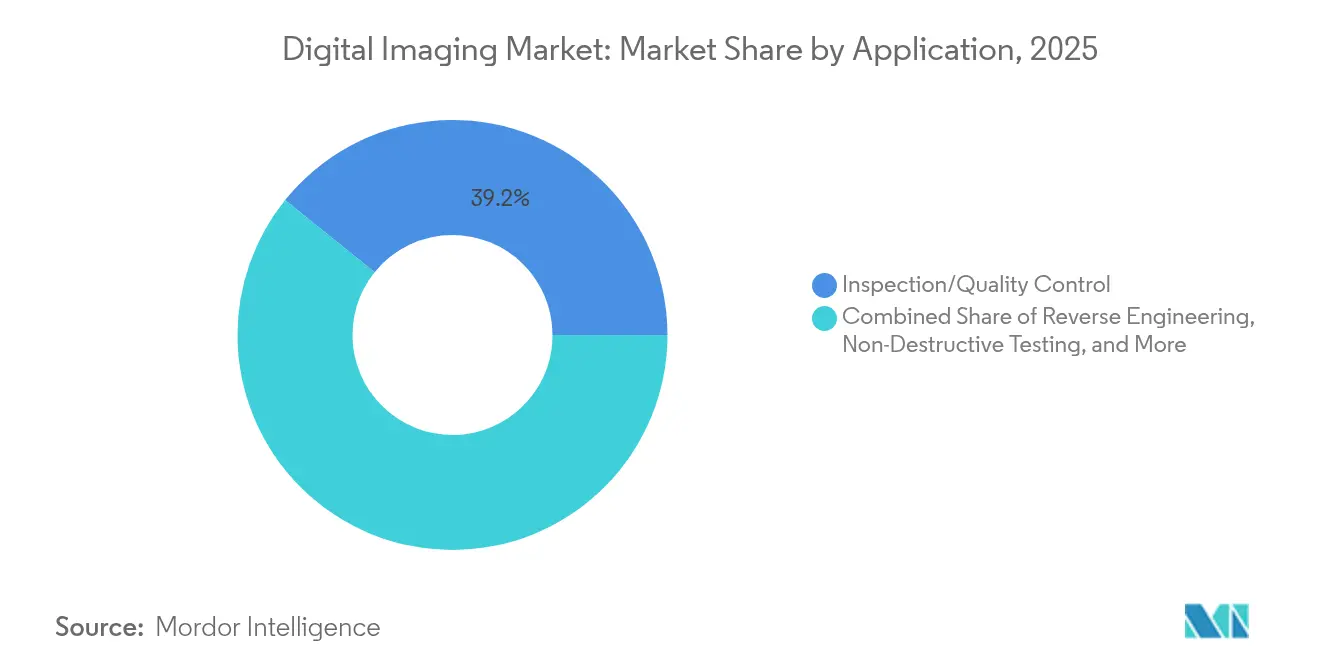
- By application, Inspection and Quality Control commanded a 39.20% share of the digital imaging market size in 2025, whereas Non-Destructive Testing is progressing at a 13.45% CAGR to 2031.
- By component, Hardware represented 55.10% of the digital imaging market size in 2025; Software is expanding the quickest at a 11.96% CAGR.
- By geography, North America contributed 34.55% of the digital imaging market in 2025, yet Asia-Pacific is forecast to lead growth with an 11.32% CAGR over the same horizon.
Note: Market size and forecast figures in this report are generated using Mordor Intelligence’s proprietary estimation framework, updated with the latest available data and insights as of 2026.
Global Digital Imaging Market Trends and Insights
Driver Impact Analyis*
| Driver | (~) % Impact on CAGR Forecast | Geographic Relevance | Impact Timeline |
|---|---|---|---|
| Industry 4.0 automation accelerates machine-vision uptake | +2.1% | Global, with concentration in North America, Europe, and East Asia | Medium term (2-4 years) |
| Smartphone-grade mini-sensors expand consumer base | +1.3% | Global, with early adoption in North America and Asia-Pacific | Short term (≤ 2 years) |
| Stringent quality mandates spur high-resolution metrology | +1.7% | Europe, North America, Japan, South Korea | Medium term (2-4 years) |
| Falling CMOS ASPs widen SME adoption | +1.4% | Global, with strongest impact in emerging economies | Short term (≤ 2 years) |
| Quantum-dot SWIR sensors enable niche inspection | +0.8% | North America, Europe, Japan | Medium term (2-4 years) |
| EU Digital-Product-Passport drives 3-D imaging demand | +0.9% | Europe, with spillover to global export markets | Long term (≥ 4 years) |
| Source: Mordor Intelligence | |||
Industry 4.0 Automation Accelerates Machine-Vision Uptake
- Machine-vision engines are shifting from post-production checks to real-time process control, empowering robotic cells to spot sub-micron flaws and auto-correct tooling on the fly. Leading suppliers now combine edge accelerators with high-speed cameras capable of capturing millisecond-level events, which broadens use in EV battery welding and mobile device durability testing [1]SinceVision, “Application of High-Speed Machine Vision in Industrial Inspection,” qualitymag.com. Manufacturers expect the payback period to shorten as vision-guided robots curb scrap, shrink downtime, and feed quality data directly into MES dashboards. Regulatory audits reward in-line vision records, making proof-of-compliance easier than manual logs. Rising adoption in small-batch electronics and medical tooling shows the technology’s versatility beyond mass-production. Combined with maturing no-code AI training tools, machine vision is moving from specialist domains into standard plant utilities, supporting steady expansion of the digital imaging market.
Smartphone-Grade Mini-Sensors Expand Consumer Base
Global handset production has driven enormous scale in backside-illuminated CMOS dies, slashing average selling prices and letting industrial firms repurpose high-resolution modules for factory-floor tasks once reserved for costly specialty cameras. Integrators bundle these mini-sensors into plug-and-play kits, enabling low-volume workshops to deploy vision for under USD 1,000. Open-source firmware and readily available optics speed prototyping, while PoE networking makes retrofits simple. Consumer-derived sensor roadmaps guarantee multi-year supply continuity, allaying fears of obsolescence. As hobby robotics and maker communities experiment, fresh talent pipelines emerge for industry adoption. This democratization enlarges the digital imaging market by drawing in SMEs that previously relied on manual inspection alone.
Stringent Quality Mandates Spur High-Resolution Metrology
Ever-tighter tolerances in semiconductor packaging, medical implants, and aerospace fasteners require cameras that deliver accurate characterization down to nanometer scales. Version 4.0 of the EMVA 1288 standard, now elevated to ISO status, introduces non-linear camera metrics and extended spectral testing, giving buyers objective comparisons across vendors. Clearer benchmarks reduce procurement risk, prompting faster upgrades in regulated sectors. Automated defect classification, aided by transformer-based AI models, cuts false-negative rates and streamlines documentation for auditors. The trend also encourages optical component makers to develop distortion-free lenses certified against harmonized protocols. Collectively, compliance pressures and process-integrity goals fuel sustained investment in high-resolution systems, elevating the digital imaging market outlook.
Falling CMOS ASPs Widen SME Adoption
Volume scaling at 300-mm fabs plus design reuse across consumer, automotive, and security verticals keep lowering die costs. Entry-level vision rigs now start below USD 500, as shown by webcam-based CNC machine monitors that let operators track OEE metrics without costly PLC retrofits. Affordable kit lowers proof-of-concept hurdles, letting small plants validate ROI within weeks. Cloud-linked dashboards give owners real-time visibility, often unlocking insurance discounts tied to predictive maintenance compliance. As productivity gains become evident, many SMEs budget for higher-grade cameras and analytics, creating a staircase effect that enlarges the digital imaging market at each step.
Restraint Impact Analysis*
| Restraint | (~) % Impact on CAGR Forecast | Geographic Relevance | Impact Timeline |
|---|---|---|---|
| High cap-ex and integration complexity | -1.2% | Global, with higher impact in emerging markets | Medium term (2-4 years) |
| Petabyte-scale data management burden | -0.9% | Global, with concentration in data-intensive applications | Medium term (2-4 years) |
| Cyber-security risks to networked vision | -0.7% | Global, with higher impact in critical infrastructure and defense | Short term (≤ 2 years) |
| E-waste scrutiny of short hardware lifecycles | -0.6% | Europe, North America, with growing impact in APAC | Long term (≥ 4 years) |
| Source: Mordor Intelligence | |||
High Cap-ex and Integration Complexity
Deploying line-scan cameras, controlled lighting, and ruggedized cabling can cost several million USD for a midsize production hall. Retrofitting legacy conveyors demands mechanical redesigns and downtime penalties that strain cash-flow in plants with slim operating margins. Expertise gaps add consulting fees, because tuning parameters such as polarization angles or strobe timing often fall outside local maintenance skill sets. Vendors like Basler respond with modular, pre-calibrated bundles, yet IT teams still face data-schema harmonization when linking vision servers to MES or ERP stacks. This multidimensional complexity slows project approvals, trimming near-term growth in sections of the digital imaging market.
Cyber-Security Risks to Networked Vision
Cameras once isolated on closed networks now stream imagery to cloud AI engines, widening the attack surface. Ransomware directed at vision nodes can halt throughput or leak proprietary process visuals that reveal trade secrets. Defense, pharma, and critical infrastructure operators adopt zero-trust segmentation, hardware root-of-trust chips, and continuous model-integrity checks, adding cost and latency to deployments. Regulators in the United States and Europe increasingly demand cybersecurity assessments as part of validation dossiers, extending timelines. Heightened security spend partially offsets hardware price declines, tempering adoption curves inside security-sensitive slices of the digital imaging market.
*Our forecasts treat driver/restraint impacts as directional, not additive. The impact forecasts reflect baseline growth, mix effects, and variable interactions.
Segment Analysis
By Technology: LiDAR Disrupts Traditional Imaging Paradigms
Machine Vision captured 42.10% of the digital imaging market share in 2025 as smart factories embedded vision nodes across pick-and-place lines, optical gauging stations, and robotic weld cells. LiDAR, while still smaller in revenue, is forecast to post a 14.66% CAGR through 2031 on the back of autonomous mobility, infrastructure digital twins, and precision agriculture. Solid-state architectures now ship in wafer-level volumes, driving unit costs down and improving vibration resistance for industrial trucks.
LiDAR’s expanding reach boosts mapping accuracy for brownfield construction and enhances safety envelopes on collaborative robots. Multi-spectral LiDAR blends reflectivity and color channels, enabling urban planners to assess canopy health and heat islands in one pass. As component miniaturization continues, handheld LiDAR scanners enter facility-maintenance workflows, further broadening the digital imaging market. Radiography and hyperspectral imaging maintain focused footholds in healthcare and agritech respectively, yet cross-fertilization of AI models enables platform synergies that accelerate time-to-insight across modalities.


By Industry: Healthcare Imaging Accelerates Beyond Traditional Boundaries
Automotive retained a 23.55% share of the digital imaging market size in 2025 as ADAS cameras, LiDAR units, and in-plant QC systems proliferated. Healthcare and Life Sciences is set to register a 12.74% CAGR, propelled by photon-counting CT, whole-body MRI, and AI-triaged radiology workflows. Cloud PACS platforms and subscription-based software reduce upfront investment, encouraging clinics in emerging economies to modernize diagnostic fleets.
Precision oncology drives demand for sub-cellular imaging that guides targeted therapies, while digital pathology gains momentum through whole-slide scanners reimbursed under new telehealth codes. Manufacturing, ranked third, leans on contact image sensors for fast PCB trace checks, and oil and gas pipelines deploy computed radiography for weld validation without shutting flow. Aerospace primes rely on volumetric CT during 3D-printed part certification, ensuring structural integrity and tracking porosity trends—a testament to the widening scope of the digital imaging market.
By Application: Non-Destructive Testing Redefines Quality Assurance
Inspection / Quality Control held 39.20% of the digital imaging market size in 2025, underscoring its role as the cornerstone of modern production management. Non-Destructive Testing is forecast to outpace all other uses at a 13.45% CAGR, benefiting from faster volumetric reconstruction algorithms that minimize exposure cycles in aerospace and energy sectors. Carbon-fiber airframes, additive-manufactured engine nozzles, and hydrogen tanks all require intricate inspection regimens that leave parts intact for assembly.
Security and Surveillance moves toward multimodal fusion, integrating visible, SWIR, and thermal feeds with transformer-driven analytics for crowded-venue monitoring. Reverse Engineering, traditionally a niche, gains traction as generative design software ingests high-fidelity point clouds, shortening iteration cycles. Digital twins integrate application data into dynamic models, enabling predictive maintenance across warehousing and logistics. Each of these use cases adds breadth to the digital imaging market and signals its shift from passive recording toward active decision support.
By Component: Software Innovation Outpaces Hardware Growth
Hardware commanded a 55.10% share of the digital imaging market size in 2025, but software revenues are projected to rise 11.96% annually as cloud-native pipelines and edge inferencing engines unlock new service layers. Vendors increasingly offer containerized vision stacks that decouple processing from camera silos, letting users orchestrate AI workloads on mixed fleets. Integration toolkits accelerate time-to-value by automapping metadata across MES and ERP systems.
On-device transformers shrink latency for pick-and-place arms and reduce bandwidth overhead. Meanwhile, sensor innovators push quantum-dot SWIR arrays that monolithically integrate with CMOS readouts, shrinking BoM and easing thermal budgets. Service providers bundle lifecycle analytics, calibration, and cybersecurity audits, capturing recurring income as clients outsource vision upkeep. This service-centric movement widens profit pools beyond hardware margins, reinforcing the structural evolution of the digital imaging market.
Geography Analysis
North America preserved its 34.55% stake in the digital imaging market during 2025, due to active investments in AI-enhanced radiology, defense optics, and smart-factory conversions. Federal grants for rural tele-imaging and the CHIPS Act’s incentives for domestic sensor lines sustain pipeline growth. LiDAR adoption in mobility clusters from California to Michigan fuels contiguous demand for mapping software and validation services, while quantum-dot research hubs in Colorado and New York shorten commercialization cycles.
The Asia-Pacific region is charting an 11.32% CAGR, propelled by China’s 14th Five-Year Plan targets on smart manufacturing, sustained semiconductor capital outlays in Taiwan, and South Korea’s advanced electronics bases. Japan pioneers contact image sensors for battery inspection, whereas India subsidizes machine-vision retrofits in SME foundries. The 25th China International Optoelectronic Exposition showcased wafer-level SWIR sensors and low-power LiDAR, attesting to regional supply-chain self-sufficiency. Healthcare spend is climbing as Asia’s middle class seeks advanced diagnostics, drawing international imaging OEMs to co-manufacture and localize software interfaces.
Europe retains a sizeable position through regulatory catalysts such as the Digital Product Passport, which mandates granular traceability down to component provenance in high-impact goods. This requirement escalates 3-D imaging rollouts in electronics, textiles, and eventually consumer appliances, extending the digital imaging market’s reach into compliance-tech budgets . Germany’s automotive tier-ones spearhead multi-spectral QC rigs, while Scandinavia focuses on green-energy asset inspection with drone-mounted LiDAR. Harmonized standards like ISO-EMVA 1288 nurture an integrated supplier ecosystem, ensuring interoperability across the bloc.

Competitive Landscape
The digital imaging market is moderately fragmented, with legacy titans and insurgent specialists vying for share across hardware, software, and services. Hexagon AB deepens industrial metrology through acquisitions that fold laser trackers and photogrammetry into unified platforms, while Teledyne extends its sensor breadth with back-illuminated global shutters tuned for fast-moving targets. Keyence leverages direct sales to penetrate midsize plants before distributors react, bundling AI-ready vision units with PLCs for one-stop automation.
Semiconductor vendors enter full-stack plays: onsemi’s purchase of SWIR Vision Systems merges quantum-dot nanocrystal deposition with mature CMOS lines to build cost-effective sensors for industrial and driver-monitoring domains. Software-first firms monetize model updates and predictive analytics, eroding value pools once anchored in bespoke optics. Standards elevation to ISO status raises technical bars and may accelerate consolidation because compliance investments favor well-capitalized incumbents.
Regional contenders explore niche leadership: Basler pushes modular kits tailored for SMEs, while CSEM debuts quantum-dot imagers for medical X-ray panels that challenge a-Si dominance [3]CSEM, “Quantum Dot CMOS Image Sensor for X-Ray and SWIR,” csem.ch . Emberion’s wafer-level SWIR arrays open thermal-budget-friendly options for recycling, mining, and precision agri-sorters. Service integrators differentiate by cybersecurity hardening and vertical domain libraries, signaling that end-users now value turnkey performance over stand-alone pixels.
Digital Imaging Industry Leaders
Hexagon AB
Cognex Corporation
Teledyne Technologies (FLIR)
Keyence Corporation
Nikon Corporation
- *Disclaimer: Major Players sorted in no particular order

Recent Industry Developments
- May 2025: Teledyne Technologies launched new industrial image sensors aimed at high-speed, low-noise applications across factory and scientific markets.
- May 2025: CSEM introduced a quantum-dot CMOS image sensor for X-ray and SWIR imaging, promising higher sensitivity with reduced dose requirements.
- February 2025: Emberion released SWIR sensors covering 400-2000 nm, producing up to 100 imagers per 8-inch wafer to cut per-unit costs for industrial inspection.
- January 2025: Izotropic Corporation outlined milestones for FDA approval of its IzoView breast CT system designed for dense-tissue imaging.


Research Methodology Framework and Report Scope
Market Definitions and Key Coverage
Mordor Intelligence defines the digital imaging market as all hardware, software, and services that transform optical, X-ray, LiDAR, or acoustic signals into pixel-based files that can be stored, processed, or transmitted across industrial, medical, and consumer environments. Solutions covered range from machine-vision cameras on automotive lines to radiography systems inside hospitals and LiDAR rigs used for infrastructure surveys.
Scope Exclusion: Film-based or analog capture devices, standalone photo-editing apps, and bespoke defense-grade imaging platforms sit outside our numbers.
Segmentation Overview
- By Technology
- Machine Vision
- Radiography
- LiDAR
- Metrology
- Hyperspectral Imaging
- By Industry
- Consumer Electronics
- Automotive
- Oil and Gas
- Aerospace
- Power and Energy
- Manufacturing
- Healthcare and Life Sciences
- Logistics and Warehousing
- Others
- By Application
- Inspection / Quality Control
- Reverse Engineering
- Surveying and Mapping
- Non-Destructive Testing
- Security and Surveillance
- By Component
- Hardware (Cameras, Sensors, Optics)
- Software (Vision, AI/Analytics)
- Services (Integration, Maintenance)
- By Geography
- North America
- United States
- Canada
- Mexico
- South America
- Brazil
- Argentina
- Rest of South America
- Europe
- Germany
- United Kingdom
- France
- Italy
- Spain
- Russia
- Rest of Europe
- Asia-Pacific
- China
- Japan
- South Korea
- India
- Rest of Asia-Pacific
- Middle East and Africa
- Middle East
- Saudi Arabia
- UAE
- Turkey
- Rest of Middle East
- Africa
- South Africa
- Rest of Africa
- Middle East
- North America
Detailed Research Methodology and Data Validation
Primary Research
We interviewed production managers at auto OEMs in Germany, non-destructive testing specialists across Texas and Osaka, and radiologists from multi-site hospital chains in India. These conversations validated installed-base estimates, average selling prices, LiDAR adoption triggers, and software attach rates, allowing us to refine provisional desk-research ranges.
Desk Research
Our analysts first mapped the demand universe using freely available tier-1 sources such as United States Census Bureau production indices, Eurostat trade codes for HS-903180 and HS-902214, and patent families mined through Questel that flag emerging sensor architectures. Industry-level price lists from SEC 10-K filings, annual quality reports from the International Atomic Energy Agency for radiography, and guidance published by the International Federation of Robotics added volume, price, and regulatory context. Select subscription sets, including D&B Hoovers cost curves for camera suppliers and Dow Jones Factiva news flows, completed the secondary view. The list above is illustrative; many additional outlets informed cross-checks and clarifications.
Market-Sizing & Forecasting
A blended top-down model translates global output of target industries into an addressable imaging demand pool, rebuilt through metrics such as automotive light-vehicle assemblies, annual CT scanner shipments, smart-factory capex, and sensor cost erosion. Bottom-up spot rolls, supplier revenue roll-ups, channel checks, and sampled ASP × unit audits are then used to stress-test totals. Forecasts to 2030 rely on multivariate regression that links demand to macro indicators (IP index, capital goods orders), technology markers (imager pixel density roadmap), and policy signals (EU MDR timelines). Where bottom-up gaps appear, we interpolate using historical penetration curves and verified bill-of-material splits.
Data Validation & Update Cycle
Outputs pass a three-layer peer review, variance thresholds trigger root-cause audits, and flagged anomalies loop back to respondents. Reports refresh annually; material events such as sensor shortages can prompt interim revisions. A final analyst pass is conducted days before client delivery so stakeholders receive the latest view.
Why Mordor's Digital Imaging Baseline Is Dependable
Published estimates often diverge because firms embrace different scope filters, refresh cadences, and price assumptions. By anchoring our base year to multisector production datasets and reconciling them with live supplier interviews, we reduce distortion from single-segment weighting.
Key gap drivers include other publishers limiting scope to industrial inspection, reporting constant-currency values without mid-year FX alignment, or projecting volume using straight-line CAGR rather than component-level regressions that capture sensor cost compression. Our six-month desk-to-field refresh cycle further narrows drift.
Benchmark comparison
| Market Size | Anonymized source | Primary gap driver |
|---|---|---|
| USD 26.94 B (2025) | Mordor Intelligence | - |
| USD 30.77 B (2025) | Global Consultancy A | Excludes medical radiography hardware price erosion and applies 2023 FX rates |
| USD 2.28 B (2024) | Regional Consultancy B | Focuses only on machine-vision systems, omits software and services |
| USD 38.26 B (2024) | Trade Journal C | Uses headline device shipments but no ASP normalization across LiDAR tiers |
The comparison shows that our disciplined scope, variable-level modeling, and timely updates deliver a balanced, transparent baseline that decision-makers can trace back to clearly documented inputs and repeatable steps.


Key Questions Answered in the Report
What is the projected value of the digital imaging market by 2031?
The digital imaging market is expected to reach USD 40.69 billion by 2031, reflecting a 7.12% CAGR over 2026-2031.
Which technology segment is growing the fastest?
LiDAR is forecast to grow at a 14.66% CAGR, driven by autonomous mobility, infrastructure mapping, and precision agriculture.
Why is Asia-Pacific considered the fastest-growing region?
Manufacturing expansion, rising healthcare spend, and proactive government digitalization programs lift Asia-Pacific’s digital imaging adoption, supporting an 11.32% CAGR through 2031.
How are falling CMOS prices influencing the digital imaging market?
Lower sensor ASPs let SMEs deploy entry-level vision systems, widening the customer base and accelerating upgrades to higher-performance cameras later.
What is the key restraint facing wider deployment?
High capital expenditure and integration complexity slow projects, especially in cost-sensitive plants that lack in-house vision expertise.
Page last updated on:


