Digital Currency Market Size and Share
Market Overview
| Study Period | 2020 - 2031 |
|---|---|
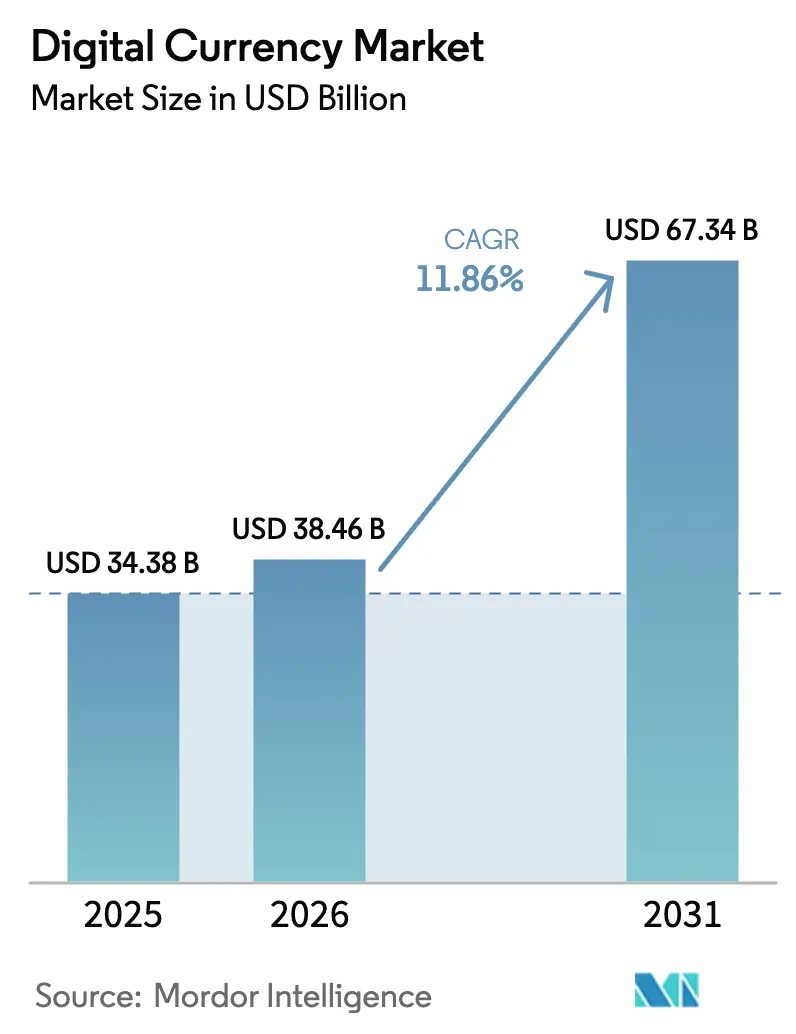
| Market Size (2026) | USD 38.46 Billion |
| Market Size (2031) | USD 67.34 Billion |
| Growth Rate (2026 - 2031) | 11.86% CAGR |
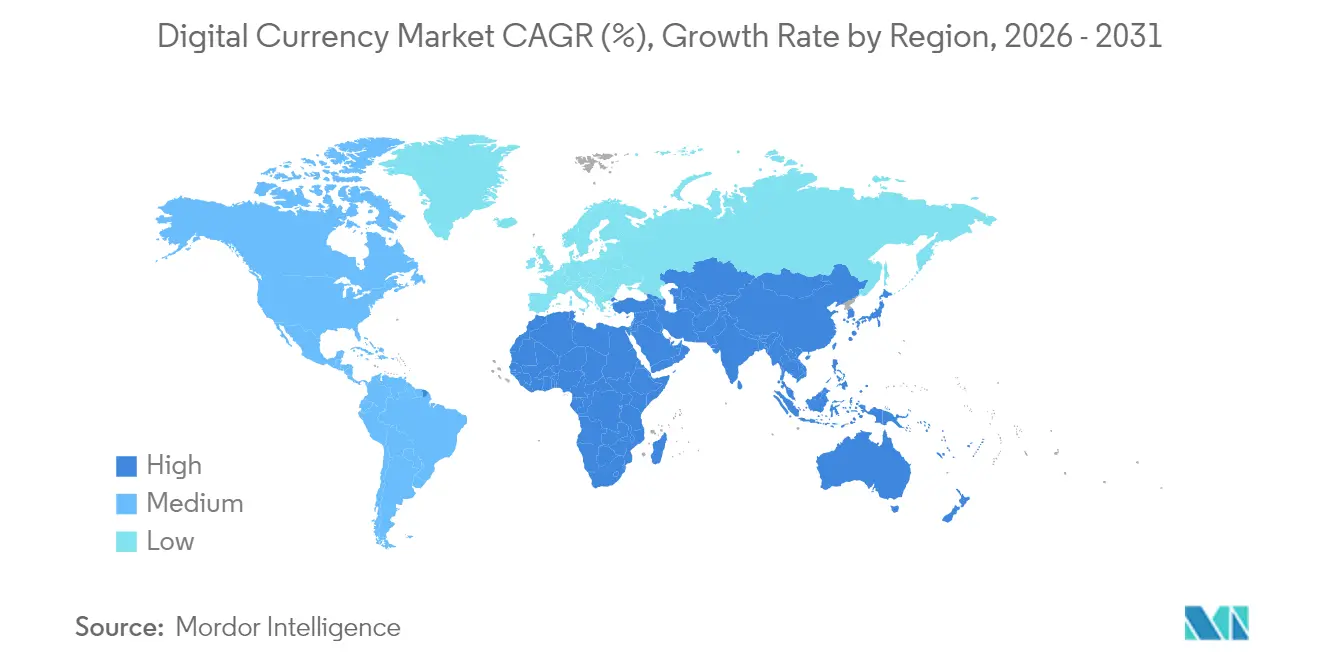
| Fastest Growing Market | Middle East and Africa |
| Largest Market | Asia Pacific |
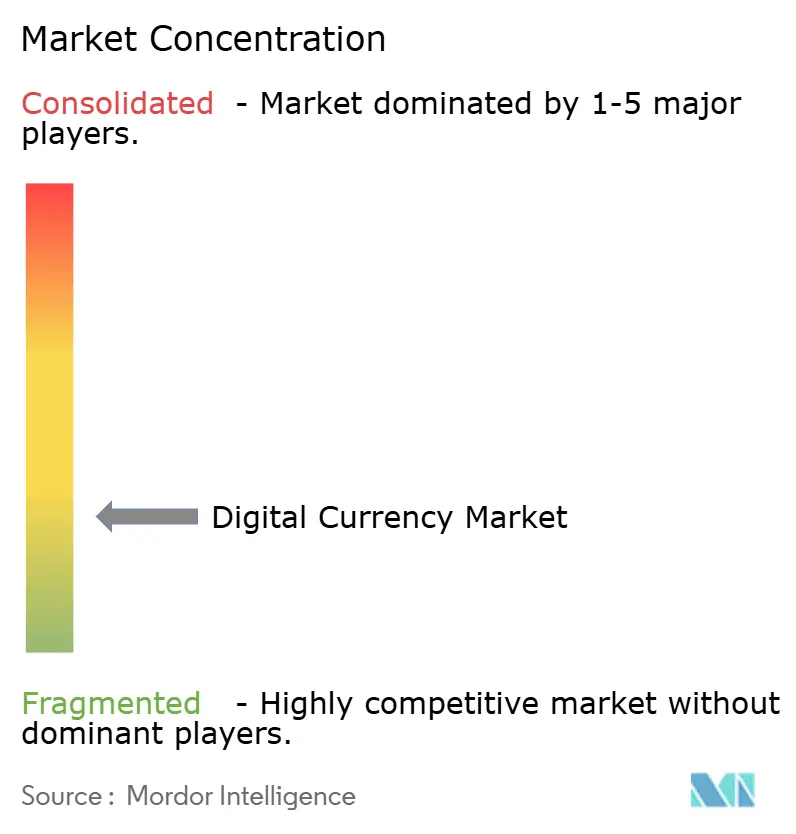
| Market Concentration | Low |
Major Players *Disclaimer: Major Players sorted in no particular order Image © Mordor Intelligence. Reuse requires attribution under CC BY 4.0. | |
Digital Currency Market Analysis by Mordor Intelligence
The Digital Currency Market size was valued at USD 34.38 billion in 2025 and is estimated to grow from USD 38.46 billion in 2026 to reach USD 67.34 billion by 2031, at a CAGR of 11.86% during the forecast period (2026-2031).
Institutional infrastructure is overtaking speculative trading as the chief growth catalyst, led by central-bank digital currency (CBDC) rollouts, stablecoin rails for cross-border business-to-business payments, and large-scale tokenization of real-world assets. Washington’s decision to create a Strategic Bitcoin Reserve holding 200,000 BTC marks a turning point, placing digital assets on par with gold and foreign-exchange holdings. Asia-Pacific’s mass adoption, coupled with mature regulatory frameworks in Europe, accelerates ecosystem build-out, while post-quantum security investments curtail institutional risk exposure. Competitive dynamics remain fluid: Binance retains the single-largest trading footprint despite compliance scrutiny, yet zero-fee strategies have propelled Bybit to the second slot. Growing machine-to-machine (M2M) payment volumes and green validation models further widen revenue pools for infrastructure vendors, wallet providers, and staking service operators within the digital currency market.
Key Report Takeaways
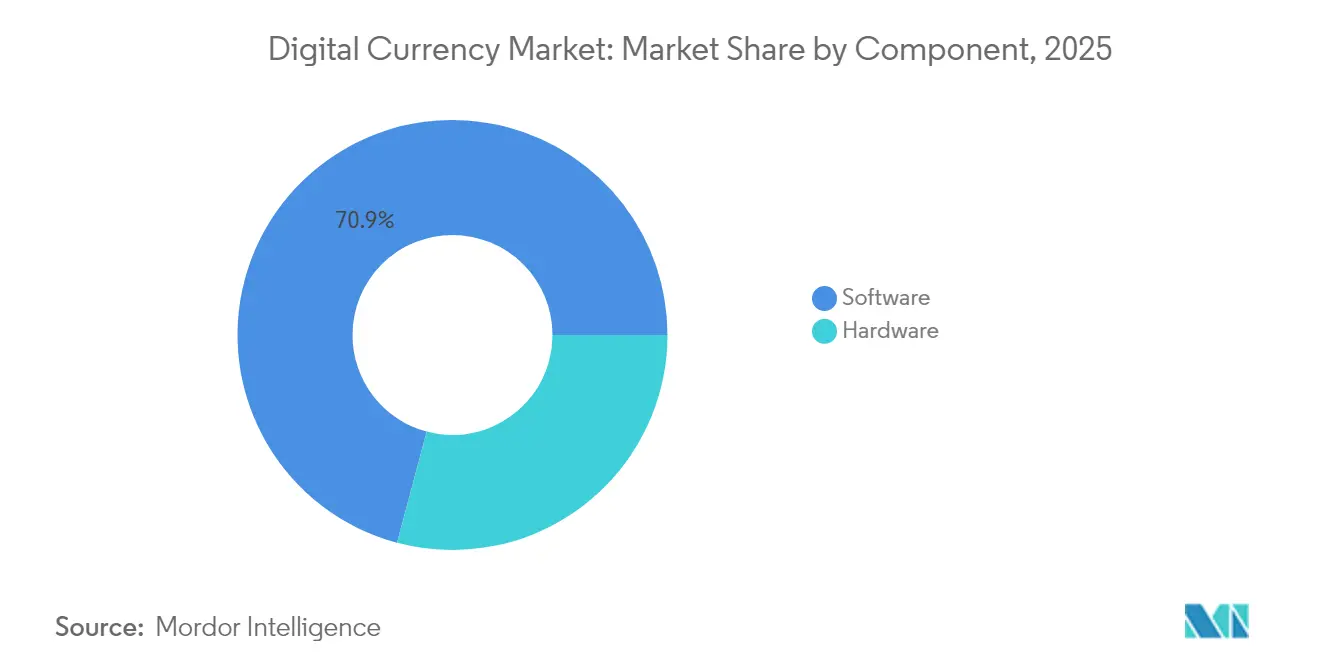
- By component: Software held 70.85% of the digital currency market share in 2025, while hardware is projected to expand at a 16.52% CAGR through 2031.
- By currency type: Cryptocurrencies accounted for 62.10% of the digital currency market size in 2025, whereas CBDCs are poised for a 30.15% CAGR to 2031.
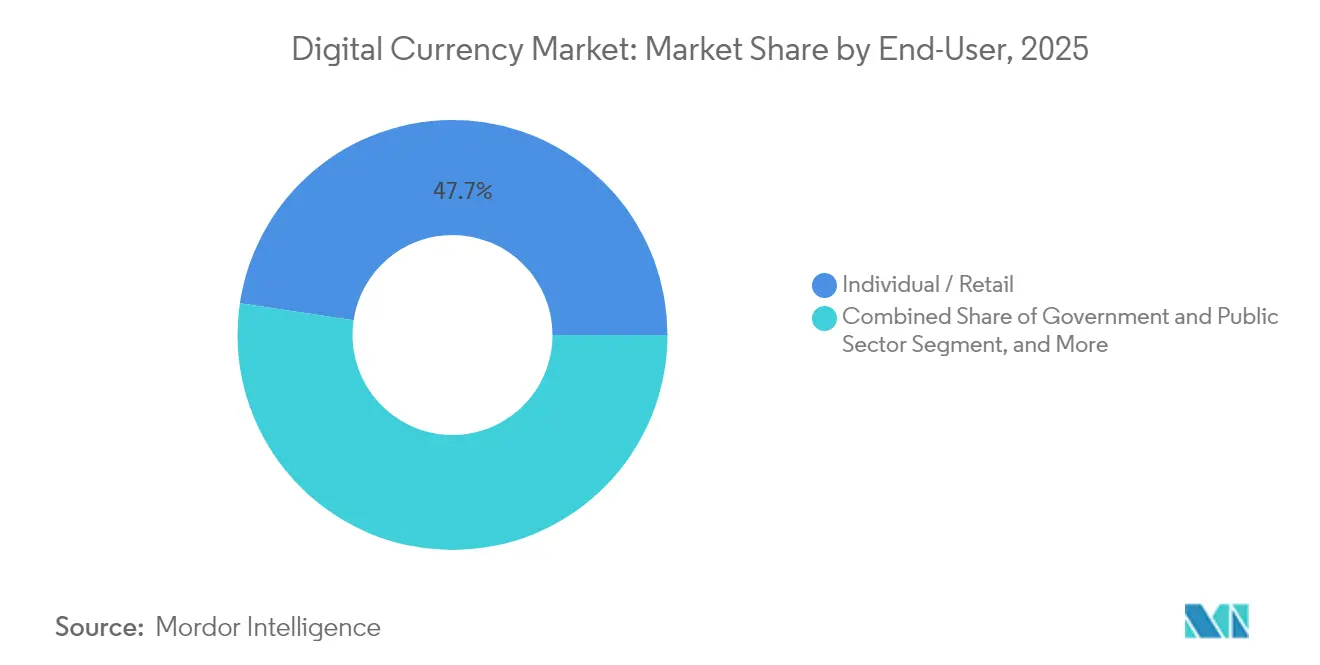
- By end-user: Retail users dominated with 47.65% revenue share in 2025; the government segment is forecast to rise at a 26.95% CAGR through 2031.
- By application: Trading and investment captured 45.95% of the digital currency market share in 2025, but M2M payments are tracking a 36.10% CAGR to 2031.
- By geography: In the digital currency market, the Asia-Pacific region led with 33.75% of 2025 revenues; the Middle East and Africa region is expected to post a 23.05% CAGR through 2031.
- Company concentration: Binance commanded 37–49% of global spot volume in 2025, while Bybit secured the next 15.5% share.
Note: Market size and forecast figures in this report are generated using Mordor Intelligence’s proprietary estimation framework, updated with the latest available data and insights as of 2026.
Global Digital Currency Market Trends and Insights
Drivers Impact Analysis*
| Driver | (~) % Impact on CAGR Forecast | Geographic Relevance | Impact Timeline |
|---|---|---|---|
| CBDC pilots move to large-scale issuance | +2.8% | Global; early gains in India, Thailand, UK | Medium term (2-4 years) |
| Rapid migration from cash to mobile wallets | +2.1% | Asia-Pacific core; spill-over to MEA | Short term (≤ 2 years) |
| Stablecoin integration in cross-border B2B payments | +1.9% | Global; concentrated in North America and EU | Short term (≤ 2 years) |
| Tokenization of real-world assets boosts collateral demand | +1.7% | North America and EU; expanding to Asia-Pacific | Medium term (2-4 years) |
| Smart-contract-based M2M payments | +2.3% | Global; led by developed markets | Long term (≥ 4 years) |
| De-dollarization drives sovereign digital currency projects | +1.5% | BRICS, Middle East, emerging markets | Long term (≥ 4 years) |
| Source: Mordor Intelligence | |||
CBDC pilots move to large-scale issuance
India’s e-rupee now serves more than 5 million users, while Thailand has completed wholesale trials that connect commercial banks directly to the central bank ledger. The Bank of England’s digital pound roadmap and Turkey’s digital lira prototype show that high-income economies are also embracing sovereign tokens. Early rollouts in Nigeria and the Bahamas prove that retail CBDCs can coexist with private wallets and card networks. Twenty-three of 30 sub-Saharan African nations are actively evaluating similar models, turning CBDCs into the fastest-growing currency type segment within the digital currency market.
Rapid migration from cash to mobile wallets
Stablecoin capitalization has rebounded to USD 161 billion, reinforcing consumer confidence in digital cash substitutes. Circle and Binance now extend USDC reach to 240 million users, and Circle’s application for a national trust bank license underscores a pivot toward regulated infrastructure.[1]Circle Research Desk, “USDC Ecosystem Growth Metrics,” circle.comMastercard’s Chainlink integration allows real-time, on-chain card settlements for 3 billion account holders.[2]The Block Insights, “Mastercard adds Chainlink oracles to card settlement stack,” theblock.co Asia-Pacific’s 24% crypto penetration—three times the global average—illustrates how mobile-first economies leapfrog card-based payment rails.
Stablecoin integration in cross-border B2B payments
Global corporations processed USD 36 billion in stablecoin settlements during 2024, leveraging innovations in the digital currency market to trim multi-day correspondent banking cycles to near-instant completion. Treasury desks at exporters adopt USDC to mitigate currency swings, while suppliers in high-inflation markets obtain faster working-capital relief. Partnerships such as Nexo–Sphere enable low-fee payroll disbursements and invoice financing over permissioned chains, broadening enterprise use cases.
Tokenization of real-world assets boosts collateral demand
BlackRock’s USD 150 billion treasury-bill program confirms that asset managers are moving from proofs of concept to scalable issuance platforms.[3]Coinbase Institutional Team, “The Real-World Asset Tokenization Report,” coinbase.com Smart contracts automate coupon payments, compliance checks, and secondary transactions, multiplexing liquidity across once-illiquid real-estate and private-equity assets. Fractional ownership draws smaller investors, while embedded compliance rules reassure regulators—together furnishing a 1.7-percentage-point uplift to the digital currency market CAGR.
Restraints Impact Analysis*
| Restraint | (~) % Impact on CAGR Forecast | Geographic Relevance | Impact Timeline |
|---|---|---|---|
| Regulatory fragmentation across jurisdictions | -1.8% | Global; US-EU divergence | Medium term (2-4 years) |
| Cyber-security and private-key management risks | -1.2% | Global; institutional clusters | Short term (≤ 2 years) |
| High energy use of proof-of-work chains | -0.9% | Global; EU scrutiny | Long term (≥ 4 years) |
| Quantum-computing threat to current cryptography | -0.7% | Global; infrastructure hubs | Long term (≥ 4 years) |
| Source: Mordor Intelligence | |||
Regulatory fragmentation across jurisdictions
MiCA grants Europe a single passport for crypto services, yet the United States still juggles overlapping bills like the STABLE Act and GENIUS Act. Firms operating on both sides of the Atlantic must sustain dual compliance stacks, inflating legal budgets and slowing product rollouts. Conversely, Singapore’s and Hong Kong’s licensing clarity lures liquidity from less predictable markets.
Cyber-security and private-key management risks
NIST’s post-quantum draft standards will be mandatory for federal systems by 2035, prompting banks to accelerate wallet-upgrade timelines.[4]NIST Cryptographic Standards Group, “Post-Quantum Cryptography Project,” nist.gov Custodians such as Taurus deploy hardware-security-module clusters and multi-signature schemes to satisfy institutional risk committees. However, in the digital currency market, the immutability of blockchain records means a single compromised key can irreversibly drain holdings, elevating insurance costs and dampening near-term adoption curves.
*Our forecasts treat driver/restraint impacts as directional, not additive. The impact forecasts reflect baseline growth, mix effects, and variable interactions.
Segment Analysis
By Component: Software infrastructure drives market evolution
Software captured 70.85% of 2025 revenues, underscoring the code-intensive backbone of the digital currency market size. Staking middleware, exchange engines, and custody platforms are on track for a 16.52% CAGR, far ahead of hardware mining rigs. Ethereum’s switch to proof-of-stake cut network power draw by 99.7%, redirecting capital toward validator nodes and smart-contract services rather than ASIC procurement. Hardware demand, while smaller, concentrates on cold-storage vaults and quantum-safe modules aimed at banks and asset managers. Vendors such as Ledger partner with insurers to package secure storage plus theft coverage, illustrating convergence between cybersecurity and physical devices. Integrated stacks—exemplified by Taurus-Temenos bundles—let incumbent core-banking systems activate crypto wallets through a simple software update, bringing thousands of banks into the digital currency market.


By Currency Type: Cryptocurrencies lead despite CBDC acceleration
Cryptocurrencies retained 62.10% of 2025 turnover, anchoring the speculative and store-of-value end of the digital currency market. Bitcoin’s enshrinement as a strategic reserve asset by the United States Treasury elevates its macro legitimacy, while El Salvador’s and Bhutan’s sovereign strategies reinforce nation-state acceptance. CBDCs, clocking a 30.15% CAGR, represent the public-sector’s answer to private-ledger dominance, with pilots live across 19 Middle Eastern and Central Asian economies. Stablecoins form the transactional bridge: USDC and USDT volumes now exceed USD 200 billion monthly, aided by the harmonized rules under MiCA. Dual-rail models emerge, allowing users to swap CBDC units for private tokens within single wallets, blurring lines between monetary authority liabilities and decentralized bearer assets.
By End-User: Retail dominance shifts toward institutional adoption
Retail wallets still represent 47.65% of 2025 revenue, but institutional momentum is unmistakable. Government entities are scaling at a 26.95% CAGR as treasury departments pilot CBDC disbursements and tokenized bond settlements. Financial institutions add crypto trading rails for millions of traditional customers—Germany’s Sparkassen-Finanzgruppe alone plans access for 50 million account holders under MiCA coverage. Large corporates diversify balance sheets with Bitcoin and stablecoin liquidity pools, enhancing working-capital efficiency and hedging inflation exposures. Seamless card-on-chain bridges from Mastercard and Coinbase further erode friction, nudging everyday consumers toward programmable money ecosystems.
By Application: Trading dominance challenged by utility applications
Trading and investment activities still commanded 45.95% of 2025 inflows, anchoring the digital currency market share. Yet M2M payments show the steepest trajectory at 36.10% CAGR as electric-vehicle chargers, smart meters, and industrial sensors settle micro-transactions autonomously. Cross-border remittances leverage stablecoins to shave fees and cut wait times for migrant workers sending funds home. Decentralized-finance (DeFi) protocols power supply-chain finance and automated compliance, expanding beyond pure speculation. Even non-fungible token (NFT) frameworks pivot from art hype to enterprise credentialing and ticketing, hinting at durable, utility-driven revenue streams.
Geography Analysis
Asia-Pacific generated 33.75% of 2025 receipts and processed 29% of global on-chain volume, propelled by 24% household crypto penetration. Singapore and Hong Kong supply licensing clarity, while Southeast Asian nations capitalize on mobile-first payment cultures. India’s e-rupee pilot at 5 million users underscores massive-scale CBDC feasibility; Japan and South Korea sustain deep liquidity pools under mature compliance codes. These developments highlight Asia-Pacific’s leading role in the global digital currency market.
Middle East and Africa represents the fastest-rising cluster with a 23.05% CAGR to 2031. Twenty-three sub-Saharan countries explore CBDCs as financial-inclusion levers; Nigeria’s eNaira and Ghana’s eCedi anchor early trials. The UAE and Saudi Arabia court service providers through sandbox schemes, and Bhutan collaborates with Binance Pay to capture high-value tourism spend. Regional public-sector enthusiasm offsets lower per-capita income, making MEA an outsized contributor to future digital currency market size gains.
North America and Europe exhibit high baseline volumes yet wrestle with divergent rulebooks. The US Strategic Bitcoin Reserve signals official asset-class endorsement, but overlapping state and federal statutes complicate nationwide rollouts. Europe’s MiCA delivers a single passport, letting Coinbase secure a CSSF license and instantly scale across the bloc. The net result is a shifting center of gravity: liquidity gravitates toward regimes offering both clarity and depth, while uncertainty diverts capital to compliant offshore hubs.

Competitive Landscape
Binance maintained between 38% and 50% of global spot volume in 2024, leveraging deep liquidity and a sprawling affiliate program. Regulatory probes in multiple jurisdictions did not materially dent its lead, though they did push the exchange to tighten know-your-customer processes. Bybit eclipsed Coinbase to claim 16% share after introducing zero-fee USDC pairs that attracted arbitrage desks and high-frequency traders.
Partnership plays dominate differentiation. Circle’s tie-up with Binance embeds USDC into exchange order books and 240 million consumer wallets, while its pending US trust-bank charter would anchor regulated stablecoin issuance under the Federal Reserve umbrella. Taurus joined forces with Temenos so that more than 3,000 banks running on Temenos Transact can activate custody modules through a software upgrade.
Traditional payment giants also converge on crypto rails. Mastercard’s Chainlink integration allows secure on-chain settlement finality, granting merchants real-time fiat conversion without absorber balance-sheet risk. Visa collaborates with Coinbase to enable instant crypto deposits that can be spent at 80 million acceptance points, stitching decentralized liquidity into everyday commerce. These developments underscore the rapid evolution and growing sophistication of the digital currency industry.
Digital Currency Industry Leaders
Ripple Labs, Inc.
Binance Holdings Ltd.
Coinbase Global Inc.
Tether Holdings Ltd.
Circle Internet Financial Ltd.
- *Disclaimer: Major Players sorted in no particular order

Recent Industry Developments
- March 2025: President Trump signed Executive Order 14233 establishing the Strategic Bitcoin Reserve that now holds 200,000 BTC as a sovereign store of value.
- June 2025: Coinbase obtained a MiCA license from Luxembourg’s CSSF, unlocking regulated trading, custody, and payment services across the European Union.
- June 2025: People’s Bank of China expanded the e-CNY pilot to 260 million wallets and USD 986 billion in cumulative turnover across 29 provinces.
- October 2024: Coinbase and Visa launched real-time crypto deposits via eligible Visa debit cards for US and EU users.


Global Digital Currency Market Report Scope
Digital currency (digital money, electronic money or electronic currency) is any currency, money, or money-like asset that is primarily managed, stored or exchanged on digital computer systems, especially over the internet.
The digital currency market is segmented by component (hardware, software), by type (centralized virtual currency, decentralized virtual currency), by end-user (enterprise, government, personal), by geography (North America, Europe, Asia-Pacific, Rest of the World). The market sizes and forecasts are provided in terms of value (USD) for all the above segments.
| Hardware |
| Software |
| Central Bank Digital Currency (CBDC) |
| Stablecoins (Asset-backed) |
| Cryptocurrencies (Permissionless) |
| Government and Public Sector |
| Financial Institutions |
| Enterprises (Non-financial) |
| Individual / Retail |
| Payments and Remittances |
| Trading and Investment |
| Decentralised Applications (DApps) and Smart Contracts |
| Others (NFTs, Gaming, Metaverse) |
| North America | United States | |
| Canada | ||
| Mexico | ||
| South America | Brazil | |
| Argentina | ||
| Rest of South America | ||
| Europe | United Kingdom | |
| Germany | ||
| France | ||
| Italy | ||
| Spain | ||
| Russia | ||
| Rest of Europe | ||
| Asia-Pacific | China | |
| Japan | ||
| India | ||
| South Korea | ||
| Australia and New Zealand | ||
| Southeast Asia | ||
| Rest of Asia-Pacific | ||
| Middle East and Africa | Middle East | Saudi Arabia |
| UAE | ||
| Turkey | ||
| Rest of Middle East | ||
| Africa | South Africa | |
| Nigeria | ||
| Egypt | ||
| Rest of Africa | ||
| By Component | Hardware | ||
| Software | |||
| By Currency Type | Central Bank Digital Currency (CBDC) | ||
| Stablecoins (Asset-backed) | |||
| Cryptocurrencies (Permissionless) | |||
| By End-User | Government and Public Sector | ||
| Financial Institutions | |||
| Enterprises (Non-financial) | |||
| Individual / Retail | |||
| By Application | Payments and Remittances | ||
| Trading and Investment | |||
| Decentralised Applications (DApps) and Smart Contracts | |||
| Others (NFTs, Gaming, Metaverse) | |||
| By Geography | North America | United States | |
| Canada | |||
| Mexico | |||
| South America | Brazil | ||
| Argentina | |||
| Rest of South America | |||
| Europe | United Kingdom | ||
| Germany | |||
| France | |||
| Italy | |||
| Spain | |||
| Russia | |||
| Rest of Europe | |||
| Asia-Pacific | China | ||
| Japan | |||
| India | |||
| South Korea | |||
| Australia and New Zealand | |||
| Southeast Asia | |||
| Rest of Asia-Pacific | |||
| Middle East and Africa | Middle East | Saudi Arabia | |
| UAE | |||
| Turkey | |||
| Rest of Middle East | |||
| Africa | South Africa | ||
| Nigeria | |||
| Egypt | |||
| Rest of Africa | |||


Key Questions Answered in the Report
What is the projected value of the digital currency market by 2031?
The digital currency market size is expected to reach USD 67.34 billion by 2031.
Which region currently leads digital currency adoption?
Asia-Pacific leads with 33.75% of 2025 revenue and registers a 24% household crypto adoption rate.
Who are the dominant players in exchange trading?
Binance holds 37–49% market share, with Bybit and Coinbase following at 15.5% and lower double-digit figures, respectively.
Which application segment is growing the fastest?
Smart-contract-driven machine-to-machine payments are forecast to rise at a 36.10% CAGR through 2031.
Why are CBDCs gaining momentum?
Central banks deploy CBDCs to enhance financial inclusion, streamline monetary policy transmission, and offer programmable alternatives to private stablecoins.
Page last updated on:


