Digital Education Market Size and Share
Market Overview
| Study Period | 2020 - 2031 |
|---|---|
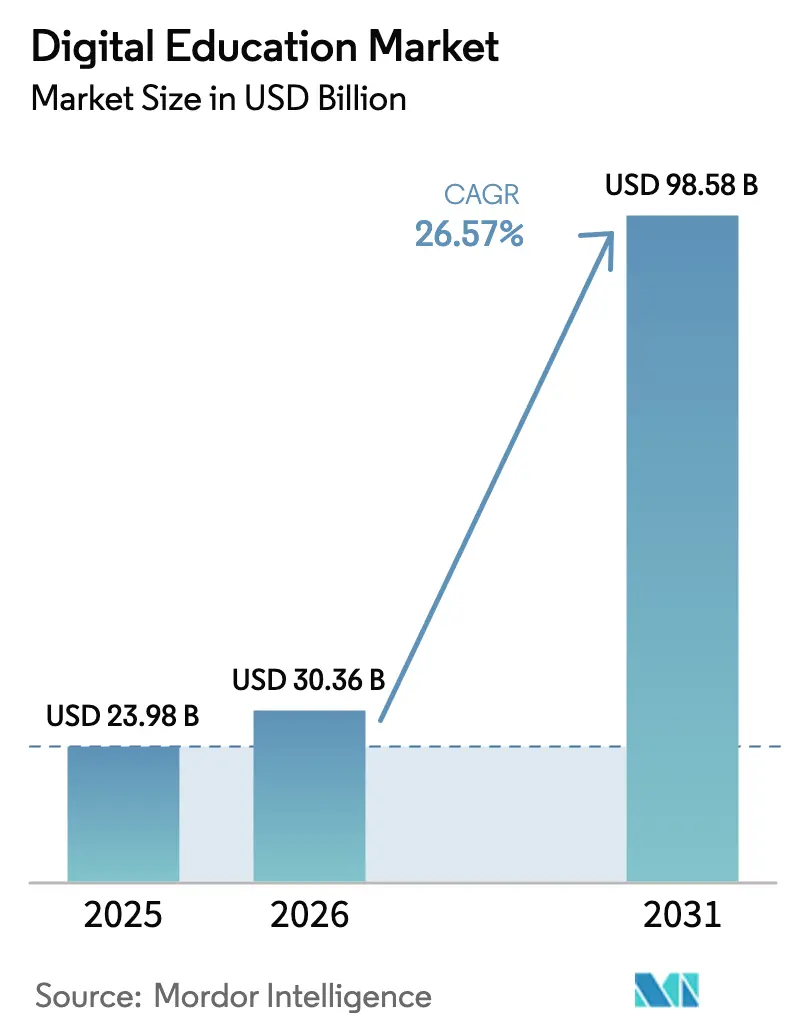
| Market Size (2026) | USD 30.36 Billion |
| Market Size (2031) | USD 98.58 Billion |
| Growth Rate (2026 - 2031) | 26.57% CAGR |
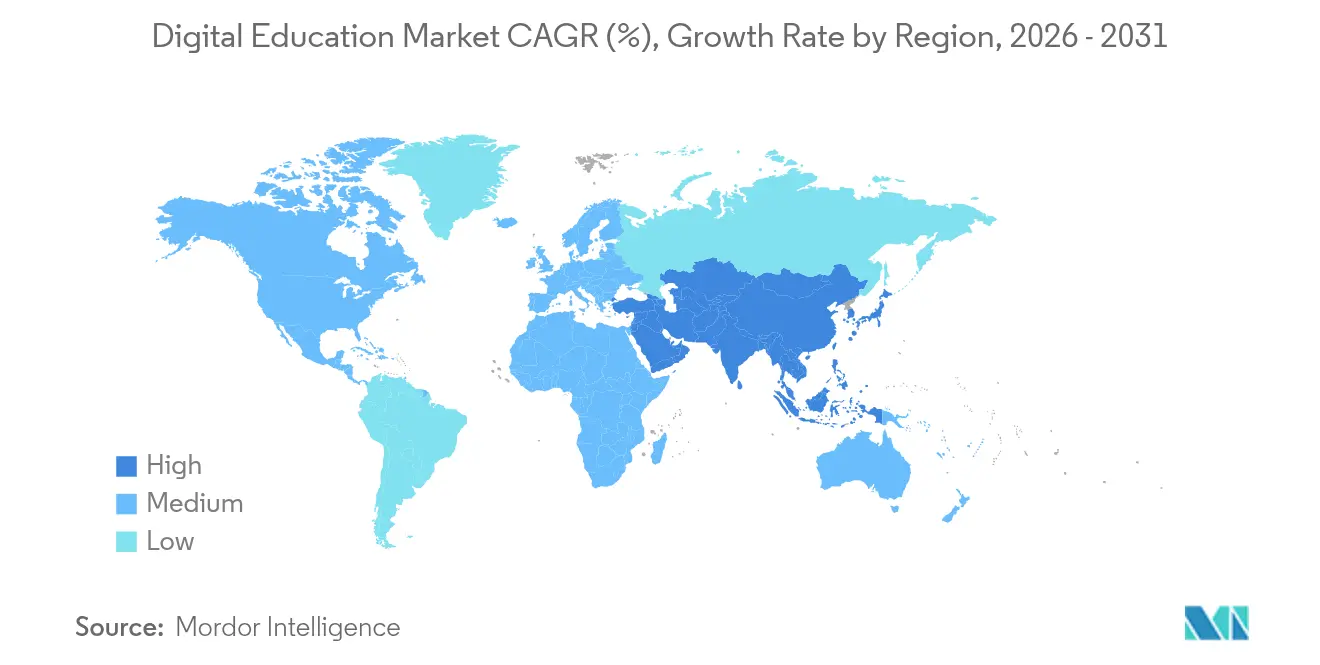
| Fastest Growing Market | Asia Pacific |
| Largest Market | North America |
| Market Concentration | Medium |
Major Players *Disclaimer: Major Players sorted in no particular order Image © Mordor Intelligence. Reuse requires attribution under CC BY 4.0. | |
Digital Education Market Analysis by Mordor Intelligence
Digital education market size in 2026 is estimated at USD 30.36 billion, growing from 2025 value of USD 23.98 billion with 2031 projections showing USD 98.58 billion, growing at 26.57% CAGR over 2026-2031. Robust growth stems from AI-powered personalization, surging mobile connectivity, and government-backed digital literacy programs that expand the learner pool. Providers that combine real-time analytics with adaptive content now shorten skill-acquisition cycles for both corporate and academic users. Subscription pricing dominates revenue, yet freemium plays widen reach in price-sensitive segments. Competitive intensity is rising as venture funding tightens and platforms pivot toward profitability, using data privacy compliance as a service differentiator amid stricter FERPA, COPPA, and GDPR enforcement.
Key Report Takeaways
- By learning mode, self-paced online education accounted for 40.15% of the digital education market share in 2025, while blended hybrid learning is projected to expand at a 16.10% CAGR through 2031.
- By course type, STEM captured 37.42% of the digital education market size in 2025; language learning is advancing at a 15.92% CAGR to 2031.
- By end-user, academic institutions and individuals held 45.05% share of the digital education market size in 2025, whereas the government and non-profits segment records the fastest 14.07% CAGR through 2031.
- By technology, Learning Management Systems led with 33.36% digital education market share in 2025, and AI-driven adaptive learning is growing at a 22.05% CAGR.
- By revenue model, subscriptions delivered 50.88% of 2025 revenue; freemium and ad-supported models are forecast to post a 14.98% CAGR to 2031.
- By geography, North America commanded 31.28% digital education market size in 2025, while Asia-Pacific is on track for a 14.74% CAGR through 2031.
Note: Market size and forecast figures in this report are generated using Mordor Intelligence’s proprietary estimation framework, updated with the latest available data and insights as of 2026.
Global Digital Education Market Trends and Insights
Driver Impact Analyis*
| Driver | ( ~ ) % Impact on CAGR Forecast | Geographic Relevance | Impact Timeline |
|---|---|---|---|
| Rising demand for flexible learning | +4.2% | Global, led by North America and EU | Medium term (2-4 years) |
| Government initiatives and funding for digital literacy | +3.8% | Asia-Pacific core, spill-over to MEA and Latin America | Long term (≥ 4 years) |
| Growing mobile-internet penetration | +5.1% | Asia-Pacific, MEA, Latin America | Short term (≤ 2 years) |
| Micro-credentialing acceptance | +2.9% | North America and EU, expanding to Asia-Pacific | Medium term (2-4 years) |
| Corporate ESG-driven workforce up-skilling | +3.6% | Global | Medium term (2-4 years) |
| AI-driven personalised learning outcomes | +6.8% | Global, early adoption in North America | Short term (≤ 2 years) |
| Source: Mordor Intelligence | |||
Rising Demand for Flexible Learning
Hybrid work models make synchronous classroom training impractical, so enterprises seek platforms that deliver consistent instruction across time zones and devices. In 2025, 72% of United States public schools integrated blended approaches to maintain continuity during schedule disruptions [1]U.S. Department of Education, “Stepping-up Technology Implementation Grants,” ed.gov. Adaptive engines tailor pathways to real-time performance data, letting professionals reskill without halting day-to-day operations. Knowledge-intensive industries such as finance and software development now prioritize flexible learning to mitigate rapid skill obsolescence. The resulting scale efficiencies help multinational firms roll out global training while holding instructional quality steady.
Government Initiatives and Funding for Digital Literacy
Targeted public investment accelerates infrastructure rollouts and platform adoption. The Asian Development Bank earmarked USD 15 billion for regional education upgrades that include teacher training, device procurement, and localized content delivery [2]Asian Development Bank, “ADB Education Sector Directional Guide,” adb.org. In the United States, the Stepping-up Technology Implementation grant disbursed USD 400,000 to advance inclusive digital programs in 2024. Preference now leans toward providers that can document learning outcomes through analytics dashboards, giving established vendors an edge. Domestic-first procurement in markets such as India and Indonesia also creates regional carve-outs that alter the competitive map.
Growing Mobile-Internet Penetration
Mobile services added USD 6.5 trillion in global economic value during 2024, with smartphone penetration outpacing PC ownership in many emerging economies. Five-hundred-plus operators are deploying 5G, unlocking bandwidth for immersive video, VR labs, and collaborative whiteboards that were previously impractical. Platforms optimized for small-screen consumption reach learners in rural zones where fixed broadband is scarce, closing historic access gaps. As 5G coverage spreads, synchronous virtual classrooms become more reliable, supporting realtime assessment and instant feedback loops.
AI-Driven Personalised Learning Outcomes
Organizations are allocating larger budgets to adaptive technologies that boost training ROI. AI-enabled courses elevate knowledge retention and cut seat time, leading to average annual savings of USD 1.3 million per enterprise customer. Predictive analytics flag at-risk learners early, allowing tutors to intervene before performance drops. Emotional-state detection further refines timing and format, maintaining engagement and reducing dropout rates.
Restraint Impact Analysis*
| Restraint | ( ~ ) % Impact on CAGR Forecast | Geographic Relevance | Impact Timeline |
|---|---|---|---|
| High implementation costs and digital divide | -2.8% | Global, acute in emerging markets | Long term (≥ 4 years) |
| Content localisation and language barriers | -1.9% | Asia-Pacific, MEA, Latin America | Medium term (2-4 years) |
| Rising data-privacy scrutiny on ed-tech platforms | -2.3% | Global, strictest in EU and North America | Short term (≤ 2 years) |
| Credential inflation diluting perceived value | -1.6% | North America and EU | Medium term (2-4 years) |
| Source: Mordor Intelligence | |||
High Implementation Costs and Digital Divide
Enterprise-grade rollouts can cost between USD 50,000 and USD 200,000 for integration, customization, and user onboarding. Smaller businesses in Latin America and Africa often delay adoption because expected returns are uncertain when budgets are tight. Connectivity gaps further hamper efficacy: where broadband reliability is low, interactive modules buffer or fail, undermining learner trust. The cost hurdle widens the performance gap between well-funded corporations and SMEs.
Rising Data-Privacy Scrutiny on Ed-Tech Platforms
Regulators worldwide strengthen oversight of learner data. The Federal Trade Commission is revising COPPA rules to sharpen consent and disclosure requirements for K-12 platforms. In the EU, GDPR enforcement actions against ed-tech providers rose in 2024, prompting additional compliance spending on data minimization and localization. Tighter rules can reduce the data available for AI engines, potentially weakening algorithmic personalisation until lawful consent pathways mature.
*Our forecasts treat driver/restraint impacts as directional, not additive. The impact forecasts reflect baseline growth, mix effects, and variable interactions.
Segment Analysis
By Learning Mode: Hybrid Models Bridge Digital-Physical Gap
Self-paced modules retained 40.15% share of the digital education market size in 2025, demonstrating enduring preference for anytime access. The blended model is scaling fastest at 16.10% CAGR as enterprises combine digital coursework with in-person projects to sharpen applied skills. Instructor-led video sessions complement self-paced reading, giving learners the structure of scheduled touchpoints without travel costs. Hybrid adoption is particularly strong in engineering and healthcare where simulation labs augment theory. This configuration balances cost efficiency with the social reinforcement of cohort learning, so providers that support both modalities increase stickiness and lifetime value.
Learners expect a seamless handoff between asynchronous modules and live workshops. Platforms now embed scheduling tools, analytics, and credential dashboards that span both contexts. As 5G and cloud infrastructure mature, immersive labs using VR or AR become part of hybrid programs, bringing tactile problem solving to remote audiences.


By Course Type: STEM Dominance Faces Language Learning Surge
STEM disciplines represented 37.42% of the digital education market share in 2025 because firms continue to prioritize data science, AI, and cybersecurity competencies. Globalization and distributed workforces fuel a 15.92% CAGR in language offerings as multinational projects require multilingual collaboration. Business management content remains steady, supplying leadership pipelines, while arts and humanities attract niche creative professionals. Micro-credential tracks in cloud computing and DevOps enable rapid upskilling without full degree commitments.
Language platforms integrate speech recognition and adaptive grammar exercises to compress mastery timelines. Some vendors combine technical and language learning so software developers can gain both coding and English proficiency in a single pathway, reflecting demand for multi-skill professionals.
By End-user: Government Sector Emerges as Growth Driver
Academic institutions and individual learners accounted for 45.05% share of the digital education market size in 2025. Yet the government and non-profit cohort is expanding at a 14.07% CAGR as agencies modernize public-service skill sets. Ministries now finance large-scale digital literacy courses for employees and citizens, securing volume contracts for leading platforms. Enterprises continue to represent a major revenue stream, but procurement cycles lengthen as CFOs scrutinize ROI in a tighter funding environment.
Public bodies favor solutions that meet domestic data-sovereignty rules, pushing vendors to open local data centers. Integration with civil-service HR systems is another selection criterion, giving API-first vendors a competitive edge in this growing segment.
By Technology: AI Adaptive Learning Disrupts Traditional LMS
Learning Management Systems delivered 33.36% revenue in 2025, still forming the backbone for content hosting and reporting. AI-driven adaptive engines, however, are growing at 22.05% CAGR and are increasingly embedded within or layered atop legacy LMS stacks. Mobile apps accelerate uptake of micro-lessons, while VR classrooms gain traction in safety training and medical simulation.
Vendors that blend AI with xAPI-compliant data flows create granular insight into learner progression, which corporate buyers now use to link training to key performance indicators. Blockchain tools for tamper-proof credential storage are in pilot stage but could move mainstream as employers seek instant verification of skills.

By Revenue Model: Freemium Strategies Gain Traction
Subscriptions produced 50.88% of 2025 revenue thanks to predictable cash flow and evergreen content updates. Freemium and ad-supported tiers are advancing at a 14.98% CAGR because they lower entry barriers for price-sensitive users and create large funnels for upsell. Pay-per-course remains popular for short credential needs, while corporate site-wide licenses often include outcome-based clauses that tie fees to assessment scores.
Sophisticated ad targeting now delivers job-relevant promotions inside course interfaces, generating incremental income without subscription commitment. Providers refine conversion algorithms to move active free users into premium pathways once competency baselines are proven.
Geography Analysis
North America retained 31.28% of 2025 revenue, reflecting mature enterprise training budgets and early adoption of AI personalisation engines. The region also pilots regulatory frameworks that shape global best practice, making compliance expertise a commercial advantage for vendors.
Asia-Pacific is projected to post a 14.74% CAGR through 2031, fueled by 1.8 billion mobile subscribers and state-led digital-literacy targets. China’s Education Modernisation Plan and India’s Digital India initiative both earmark significant funding for e-learning infrastructure. Smartphone-first markets enable leapfrogging of desktop-centric models, letting platforms reach rural learners at low incremental cost.
Europe shows steady growth as enterprises embed training within ESG compliance and workforce-transition agendas. Data-localization and multilingual content requirements add complexity but also insulate domestic vendors. Latin America, the Middle East, and Africa remain early-stage yet present upside once broadband density improves and device costs fall.

Competitive Landscape
Market concentration is moderate, with hundreds of platforms addressing niches from K-12 to adult reskilling. Funding tightened to USD 2.4 billion in 2024, the lowest in a decade, prompting a shift from growth-at-any-cost toward margin discipline. Larger players use cash reserves to acquire specialized content providers, evidenced by Newsela’s USD 100 million purchase of Generation Genius in February 2025.
Differentiation centers on AI depth, mobile UX, and outcome measurement. Coursera integrated skill-signal dashboards that link course completion to salary change, supporting enterprise renewals. Blackboard and Moodle focus on open-source extensibility to retain academic clients. New entrants experiment with blockchain badges and peer-to-peer mentoring to stand out in saturated consumer segments.
Partnership models gain weight as corporates demand seamless links to HRIS, CRM, and talent-management tools. Vendors with published APIs and low-code connectors win deals because they shorten deployment cycles. Compliance with privacy statutes becomes a sales lever, so platforms invest in audit certifications such as ISO 27001 and SOC 2.
Digital Education Industry Leaders
Coursera, Inc.
BYJU’S (Think & Learn Pvt Ltd)
Udemy, Inc.
LinkedIn Learning (Microsoft Corporation)
2U, Inc.
- *Disclaimer: Major Players sorted in no particular order


Recent Industry Developments
- April 2025: Los Angeles Unified School District launched “Ed,” an AI-driven platform built with AllHere to provide personalised after-hours learning support.
- April 2025: Coursera reported USD 179.3 million Q1 2025 revenue, up 6% year-over-year, and reached 175 million registered learners.
- February 2025: Newsela acquired Generation Genius for USD 100 million to expand K-12 science content offerings.
- October 2024: Perlego raised EUR 18.1 million (USD 19.3 million) in Series B to scale AI-enhanced academic textbook access.


Research Methodology Framework and Report Scope
Market Definitions and Key Coverage
Our study defines the digital education market as all fee-based learning content, platforms, and services delivered primarily over public or private internet networks to academic, corporate, and individual learners, whether self-paced, live-virtual, or blended. Revenues include course fees, platform subscriptions, and license payments recorded at the provider level in 2025, when Mordor Intelligence values the market at USD 23.98 billion.
Scope Exclusions: Pure hardware sales such as laptops, VR headsets, and interactive whiteboards are outside the sizing, as are offline tutoring centers.
Segmentation Overview
- By Learning Mode
- Self-paced Online Education
- Instructor-led Online Education
- Blended / Hybrid Learning
- By Course Type
- STEM
- Business Management
- Arts and Humanities
- Language Learning
- Other Courses
- By End-user
- Academic Institutions and Individuals
- Enterprise
- Government and Non-profits
- Vocational Training Centres
- By Technology
- Learning Management Systems (LMS)
- Mobile Learning Apps
- Virtual and Augmented Reality (XR)
- Artificial Intelligence and Adaptive Learning
- Others
- By Revenue Model
- Subscription-based
- Pay-Per-Course
- Freemium and Ad-supported
- Corporate Licensing
- By Geography
- North America
- United States
- Canada
- Mexico
- South America
- Brazil
- Argentina
- Rest of South America
- Europe
- Germany
- United Kingdom
- France
- Italy
- Spain
- Russia
- Rest of Europe
- Asia-Pacific
- China
- Japan
- India
- South Korea
- Australia and New Zealand
- Rest of Asia-Pacific
- Middle East and Africa
- Middle East
- Saudi Arabia
- UAE
- Turkey
- Rest of Middle East
- Africa
- South Africa
- Nigeria
- Kenya
- Rest of Africa
- Middle East
- North America
Detailed Research Methodology and Data Validation
Primary Research
Structured interviews and short surveys with EdTech executives, L&D managers, university administrators, and regional policy specialists give us live price points, churn ratios, and adoption hurdles across North America, Asia-Pacific, Europe, and emerging markets, helping refine model sensitivities and challenge desk findings.
Desk Research
Our analysts first map the universe using open-access sources such as UNESCO Institute for Statistics, the International Telecommunication Union, the World Bank EdStats portal, OECD Education at a Glance, and national ministries of education. Market signals are enriched with company filings, investor decks, reputable press, and data extracted from paid tools including D&B Hoovers for provider revenues and Dow Jones Factiva for deal tracking. These references supply enrollment counts, pricing benchmarks, broadband penetration, and policy milestones that anchor every assumption. The named sources illustrate the mix; many other publications were consulted to cross-check facts and fill gaps.
Market-Sizing & Forecasting
A top-down build begins with addressable learner pools by region, multiplied by verified digital participation rates and average annual spend. Supplier roll-ups and sampled ASP-by-course checks provide a bottom-up reasonableness screen before totals are locked. Key variables like smartphone penetration, broadband pricing trends, institutional digital budgets, corporate up-skilling outlays, and government e-learning grants feed a multivariate regression that projects revenue to 2030. Any country where bottom-up inputs are thin is adjusted using regional proxies vetted with interviewees.
Data Validation & Update Cycle
Outputs run through automated variance alerts, peer review, and senior analyst sign-off. Reports refresh each year, with interim updates triggered by funding shocks, major policy shifts, or material M&A so clients receive the freshest view.
Why Mordor's Digital Education Baseline Commands Reliability
Published values often diverge because providers choose different revenue streams, geographic mixes, and refresh cadences.
Key gap drivers here include broader content bundles counted by some publishers, variations in assumed course pricing escalators, and the fact that Mordor reports a calendar 2025 baseline while others quote fiscal or mid-year snapshots.
Benchmark comparison
| Market Size | Anonymized source | Primary gap driver |
|---|---|---|
| USD 23.98 Bn | Mordor Intelligence | - |
| USD 32.36 Bn | Global Consultancy A | Includes device leasing fees and uses aggressive pricing inflation |
| USD 34.02 Bn | Industry Association B | Applies uniform uptake rates and refreshes data biennially |
Taken together, the comparison shows our disciplined scope selection, annual refresh, and dual-layer validation yield a balanced, transparent baseline that decision-makers can trace back to clear variables and repeatable steps.


Key Questions Answered in the Report
What is the digital education market size in 2026?
The market is valued at USD 30.36 billion in 2026.
What compound annual growth rate (CAGR) is forecast for the digital education market through 2031?
The market is projected to grow at a 26.57% CAGR between 2026 and 2031.
Which learning mode is expanding the fastest?
Blended hybrid learning is advancing at a 16.10% CAGR through 2031.
How quickly is the AI-driven adaptive learning segment growing?
AI and adaptive learning technologies are expanding at a 22.05% CAGR.
What is the most significant cost-related barrier to adoption?
High implementation costs—often USD 50,000 to USD 200,000 for enterprise rollouts—remain a chief restraint, especially for SMEs.
Page last updated on:


