Digital Content Market Size and Share
Market Overview
| Study Period | 2020 - 2031 |
|---|---|
| Market Size (2026) | USD 39.61 Billion |
| Market Size (2031) | USD 71.19 Billion |
| Growth Rate (2026 - 2031) | 12.45% CAGR |
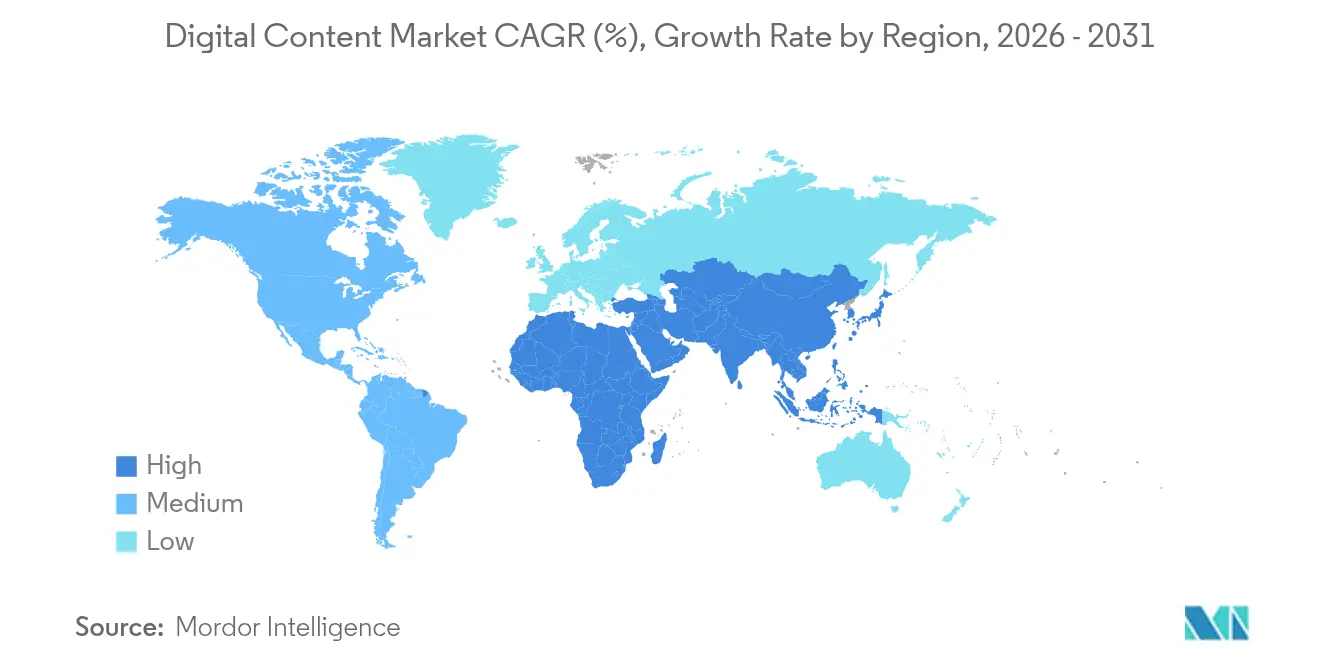
| Fastest Growing Market | Asia Pacific |
| Largest Market | North America |
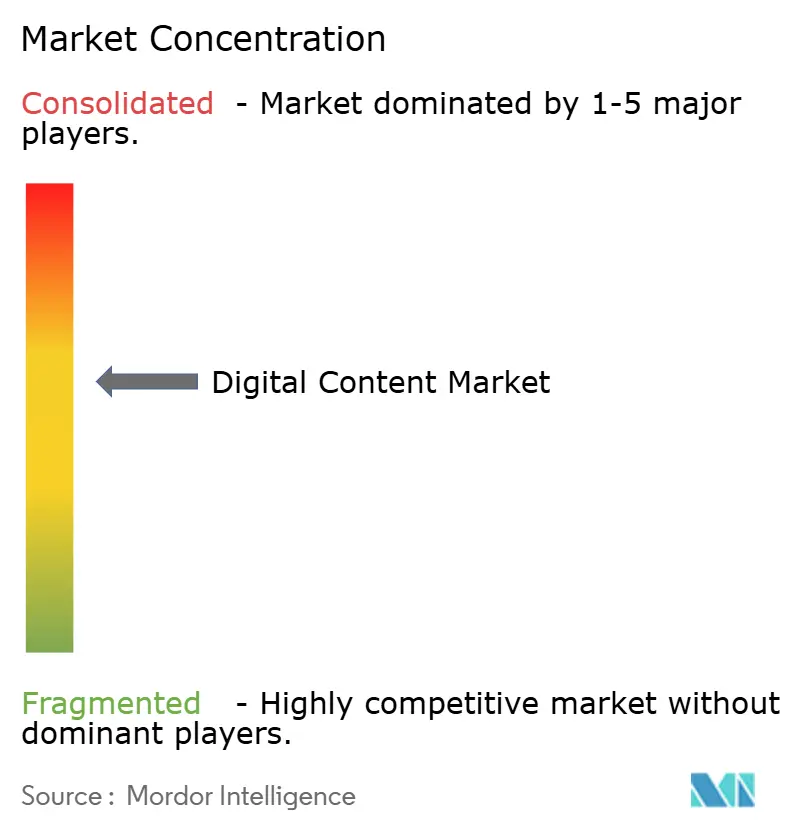
| Market Concentration | Medium |
Major Players *Disclaimer: Major Players sorted in no particular order Image © Mordor Intelligence. Reuse requires attribution under CC BY 4.0. | |
Digital Content Market Analysis by Mordor Intelligence
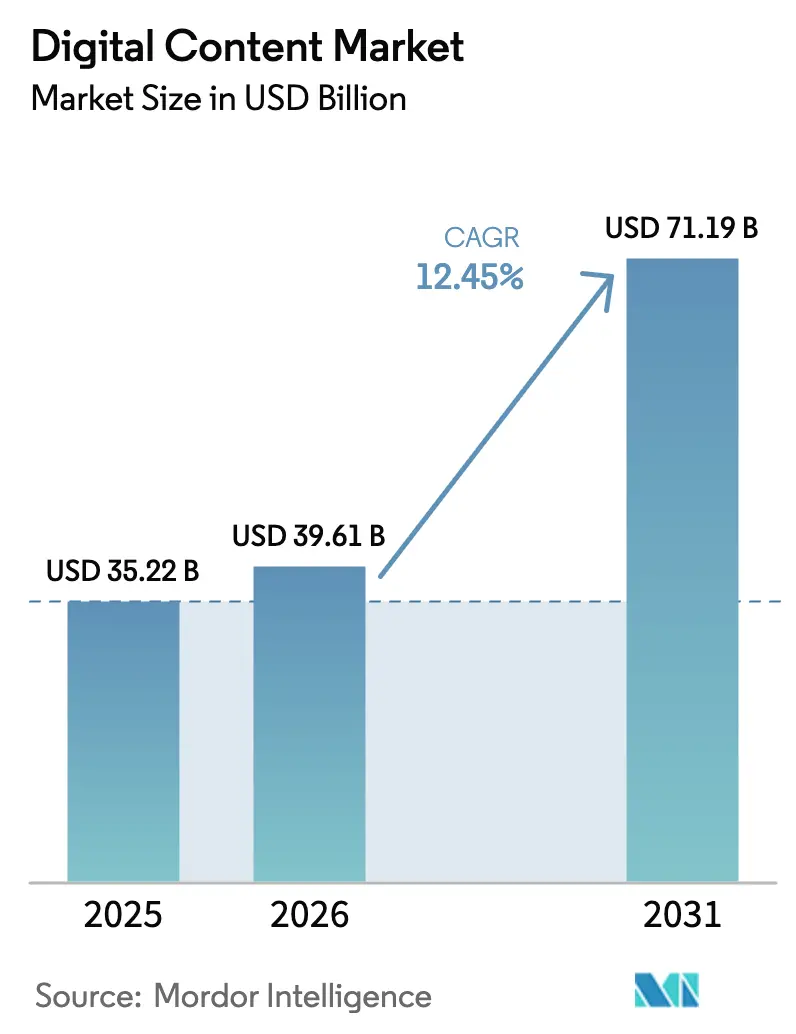
Digital content market size in 2026 is estimated at USD 39.61 billion, growing from 2025 value of USD 35.22 billion with 2031 projections showing USD 71.19 billion, growing at 12.45% CAGR over 2026-2031. Heightened enterprise demand for AI-enhanced creative workflows, rapid adoption of cloud-native authoring platforms and the spread of mobile broadband infrastructure underpin this expansion. Generative AI reduces content production cycles, while Web3 monetization opens additional revenue streams for creators. Cloud deployments supply elastic GPU capacity that keeps pace with increasingly complex visual workloads, and simplified design interfaces allow non-experts to participate in content creation, broadening the customer base. Competitive activity centers on integrating AI into existing toolsets and on acquisitions that fill capability gaps or extend platform ecosystems.
Key Report Takeaways
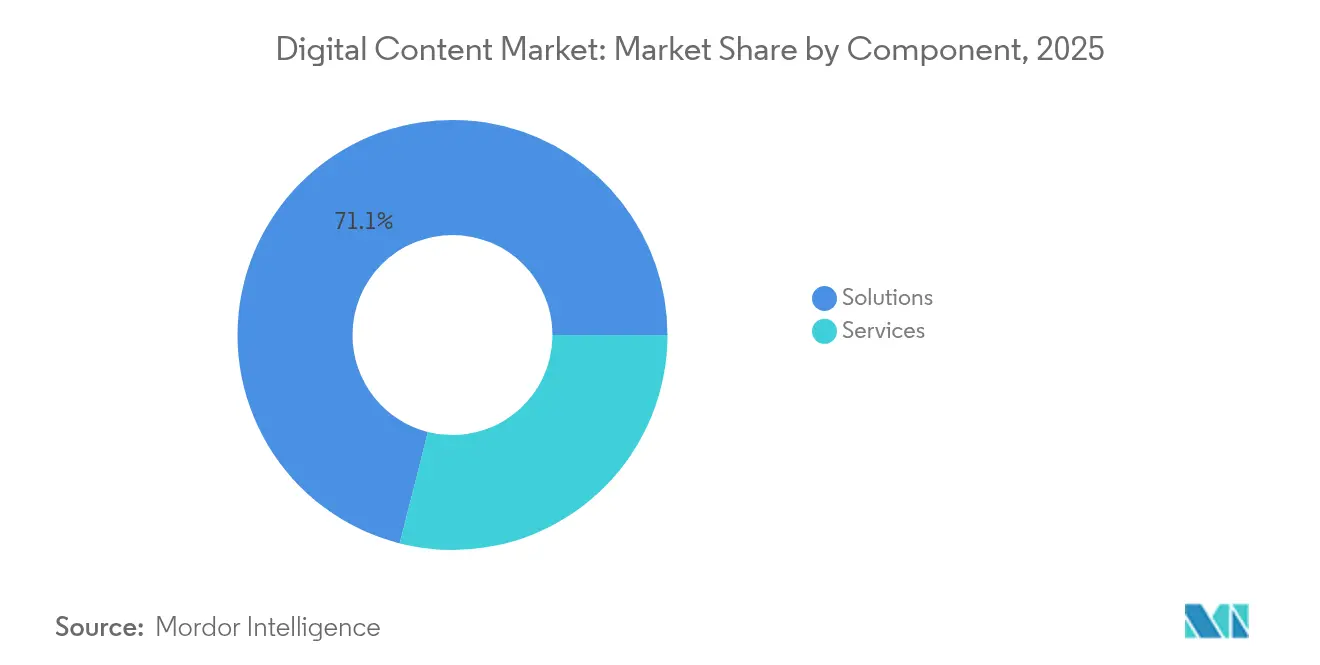
- By component, Solutions led with 71.05% of digital content market share in 2025, while Services is forecast to post the fastest 17.25% CAGR through 2031.
- By deployment mode, cloud environments accounted for 75.65% of digital content market size in 2025 and are expanding at a 19.65% CAGR to 2031.
- By enterprise size, large enterprises contributed 62.05% of revenue in 2025, whereas SMEs are set to grow at a 16.15% CAGR over the same period.
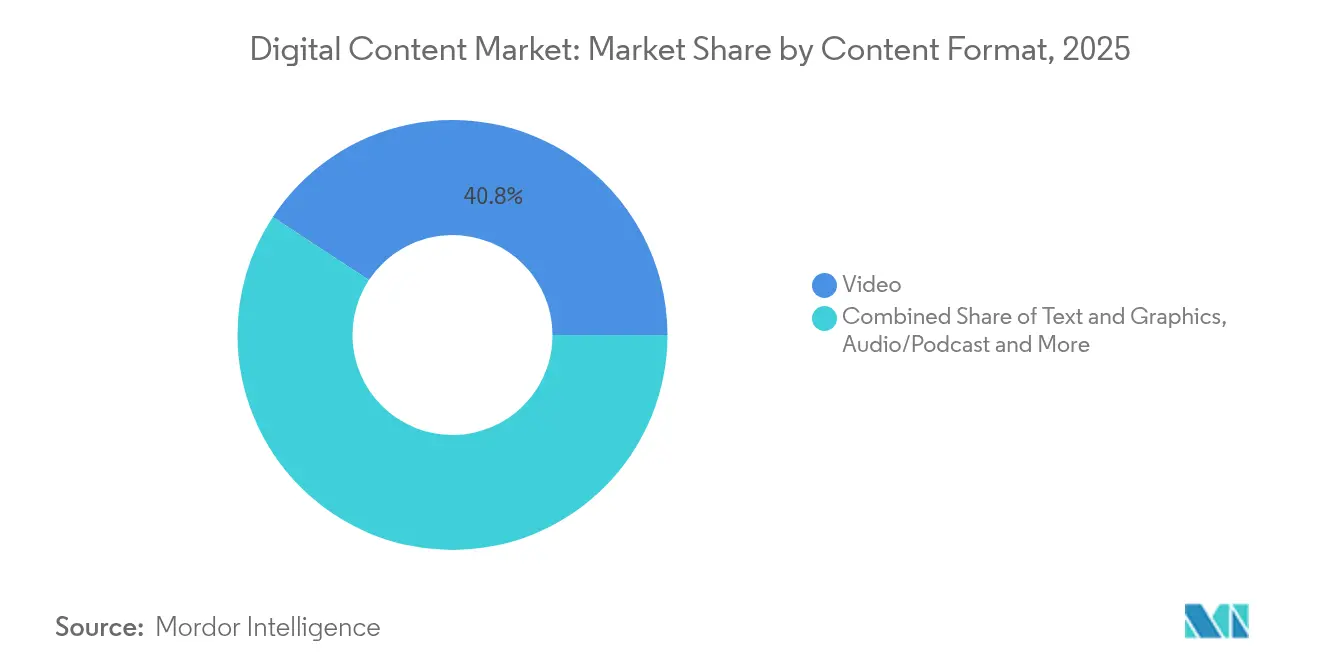
- By content format, video commanded 40.75% of revenue in 2025; interactive AR/VR is projected to surge at a 21.95% CAGR to 2031.
- By end-user industry, media and entertainment captured 36.10% of revenue in 2025, while healthcare is on track for the highest 18.15% CAGR to 2031.
- By geography, North America held 33.20% of revenue in 2025; Asia-Pacific is forecast to outpace all other regions with a 15.45% CAGR to 2031.
Note: Market size and forecast figures in this report are generated using Mordor Intelligence’s proprietary estimation framework, updated with the latest available data and insights as of 2026.
Global Digital Content Market Trends and Insights
Driver Impact Analyis*
| Driver | (~) % Impact on CAGR Forecast | Geographic Relevance | Impact Timeline |
|---|---|---|---|
| Cloud-based authoring suites mainstream adoption | +2.8% | Global, with North America and EU leading enterprise adoption | Medium term (2-4 years) |
| Growth in AI-assisted creative workflows | +3.2% | Global, concentrated in tech-forward markets | Short term (≤ 2 years) |
| Mobile broadband and smartphone penetration surge | +1.9% | Asia-Pacific core, spill-over to MEA and Latin America | Long term (≥ 4 years) |
| Expansion of digital commerce content budgets | +2.1% | Global, with retail-heavy economies prioritizing | Medium term (2-4 years) |
| Generative-AI localization for multicultural markets | +1.7% | Asia-Pacific, MEA, Latin America with language diversity | Medium term (2-4 years) |
| Web3/NFT monetisation models for creators | +0.8% | Global, early adoption in North America and EU | Long term (≥ 4 years) |
| Source: Mordor Intelligence | |||
Cloud-based Authoring Suites Mainstream Adoption
Enterprises pivot toward cloud-native platforms to enable real-time collaboration, automated versioning and AI-powered generation, breaking dependence on desktop-bound tools. Sitecore reported 100% year-on-year revenue growth for its AI-enabled CMS in 2024, with US sales climbing 130%, underscoring enterprise willingness to migrate content operations to the cloud [1]Steve Tzikakis, “Sitecore FY24 Results Press Release,” Sitecore, sitecore.com. Reduced IT overhead, automatic feature updates and global access foster shorter production cycles and distributed creative teams.
Growth in AI-assisted Creative Workflows
Adobe’s Firefly generated more than 16 billion images in 2024, signaling mainstream enterprise integration of generative AI. Teams deploy AI to craft first-draft visuals, iterate variations and personalize assets at scale, achieving creative throughput unattainable through manual methods. Successful adopters preserve human oversight to steer brand voice, framing AI as an accelerator rather than a replacement.
Mobile Broadband and Smartphone Penetration Surge
Smartphone adoption above 92% in many Asia-Pacific economies shifts design priorities to vertical video, micro-interactions and touch-optimized interfaces. Creators require responsive toolchains that support mobile-first layouts while preserving cross-platform consistency. Platforms excelling at mobile content generation gain traction among consumer brands eager to reach on-the-go audiences.
Expansion of Digital Commerce Content Budgets
Retailers attribute 47% of mobile purchases to social media influence, prompting larger allocations to shoppable media, influencer collaborations and 3D product visualizations. Integrated content-commerce ecosystems that merge creative tools with commerce engines raise conversion rates and customer dwell times, cementing content quality as a competitive moat.
Restraint Impact Analysis*
| Restraint | (~) % Impact on CAGR Forecast | Geographic Relevance | Impact Timeline |
|---|---|---|---|
| High licence cost of premium creative software | -1.8% | Global, particularly affecting SMEs in emerging markets | Short term (≤ 2 years) |
| Data-privacy and IP-infringement concerns | -1.2% | EU and North America with strict regulatory frameworks | Medium term (2-4 years) |
| GPU compute bottlenecks for AI pipelines | -0.9% | Global, concentrated in AI-intensive applications | Short term (≤ 2 years) |
| Creator fatigue and trust erosion from deep-fake content | -0.7% | Global, with higher impact in content-heavy industries | Long term (≥ 4 years) |
| Source: Mordor Intelligence | |||
High Licence Cost of Premium Creative Software
Price hikes accompany AI upgrades. Canva tripled Teams plan fees in 2025 to fund feature development, placing strain on smaller firms. Adobe’s subscription model adds recurring costs that swell in regions exposed to currency volatility. The squeeze nudges budget-conscious users toward freemium or open-source alternatives, fragmenting demand.
Creator Fatigue and Trust Erosion from Deep-fake Content
As synthetic media proliferate, audiences question authenticity. Brands add provenance tags and watermarking to reassure viewers, complicating post-production workflows. Regulatory proposals in the EU would mandate disclosure of AI-generated material, increasing compliance overhead [2]European Commission, “Digital Services Act: New Rules for Online Platforms,” European Commission, ec.europa.eu. Influencer campaigns feel the impact first, where credibility underpins engagement.
*Our forecasts treat driver/restraint impacts as directional, not additive. The impact forecasts reflect baseline growth, mix effects, and variable interactions.
Segment Analysis
By Component : Services Accelerate AI Integration
Solutions retained 71.05% revenue in 2025, yet Services will outpace with a 17.25% CAGR to 2031 as firms seek expertise to operationalize AI pipelines. The digital content market size for Services, while smaller today, captures premium consulting fees tied to workflow redesign and cloud migrations. Vendors such as Adobe broaden professional-service offerings in India through Microsoft alliances to secure implementation revenue.
Growth hinges on knowledge gaps: enterprises require data-engineering, prompt-engineering, and change-management skills beyond internal capacity. Managed-service models covering model training, content QA, and localization create recurring revenue that cushions license cyclicality. Services also include smooth onboarding for SMEs lacking in-house IT staff, bolstering platform stickiness as AI complexity rises.


By Deployment Mode : Cloud Dominance Accelerates
Cloud environments accounted for 75.65% of digital content market share in 2025 and are forecast to rise faster than on-premises by an additional 19.65% CAGR, reflecting demand for elastic GPU clusters and always-current feature stacks. Microsoft’s Azure-based integration with Adobe Creative Cloud evidences the shift, giving customers direct access to high-end AI models without local hardware.
The digital content market size associated with on-premises deployments contracts as security, compliance, and latency objections fade amid maturing cloud controls. Highly regulated sectors still favor private clouds, yet even these opt for hybrid models that keep sensitive data local while offloading rendering tasks to public GPU farms. Google Cloud’s AI-accelerated workstations illustrate the economics: a subscription cadence trumping capital-heavy local servers.
By Enterprise Size : SME Growth Drives Democratization
Large enterprises held 62.05% of revenue in 2025, but SMEs will grow at 16.15% CAGR to 2031, highlighting democratization. Simplified toolsets mask AI complexity behind no-code interfaces, lowering barriers to professional-grade output. Figma posted USD 700 million ARR in 2025 by serving start-ups and corporates alike .
Subscription pricing aligns with SME cash flow, and cloud delivery sidesteps hardware spend. The digital content industry also sees community-driven learning resources that accelerate skill acquisition outside formal training budgets. Meanwhile, large firms deepen investments in dedicated creative ops teams and cross-department asset hubs, reinforcing their scale advantage even as growth moderates.
By Content Format : Interactive Experiences Lead Innovation
Video dominated 40.75% of revenue in 2025 due to algorithmic promotion on social platforms, yet AR/VR will sprint ahead at a 21.95% CAGR, buoyed by enterprise use cases in training and virtual showrooms. NVIDIA’s CloudXR streams immersive scenes from the edge, mitigating device limits .
Unified platforms that handle video, 3D and interactive assets within one pipeline gain favor, lowering context-switching friction. The digital content market size for AR/VR creation tools remains modest but carries outsized strategic importance as firms pilot metaverse-style customer engagements. Third-party plug-ins that convert traditional video timelines to volumetric scenes help existing creators move up the immersion curve without re-skilling from scratch.
By End-user Industry : Healthcare Transformation Accelerates
Media and entertainment retained 36.10% revenue in 2025, reflecting its historical leadership, yet healthcare will post an 18.15% CAGR to 2031. Patient education modules, digital therapeutics and telemedicine portals demand interactive, multilingual assets governed by strict compliance. Firms embed generative AI to tailor visuals to health-literacy levels and languages simultaneously, shrinking localization cycles.
Retail and e-commerce push dynamic product imagery that updates with inventory, while BFSI employs motion graphics to humanize complex terms. Automotive leverages 3D configurators for trim visualization, and education deploys gamified lessons to improve retention. Government portals require accessibility features by default, driving procurement of platforms with native captioning and alt-text generation.
Geography Analysis
North America generated 33.20% of revenue in 2025, aided by a dense cluster of creative-tech firms and early enterprise AI adoption. Growth now tracks upgrades rather than greenfield rollout, so vendors emphasize vertical-specific modules and workflow consolidation. Europe balances innovation with stringent privacy rules, spurring demand for sovereign clouds and transparent AI audit trails. The Digital Services Act intensifies scrutiny of user content, prompting uptake of compliance-ready creation suites.
Asia-Pacific is the fastest mover at 15.45% CAGR due to mobile-first behavior and massive localization needs. The digital content market size attached to local-language generation rises as brands pursue regional authenticity. Government stimulus for 5G and cloud hubs in India and Southeast Asia further trims infrastructure obstacles.
Latin America and the Middle East and Africa remain nascent but attractive. Mobile data packages become cheaper, unlocking creator economies where low-cost, cloud-based tools allow freelancers to serve global clients. Currency swings keep price sensitivity high, rewarding vendors with tiered offerings and usage-based billing.

Competitive Landscape
The market shows moderate concentration. Adobe recorded USD 21.51 billion revenue in fiscal 2024 on 11% growth fueled by the Firefly roll-out. Microsoft embeds design prompts into Microsoft 365, tying content workflows to its productivity stack.
Challengers disrupt through simplicity and community reach. Canva’s acquisition of Affinity broadens pro-grade features while preserving drag-and-drop ease, an illustration of platform convergence. Figma’s Anthropic alliance adds text-to-app capabilities that automate prototype creation, shortening idea-to-asset timeframes.
Strategic moves include ecosystem expansion, AI model partnerships, and regional data-center investments to meet sovereignty laws. In vertical niches, MedTech-focused vendors pre-train models on clinical imagery, while automotive platforms offer CAD integrations for part libraries. Pricing competition moderates as vendors bundle analytics, DAM, and collaboration to lock in annual contracts.
Digital Content Industry Leaders
Adobe Inc.
Microsoft Corporation
Apple Inc.
Canva Pty Ltd
Corel Corporation
- *Disclaimer: Major Players sorted in no particular order

Recent Industry Developments
- May 2025: Figma released AI tools that generate complete websites and marketing assets from prompts, moving beyond static design.
- April 2025: Figma partnered with Anthropic to launch a conversational app maker powered by image and text inputs.
- January 2025: Adobe and Microsoft integrated AI agents into Microsoft 365 Copilot, giving marketers voice-driven creative assistance.
- October 2024: Adobe unveiled Firefly Video Model and Gen Studio at Adobe MAX 2024, extending generative AI to video editing.


Research Methodology Framework and Report Scope
Market Definitions and Key Coverage
Our study defines the digital content market as the worldwide revenue earned by vendors that supply software-centric platforms, cloud tools, and professional services enabling enterprises to create, manage, secure, and transmit text, graphics, audio, video, and immersive files across IP networks.
Scope exclusion: consumer spend on streaming subscriptions, in-app purchases, digital advertising, and hardware devices lies outside this remit.
Segmentation Overview
- By Component
- Solutions
- Services
- By Deployment Mode
- Cloud
- On-Premises
- By Enterprise Size
- Large Enterprises
- Small and Medium Enterprises
- By Content Format
- Text and Graphics
- Video
- Audio/Podcast
- Interactive (AR/VR, 3D)
- By End-user Industry
- Media and Entertainment
- Retail and E-commerce
- Healthcare and Life Sciences
- Automotive
- BFSI
- Education
- Government and Public Sector
- Manufacturing and Industrial
- By Geography
- North America
- United States
- Canada
- Mexico
- South America
- Brazil
- Argentina
- Rest of South America
- Europe
- Germany
- United Kingdom
- France
- Italy
- Spain
- Russia
- Rest of Europe
- Asia-Pacific
- China
- Japan
- India
- South Korea
- Australia and New Zealand
- Rest of Asia-Pacific
- Middle East and Africa
- Middle East
- Saudi Arabia
- UAE
- Turkey
- Rest of Middle East
- Africa
- South Africa
- Nigeria
- Egypt
- Rest of Africa
- Middle East
- North America
Detailed Research Methodology and Data Validation
Primary Research
Mordor analysts held structured interviews with product leads at content-software vendors, cloud architects, digital agencies, and procurement owners in media, retail, healthcare, government, and education across North America, Europe, and Asia. These conversations validated adoption rates, typical contract values, and regional budget intentions, and closed residual desk-research gaps.
Desk Research
We mapped the space through public datasets from the ITU (broadband reach), UN Comtrade (digital trade codes), the U.S. BEA digital-economy tables, and IAB advertising barometers. We then blended them with company filings and news captured in D&B Hoovers and Dow Jones Factiva to separate product and service lines. The sources listed are illustrative, not exhaustive; additional items underpinned every data check.
Market-Sizing & Forecasting
We started with a top-down parse of enterprise software and IT-services spend reported by national statistics offices, isolating the share linked to content workflows through penetration ratios confirmed during interviews. Targeted bottom-up checks sampled vendor roll-ups and reseller channel scans adjusted for under-reported cloud revenue. Key variables modeled include smartphone subscriptions, average downstream speed, corporate digital-ad budgets, SaaS price movement, and compliance mandates. A multivariate regression of these drivers produced a base value and an outlook, implying a growth rate. Scenario analysis tempers the forecast where policy risk or sudden technology shifts loom.
Data Validation & Update Cycle
Outputs pass a two-step analyst review and variance screen against external indices every quarter. Reports refresh annually, with interim reruns for material events, so clients receive the latest view.
Why Mordor's Digital Content Baseline Deserves Confidence
Published estimates often diverge because firms pick different revenue pools, horizon years, and refresh cadences.
Key gap drivers include whether consumer media spend is folded in, how unpaid open-source deployments are treated, and the currency conversion date used; Mordor fixes rates at the June average to limit volatility.
Benchmark comparison
| Market Size | Anonymized source | Primary gap driver |
|---|---|---|
| USD 35.22 B | Mordor Intelligence | - |
| USD 195.71 B | Global Consultancy A | Includes consumer OTT, mobile gaming, and advertising flows outside our scope |
| USD 36.38 B | Trade Journal B | Counts authoring tools only; omits managed service revenue captured by Mordor |
These comparisons show that our disciplined scope selection and transparent variable mapping deliver a balanced, repeatable baseline decision-makers can trust.


Key Questions Answered in the Report
What is the current value of the digital content market?
The market is worth USD 39.61 billion in 2026.
How fast is the digital content market expected to grow?
It is forecast to expand at a 12.45% CAGR, reaching USD 71.19 billion by 2031.
Which deployment model leads the digital content market?
Cloud deployment owns 75.65% revenue and is projected to grow at 19.65% CAGR.
Which content format is growing the quickest?
Interactive AR/VR creation tools are advancing at a 21.95% CAGR through 2031.
Why is healthcare the fastest-growing end-user?
Digital therapeutics and compliance-driven patient education demand specialized interactive content, pushing healthcare at an 18.15% CAGR.
Which region will see the highest market growth?
Asia-Pacific is set to increase at a 15.45% CAGR due to mobile-first adoption and localization needs.
Page last updated on:


