
Market Overview
| Study Period | 2020 - 2031 |
|---|---|
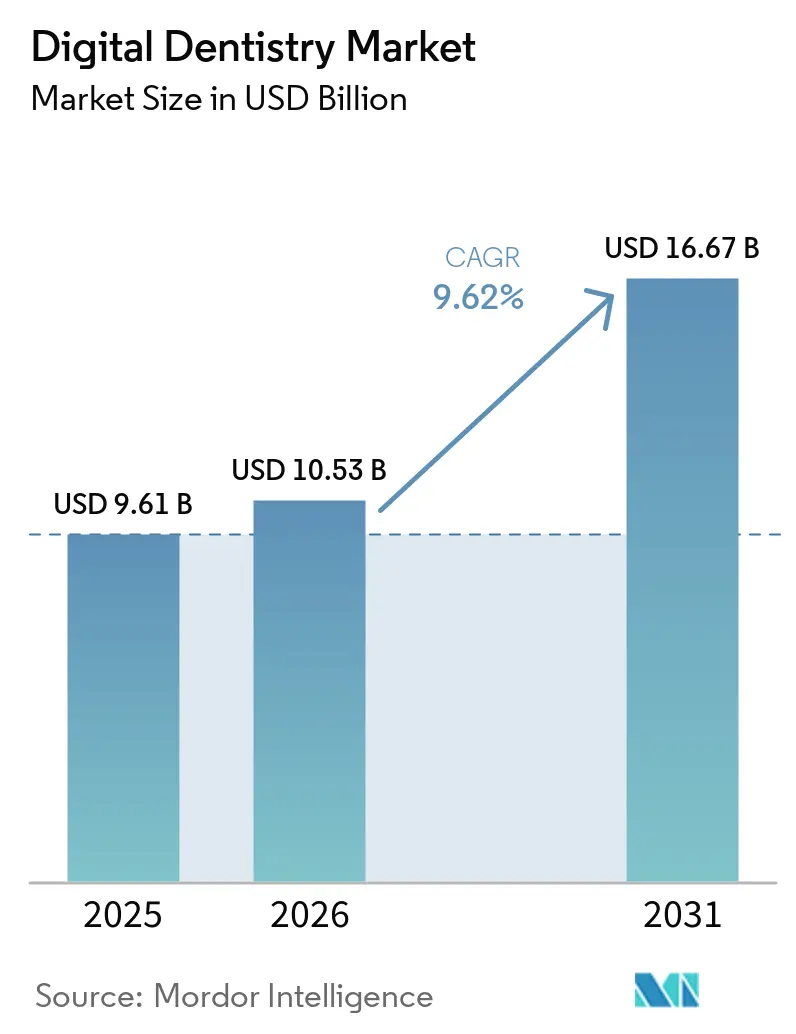
| Market Size (2026) | USD 10.53 Billion |
| Market Size (2031) | USD 16.67 Billion |
| Growth Rate (2026 - 2031) | 9.62 % |
| Fastest Growing Market | Asia-Pacific |
| Largest Market | North America |
| Market Concentration | Medium |
Major Players *Disclaimer: Major Players sorted in no particular order Image © Mordor Intelligence. Reuse requires attribution under CC BY 4.0. | |
Digital Dentistry Market Analysis by Mordor Intelligence
The digital dentistry market size is projected to expand from USD 9.61 billion in 2025 and USD 10.53 billion in 2026 to USD 16.67 billion by 2031, registering a CAGR of 9.62% between 2026 and 2031. Rapid replacement of analog impression trays with intraoral scanners, chairside milling units and AI-assisted diagnostic software is compressing treatment cycles, widening procedure menus and lifting chair utilization. Dental service organizations (DSOs) are pooling capital expenditure to deploy integrated digital platforms across multi-site networks, accelerating equipment refresh even in price-sensitive practices. Regulatory clearances for 3D-printable ceramic crowns are shrinking laboratory turnaround from weeks to hours, while open-architecture scanners enable third-party AI developers to layer decision-support algorithms directly onto practitioner workflows. Competitive differentiation is shifting from standalone hardware to ecosystem control: incumbents bundle scanners, mills and proprietary materials inside service contracts, but software-first entrants are unbundling value through modular, cloud-connected applications. Against this backdrop the digital dentistry market rewards vendors that combine hardware reliability, software agility and evidence-based clinical claims.
Key Report Takeaways
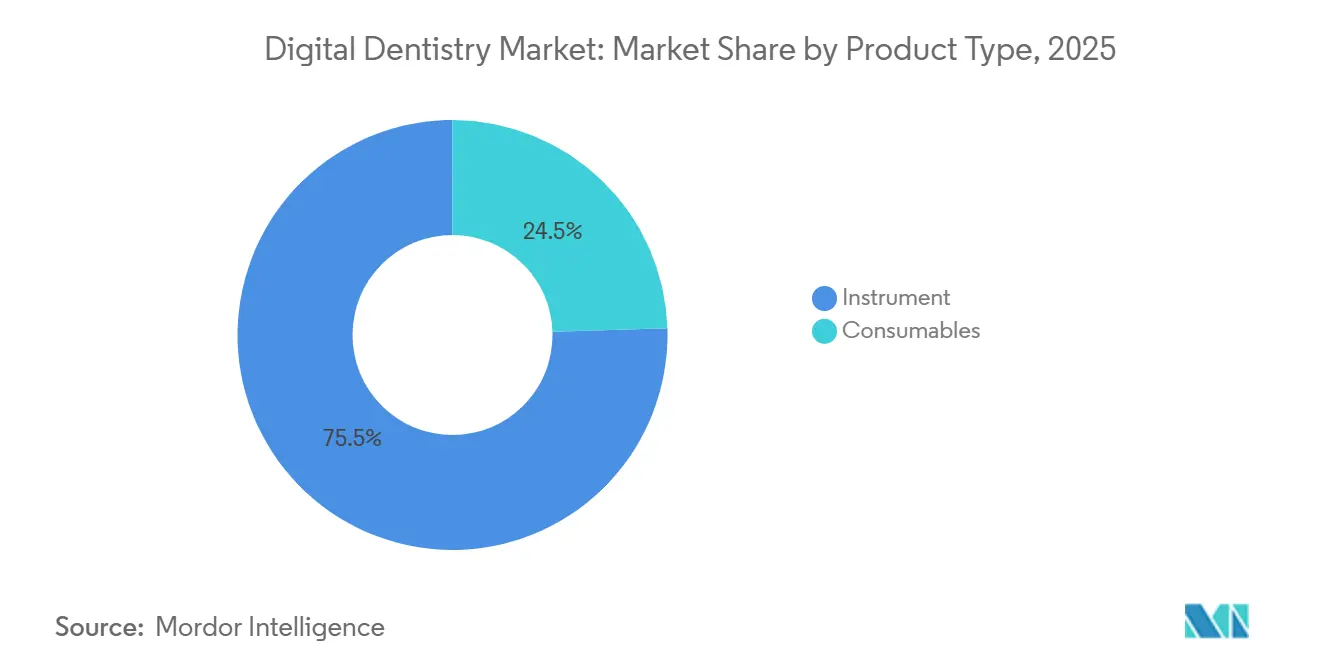
- By product type, instruments led with 75.54% revenue share in 2025; the segment is poised to advance at a 10.25% CAGR through 2031.
- By specialty, restorative dentistry commanded 34.54% share of the digital dentistry market size in 2025, while implantology is projected to grow at 11.65% from 2026-2031.
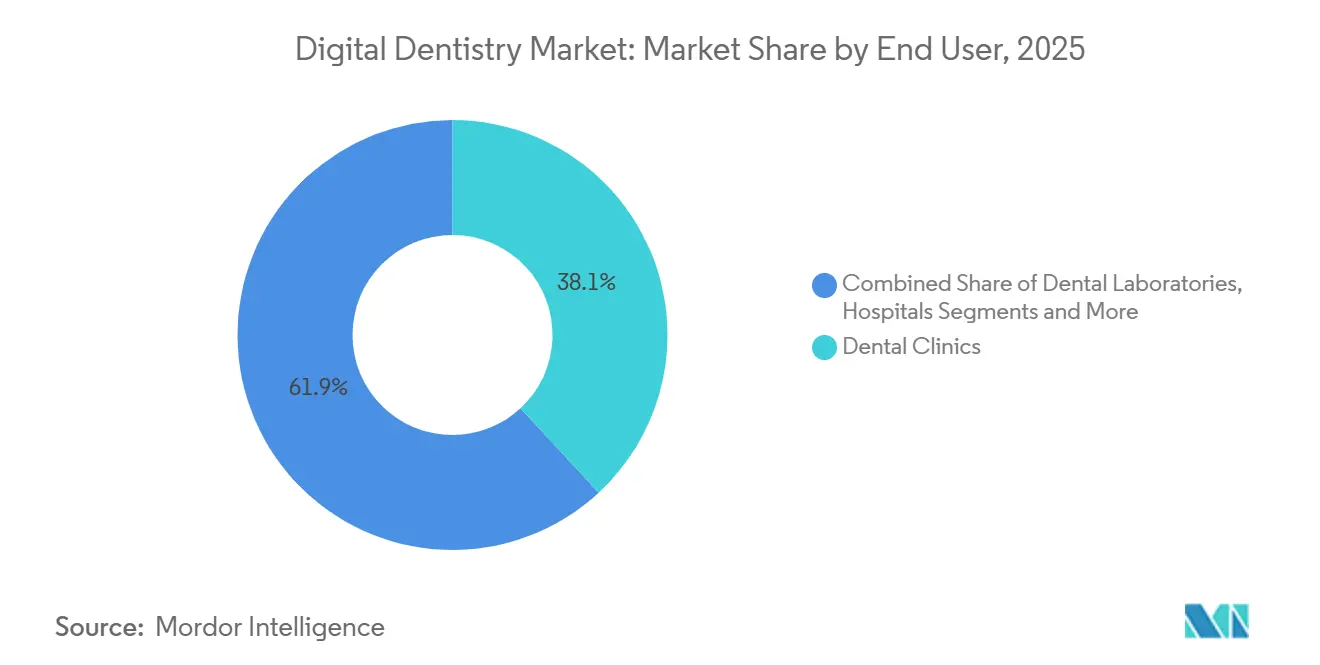
- By end user, dental clinics held 38.15% of digital dentistry market share in 2025; dental laboratories represent the fastest expansion path with a 10.82% CAGR to 2031.
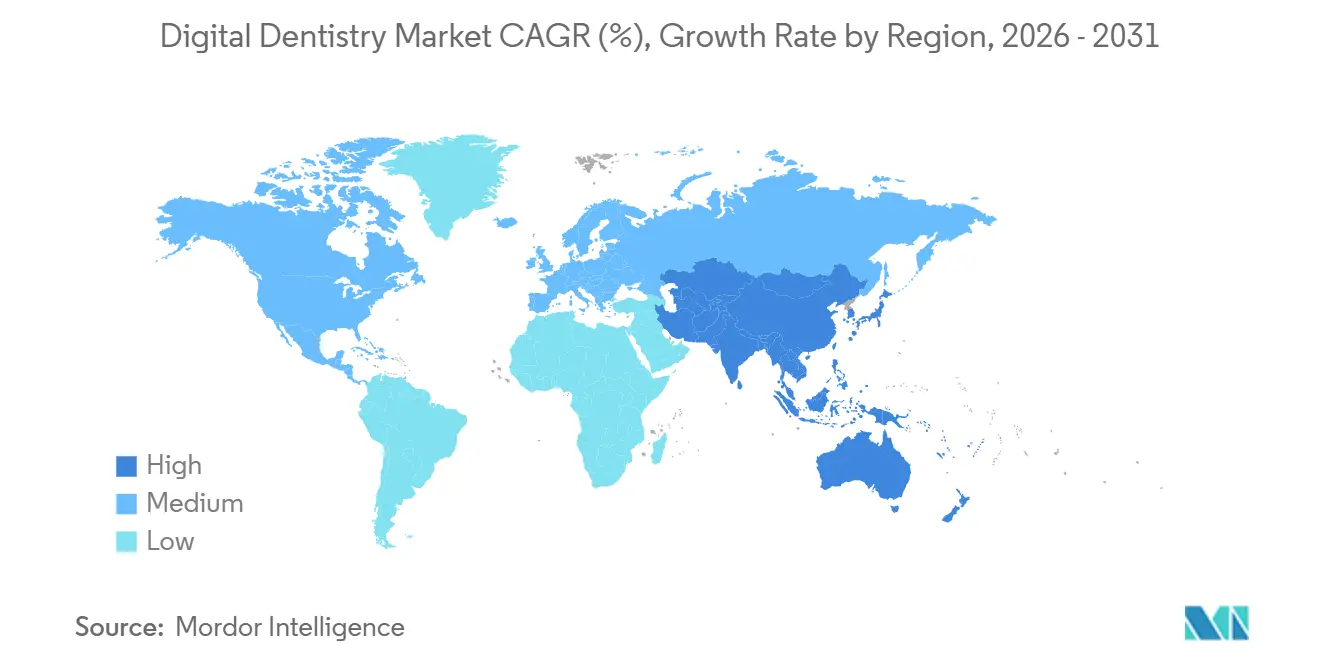
- By geography, North America captured 38.53% revenue share in 2025, whereas Asia-Pacific is set to grow at a 10.1% CAGR during 2026-2031.
Note: Market size and forecast figures in this report are generated using Mordor Intelligence’s proprietary estimation framework, updated with the latest available data and insights as of January 2026.
Market Trends and Insights
Drivers Impact Analysis of Digital Dentistry Market*
| Driver | % Impact on CAGR Forecast | Geographic Relevance | Impact Timeline |
|---|---|---|---|
| Rapid adoption of chairside CAD/CAM systems | +2.1% | Global – North America & Europe lead | Medium term (2-4 years) |
| Growing geriatric edentulous population | +1.8% | North America, Europe, aging Asia-Pacific | Long term (≥ 4 years) |
| Rising demand for cosmetic/aesthetic dentistry | +1.5% | North America, Europe, urban Asia-Pacific | Short term (≤ 2 years) |
| Consolidation of DSOs pooling capex | +2.3% | North America expanding into Europe and Asia-Pacific | Medium term (2-4 years) |
| Regulatory green-lights for 3D-printable crowns | +1.2% | North America & Europe initially | Medium term (2-4 years) |
| Open-architecture scanners enabling AI apps | +0.9% | Global with early uptake in tech-forward practices | Short term (≤ 2 years) |
| Source: Mordor Intelligence | |||
Rapid Adoption of Chairside CAD/CAM Systems
Chairside CAD/CAM units cut restorative workflows from two appointments across 10-14 days to a single 90-minute visit, freeing late-afternoon slots for higher-margin crowns[1]U.S. Food and Drug Administration, “510(k) Premarket Notification Database,” fda.gov. Dentsply Sirona’s CEREC Cercon 4D Abutment, cleared in May 2024, lets practitioners mill titanium-base abutments in-office, eliminating USD 150-250 laboratory fees per case. Solventum and SprintRay are co-developing chairside 3D-printed permanent crowns for a USD 7.5 billion global restoration pool, leveraging 20,000 installed printers to fuse ceramic-like esthetics with resin economics. Such advances raise throughput without extra operatory build-out, reinforcing the digital dentistry market’s appeal to high-volume practices. Subscription-based equipment bundles that convert capital expenditure into operating expense further widen access among volume-constrained dentists.
Growing Geriatric Edentulous Population
Individuals aged 65+ will constitute 16% of the world’s population by 2030, expanding full-arch restoration demand in North America, Europe and mature Asia-Pacific markets. Digital denture workflows trim patient visits from five to three, lowering chair time by 40% while automated occlusal algorithms improve fit. A 2024 Journal of Prosthetic Dentistry study reported milled dentures show 30-50% lower vertical dimension error than compression-molded acrylic, cutting post-delivery adjustments. Labs responding to geriatric case-mix are investing in 5-axis mills and multi-material 3D printers; 3D Systems’ NextDent Denture 3D+ resin, FDA-cleared in September 2024, enables base-and-tooth co-printing. These gains reinforce long-term unit volumes that underpin the digital dentistry market.
Rising Demand for Cosmetic/Aesthetic Dentistry
Align Technology shipped 2.78 million clear-aligner cases in Q3 2024, aided by iTero’s real-time outcome simulator that collapses consultation cycles[2]Align Technology, “Q3 2024 Earnings Release,” aligntech.com. A 2024 American Academy of Cosmetic Dentistry survey found 58% of 18-34-year-olds cite Instagram and TikTok as primary dental-treatment information sources. Digital smile-design tools convert this social-media interest into chairside commitments by showing photorealistic previews during a single visit. Veneer and whitening providers piggyback on aligner trendlines, using the same intraoral scans for restorative mock-ups, which sustains discretionary procedure growth within the digital dentistry market.
Consolidation of DSOs Pooling Capex for Digital Tech
More than 200 practice acquisitions in 2024 raised U.S. DSO penetration to 27%, with forecasts of 39% by 2028. Guardian Dentistry Partners standardized Denticon management, Pearl AI diagnostics and Apteryx imaging across 160-plus sites, securing 20-30% scanner discounts via centralized procurement. Dental365 achieved a 12% increase in restorative case acceptance within one quarter of chain-wide AI deployment in 2025. DSOs convert digital dentistry market investments into scalable clinical protocols, squeezing independent offices on speed, price and outcome consistency.
Restraints Impact Analysis of Digital Dentistry Market*
| Restraint | (~) % Impact on CAGR Forecast | Geographic Relevance | Impact Timeline |
|---|---|---|---|
| High upfront equipment and maintenance costs | –1.4% | Global; acute in emerging Asia-Pacific | Short term (≤ 2 years) |
| Limited reimbursement of digital restorations | –0.9% | North America & Europe where insurance is widespread | Medium term (2-4 years) |
| Vendor lock-in to closed CAD/CAM ecosystems | –0.6% | Global; legacy install bases | Long term (≥ 4 years) |
| Post-market algorithm drift oversight | –0.5% | FDA/EMA jurisdictions | Medium term (2-4 years) |
| Source: Mordor Intelligence | |||
High Upfront Equipment and Maintenance Costs
Intraoral scanners cost USD 30,000-50,000, mills USD 80,000-120,000 and furnaces USD 15,000-25, creating a steep entry barrier for volume-constrained practices. Annual service adds USD 5,000-8,000 per device[3]American Dental Association, “2024 Survey of Dental Practice,” ada.org. Break-even requires 300-500 restorative cases, a volume 40% of U.S. offices cannot reach. Subscription bundles such as Dentsply Sirona’s USD 1,200-per-month CEREC plan convert capex to opex, lowering risk and preserving vendor revenue. Until financing models proliferate, high costs will temper short-term diffusion of the digital dentistry market.
Limited Reimbursement of Digital Restorations
U.S. payers reimburse digital and conventional impressions identically under CDT codes D0350 and D0393, undercutting ROI for chairside scanners unless throughput rises. Medicaid rates average 30-50% below private insurance despite 2024 increases in California and Texas. The gap widens adoption disparities: DSOs amortize equipment across many sites, while solo practices self-finance purchases, slowing their entry into the digital dentistry market.
*Our forecasts treat driver/restraint impacts as directional, not additive. The impact forecasts reflect baseline growth, mix effects, and variable interactions.
Digital Dentistry Market Segment Analysis
By Product Type:
Instruments Dominate Revenue While Consumables TrailInstruments accounted for 75.54% of revenue in 2025 and are forecast to grow at 10.25% through 2031 as practices prioritize capability-unlocking equipment ahead of recurring materials. Within this category, imaging systems form the digital twin that anchors every downstream workflow, cementing their must-buy status in the digital dentistry market. Chairside CAD/CAM units replace laboratory turnaround with same-day restorations, letting clinics internalize lab margins. Dentsply Sirona’s Primescan 2 wireless scanner completes full-arch scans in under 60 seconds and uploads to cloud CAD hubs, enabling overnight offshore design services that stretch chair productivity.
3D printers and mills are converging as hybrid units emerge, letting labs toggle between subtractive and additive fabrication without doubling floor space. Software is shifting to subscription bundles that fold practice management, imaging viewers and AI triage into USD 300-500 per-provider monthly plans. Sensors and IoT-enabled handpieces remain niche but rising, feeding predictive-maintenance dashboards that cut downtime. Consumables expand more slowly because digital impressions eliminate 90% of polyvinyl siloxane waste, lowering volumes even as unit prices for resins and ceramics rise. The digital dentistry market size for consumables still scales with installed equipment, but margin leverage is strongest on high-utility instruments.


By Specialty:
Implantology Outpaces Restorative as Guided Surgery ScalesRestorative dentistry retained 34.54% revenue share in 2025, reflecting the ubiquity of crown-and-bridge work. Yet implantology will post an 11.65% CAGR through 2031, the fastest among specialties, as guided-surgery software converts CBCT data into printable drill guides that cut chair time by 20-30%. Straumann’s CARES ecosystem integrates scanning, planning and bar-milling inside a single file, driving implant survival to 98.2% at five years, edging out freehand placement. Such evidence underwrites premium fees and expands the digital dentistry market size among surgically oriented clinics.
Orthodontics maintains high growth as clear aligner adoption spreads to teens. The iTero outcome simulator visualizes results in one appointment, lifting case-acceptance and sustaining scanner sales. Prosthodontics digitalizes more slowly because multi-material, full-arch protocols remain complex, though multi-jet printers are closing gaps. Niche fields such as endodontics and periodontics use CBCT-guided root-canal therapy and laser adjuncts mainly in specialist centers, contributing modest revenue yet reinforcing the digital dentistry market’s breadth.
By End User:
Laboratories Digitalize to Defend RelevanceDental clinics supplied 38.15% revenue in 2025, but laboratories are projected to grow 10.82% through 2031 as they pivot to digital manufacturing. Independent labs invest in 5-axis mills and resin printers to deliver multi-unit bridges and full-arch dentures that chairside mills cannot economically produce, preserving their place in the digital dentistry market. A 2024 NADL survey found 62% of labs purchased advanced equipment in the prior year, up from 48% in 2023.
DSOs emerge as a third force, rolling standardized AI diagnostics across hundreds of operatories to monetize scale. Guardian Dentistry Partners’ chain-wide Pearl AI deployment exemplifies algorithmic centralization that boosts restorative conversion. Hospitals and universities, though smaller revenue nodes, seed long-term adoption by validating emerging robotic dentistry workflows such as robotic implant placement. Their research output influences payers and regulators, indirectly shaping the digital dentistry market share balance among end users.

Geography Analysis
North America Digital Dentistry Market
North America retained 38.53% of 2025 revenue, buoyed by early AI approvals, mature insurance coverage and high DSO density. The U.S. leads scanner and CBCT replacement cycles, though growth moderates as installed bases mature. Canada mirrors these patterns, albeit with slower DSO penetration due to differing provincial reimbursement. Regulatory clarity from the FDA on AI/ML SaMD keeps venture capital active, sustaining North American innovation nodes within the digital dentistry market.
Europe Digital Dentistry Market
Europe contributes steady volume underpinned by universal dental coverage and strict Medical Device Regulation oversight that stretches product launch timelines but elevates safety. Straumann derived 46% of 2024 revenue from EMEA, capitalizing on dense implantology networks in Germany, France and Italy. Southern European economies adopt digital workflows more slowly, restrained by lower discretionary spending, yet public procurement of imaging systems is rising under EU recovery-fund allocations.
APAC Digital Dentistry Market
Asia-Pacific is the fastest-growing geography at a 10.1% CAGR to 2031, propelled by China’s digital-health mandates and India’s expanding middle-class appetite for cosmetic procedures. Chinese state-owned dental chains are bulk-ordering intraoral scanners to standardize treatment quality, while Indian clinics market same-day veneers to dental-tourism clients. Japan and South Korea leverage aging demographics to scale full-arch restoration volumes. Southeast Asia lags but leapfrogs with mobile-based smile-design apps that funnel patients to urban hubs. Collectively the region enlarges the digital dentistry market size, offsetting North American saturation.
MEA and LATAM Digital Dentistry Market
The Middle East and Africa remain nascent: high-end private clinics in the Gulf import CAD/CAM suites for affluent patients, yet public systems rely on analog impressions. Latin America shows city-center adoption; São Paulo and Buenos Aires house boutique practices offering clear aligners at 40-60% below U.S. prices, expanding digital dentistry market share despite macro volatility.

Regulatory Landscape
Regulation for digital dentistry spans traditional dental device rules and expanding oversight of software and connected workflows. In the United States, dental devices continue to be regulated under 21 CFR Part 872, and FDA guidance has clarified how clinical software is treated. The final Clinical Decision Support Software guidance issued on January 29, 2026 explains when image-analysis software used to generate 3D models for planning dental surgical treatments constitutes a regulated device function.
As software, cloud connectivity, and AI are built into scanners, CBCT systems, and CAD/CAM workflows, regulators and standards bodies are emphasizing documentation, interoperability, and security. On February 3, 2026, the FDA updated its Cybersecurity in Medical Devices guidance, raising compliance expectations for software-enabled dental devices and associated lifecycle controls. ISO also published dental digital-workflow standards, including ISO 18739:2026 (CAD/CAM process-chain vocabulary) and ISO 10451:2026 (technical file content for dental implant systems), alongside ISO 18618:2025 and ISO 18374:2025 covering CAD/CAM interoperability and AI-enabled 2D radiograph analysis. In Europe, the European Commission introduced a legislative proposal on December 16, 2025 to amend Regulation (EU) 2017/745 (EU MDR), focusing on workability for manufacturers, including those supporting custom-made device pathways relevant to dental laboratories.
Competitive Landscape
The digital dentistry market features moderate concentration: the top five vendors hold a significant share of revenue, balancing scale benefits against innovation from niche challengers. Align Technology dominates clear aligners through continuous algorithmic refinement of tooth-movement staging, reinforced by a captive iTero scanner base. Dentsply Sirona anchors its installed mills and furnaces with exclusive ceramic blocks, capturing aftermarket consumable margins. Straumann’s 2024 acquisition of Abutment Direct deepens vertical integration, bundling implants, scanners and bars into a cradle-to-restoration continuum.
Open-architecture specialists 3Shape and Medit counter with hardware that exports universal STL files, enabling dentists to shop cad-design and milling services. Their success pressures incumbents to loosen APIs or risk defections. Software-first entrants Pearl and Overjet monetize diagnostic algorithms via annual SaaS fees, a capital-light model that scales rapidly across DSOs without hardware swaps. 3D-printing companies Formlabs and Stratasys commoditize lab fabrication with sub-USD 10,000 desktop units, drawing volume from centralized labs.
Strategic moves include hybrid equipment launches that blend milling and printing, AI-embedded acquisition software that trims manual edits, and subscription bundles that smooth cash flow for price-sensitive buyers. Competitive risk increasingly hinges on data ownership: vendors that aggregate millions of scans can train proprietary AI, fortifying loyalty. Overall, the digital dentistry market values ecosystem breadth, evidence-backed claims and flexible financing over standalone device specs.
Digital Dentistry Industry Leaders
Dentsply Sirona
Align Technology
Straumann Group
Planmeca Oy
3Shape A/S
- *Disclaimer: Major Players sorted in no particular order

Digital Dentistry Market Companies Covered in this Report
- Align Technology
- Dentsply Sirona
- Solventum Corporation
- Ivoclar Vivadent
- Straumann Group
- Envista Holdings (Kerr, Nobel Biocare)
- Planmeca
- 3 Shape
- Formlabs Inc.
- Stratasys
- Carestream Dental
- Vatech Co. Ltd.
- Kulzer
- GC Corporation
- J. Morita Corp.
- Apteryx Imaging (Planet DDS)
- Amann Girrbach
- Exocad GmbH
- Zimvie
- Shofu Inc.
- Voco GmbH

Market Opportunities and Future Outlook
White space is opening around software-defined dentistry, where AI modules sit on top of existing imaging and scanning footprints. This is most visible in DSOs and multi-site clinic networks that can standardize protocols and manage vendor accountability at scale. Together, the January 29, 2026 FDA Clinical Decision Support Software guidance and the February 3, 2026 FDA cybersecurity guidance reinforce procurement preferences for vendors that provide evidence, documentation, and lifecycle controls for AI-assisted diagnostics and cloud-connected workflows. Open-architecture workflows also benefit from interoperability efforts, including ISO 18618:2025, which reduces friction for third-party design, planning, and AI layers across scanner and CAD/CAM ecosystems.
A second opportunity cluster is digitally fabricated prosthetics and dentures. Peer-reviewed evidence continues to validate outcomes and also points to what still constrains broader conversion. Research published in BMC Oral Health in February 2026 described a fully automated AI framework for individualized occlusal surface reconstruction with quantitative accuracy and expert endorsement, supporting further automation in restorative CAD steps. A narrative review in The Saudi Dental Journal in April 2026 reported comparable or superior outcomes for digitally fabricated complete dentures versus conventional methods in retention and patient satisfaction, while also flagging the need for long-term clinical follow-up beyond three years. With tighter EU MDR lifecycle clinical evaluation expectations (Article 61 and Annex XIV) alongside the European Commission’s December 2025 proposal to amend the MDR, the commercial pathway for vendors and laboratories centers on pairing validated materials and workflows with compliant clinical and post-market evidence generation.
Recent Industry Developments in Digital Dentistry Market
- July 2026: Align Technology announced plans to build a new manufacturing facility in Hyderabad, India, as part of expanding its global operations footprint. The investment is positioned to add manufacturing capacity closer to high-growth demand centers and diversify supply-chain risk across regions.
- May 2026: Dentsply Sirona launched Smart View - Detect, an AI-enabled diagnostic aid for identifying periapical radiolucencies in CBCT scans, and stated it received FDA clearance and CE marking. The clearance and marking support broader clinical deployment of AI-assisted interpretation within established imaging workflows, reinforcing the shift toward software-led differentiation in digital dentistry.
- July 2025: 3D Systems commercially released the NextDent Jetted Denture Solution in the United States, enabling monolithic, multi-material dentures produced within a single print cycle. The move strengthens the case for additive manufacturing in high-throughput laboratory dentures and increases competitive pressure on milling-centric workflows.


Digital Dentistry Market Report Scope and Research Methodology
Market Definition and Coverage
This market covers revenues earned from digital tools and software used to capture, plan, fabricate, and monitor dental procedures, including chairside and laboratory workflows where computer-controlled data is central to treatment delivery.
Scope exclusions: We exclude purely analog dentistry equipment and generic clinic IT that is not directly linked to digital clinical imaging, design, or manufacturing workflows.
Segments Covered in This Report
- By Product Type
- Instrument
- Imaging Systems
- Intra-oral Scanners
- CBCT & Digital X-ray
- CAD/CAM Systems
- Chairside Systems
- Laboratory Systems
- 3-D Printing Equipment
- Milling Machines
- Dental Software
- Sensors & IoT Devices
- Accessories & Services
- Imaging Systems
- Consumables
- Instrument
- By Specialty
- Restorative Dentistry
- Prosthodontics
- Orthodontics
- Implantology
- Endodontics
- Periodontics
- By End User
- Dental Clinics
- Dental Service Organizations (DSOs)
- Dental Laboratories
- Hospitals
- Academic & Research Institutes
- Geography
- North America
- United States
- Canada
- Mexico
- Europe
- Germany
- United Kingdom
- France
- Italy
- Spain
- Rest of Europe
- Asia-Pacific
- China
- India
- Japan
- Australia
- South Korea
- Rest of Asia-Pacific
- Middle East and Africa
- GCC
- South Africa
- Rest of Middle East and Africa
- South America
- Brazil
- Argentina
- Rest of South America
- North America
Data Sources, Market Sizing, and Validation
Desk Research
We started by mapping the value chain for digital dentistry so the revenue boundary stays consistent across equipment, software, and workflow-linked consumables. Public sources were used to ground the model inputs, including the US FDA product databases for dental devices, the US Census Bureau and UN Comtrade for trade and shipment patterns, and OECD health statistics to contextualize dental care activity.
To keep adoption and spending assumptions realistic, we also reviewed resources such as World Health Organization oral health materials, peer-reviewed dentistry journals, and public releases from dental associations. We then moved to company annual reports, investor presentations, and reputable press coverage. Where available, paid subscriptions for company financials and news were used to cross-check reported dentistry revenue exposure, and patent databases were referenced to see where innovation clusters are forming. The sources listed here are illustrative and not exhaustive, and many other public and paid references were also consulted for data collection, validation, and clarification.
Primary Interviews and Surveys
Primary work focused on validating what clinics and laboratories are actually buying and using, and how purchase timing shifts with replacement cycles and financing. We interviewed a mix of dental clinic operators, laboratory owners, distributors, and product specialists across major regions, so assumptions on adoption, average selling prices, and attach rates could be confirmed and adjusted when gaps were found.
Distribution of primary research fieldwork respondents
| Company type | Respondent position | Region |
|---|---|---|
| Top tier: 26% | CXOs: 16% | APAC: 46% |
| Mid tier: 56% | Functional/Unit leaders: 35% | EMEA: 30% |
| Smaller Players: 18% | Managers: 49% | Americas: 24% |
Market-Sizing & Forecasting
Our sizing model starts with a top-down build that reconstructs demand from dental procedure volumes and digital workflow penetration, then translates that demand into equipment and software spending using typical replacement cycles and utilization patterns. To keep totals practical, the output is corroborated with selective bottom-up checks, such as sampled ASP times unit volumes for intraoral scanners and chairside systems, distributor channel feedback, and supplier revenue splits where they are clearly disclosed.
Market inputs were shaped by installed base refresh for imaging and scanning systems, the shift from analog impressions toward intraoral scans, chairside versus lab share by procedure mix, and software licensing approaches (perpetual versus subscription) that affect when revenue is recognized. We also tracked consumable pull-through linked to CAD/CAM and 3D printing workflows, since it can move differently from equipment sales in slower capex years. For forecasting, we used scenario analysis and then anchored it to expert views on adoption speed, price erosion by generation, and regional investment cycles, so the forward path stays explainable and not overly sensitive to a single assumption.
Data Validation & Update Cycle
Results are checked through multiple passes so the final numbers align with real-world signals and do not drift due to one-off inputs. We compare outputs against independent indicators such as trade flows for relevant device categories, disclosed revenue direction from major suppliers, and changes in dental visit and procedure activity, and then we investigate any large variances before sign-off.
If a metric moves unexpectedly, we re-contact select respondents to confirm whether the change reflects a true market shift or a reporting artifact, and we update the model accordingly. Reports refresh annually, and interim updates are made when material events materially alter demand, pricing, or supply availability. Before delivery, an analyst completes a final review so clients receive the latest updated view.
Mordor Intelligence's Digital Dentistry Market Size Measured Against Other Published Estimates
It is normal to see different published market sizes for digital dentistry because the category boundary is not uniform, and the same revenue line can be counted at different points in the workflow. Differences also come from how software is treated (license versus subscription), whether workflow-linked consumables are bundled into the total, and how currency conversion timing is handled.
By tracking workflow-level adoption indicators and refreshing currency timing assumptions, Mordor Intelligence keeps the total tied to first commercial sales of digital clinical imaging, design, and manufacturing tools, instead of bundling broad dental equipment categories.
Benchmark comparison
| Source | Market Size | Gaps in Research Methodology |
|---|---|---|
| Mordor Intelligence | USD 9.61 B (2025) | |
| Industry Research Publisher A | USD 8.05 B (2025) | This estimate appears to use a narrower bill of materials, with more limited inclusion of software subscriptions and workflow-linked consumables. That reduces the total even when similar device categories are discussed. |
| Press Release Publisher B | USD 6.96 B (2023) | The base year is earlier, and the scope signals indicate selective counting of equipment and core software. Adjacent digital workflows and recurring revenues may be treated inconsistently, which can compress the starting value. |
Across the three values, the spread is mainly explained by what gets counted as digital dentistry revenue and which year is used as the anchor. When scope is held to clinically connected digital workflows and revenue is timed to first sales and active licenses, the market total becomes easier to reproduce and to update as adoption and pricing move year to year.


Key Questions Answered in the Report
How large will the digital dentistry market be by 2031?
It is forecast to reach USD 16.67 billion by 2031, rising at a 9.62% CAGR from 2026-2031.
Which product group drives most revenue?
Instruments, led by intraoral scanners and CAD/CAM mills, contributed 75.54% of 2025 revenue and are growing at 10.25% through 2031.
Which specialty shows the fastest growth?
Implantology, supported by guided-surgery software and 3D-printed surgical guides, is projected to expand at an 11.65% CAGR between 2026-2031.
Why are dental laboratories investing aggressively?
Labs digitize milling and printing to deliver complex restorations quickly, helping them compete with chairside systems and grow at 10.82% through 2031.
Which region will add the most incremental revenue?
Asia-Pacific, expanding at a 10.1% CAGR, driven by China's digital-health mandates and India's rising demand for cosmetic procedures.
What restrains adoption among solo practitioners?
High upfront equipment costs and limited reimbursement make ROI challenging unless patient volume is high or subscription models are available.
Page last updated on:


 Your data is secure and never sold or shared.


