Database Activity Monitoring (DAM) Market Size and Share
Market Overview
| Study Period | 2024 - 2031 |
|---|---|
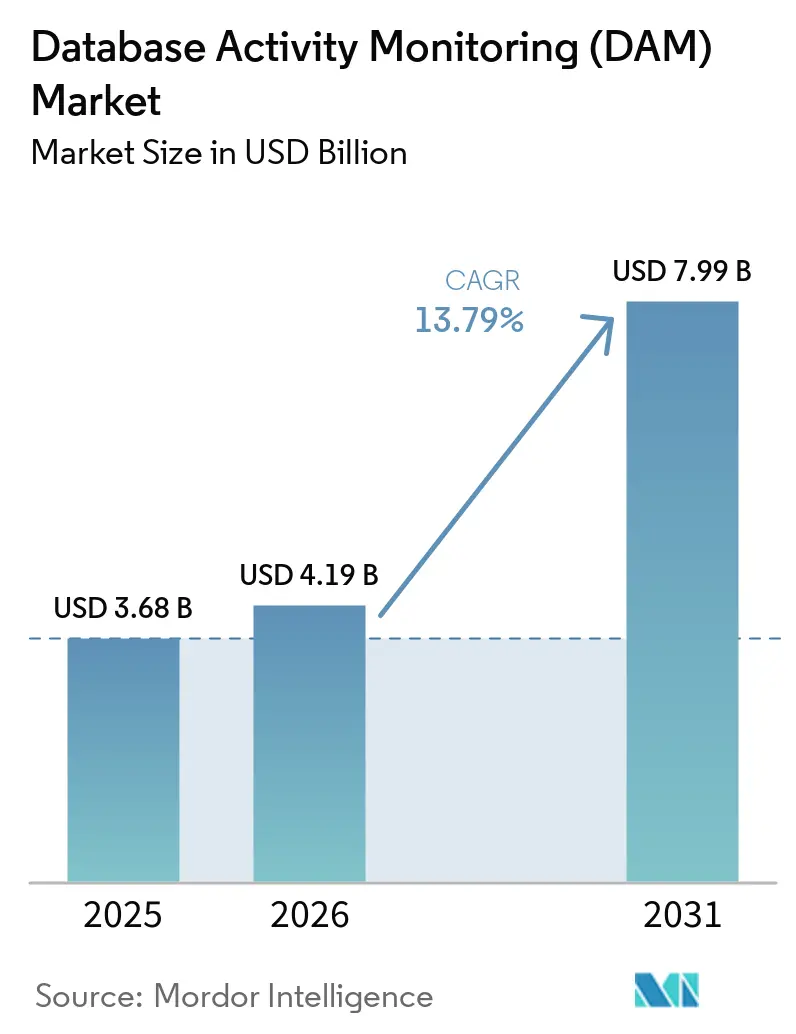
| Market Size (2026) | USD 4.19 Billion |
| Market Size (2031) | USD 7.99 Billion |
| Growth Rate (2026 - 2031) | 13.79% CAGR |
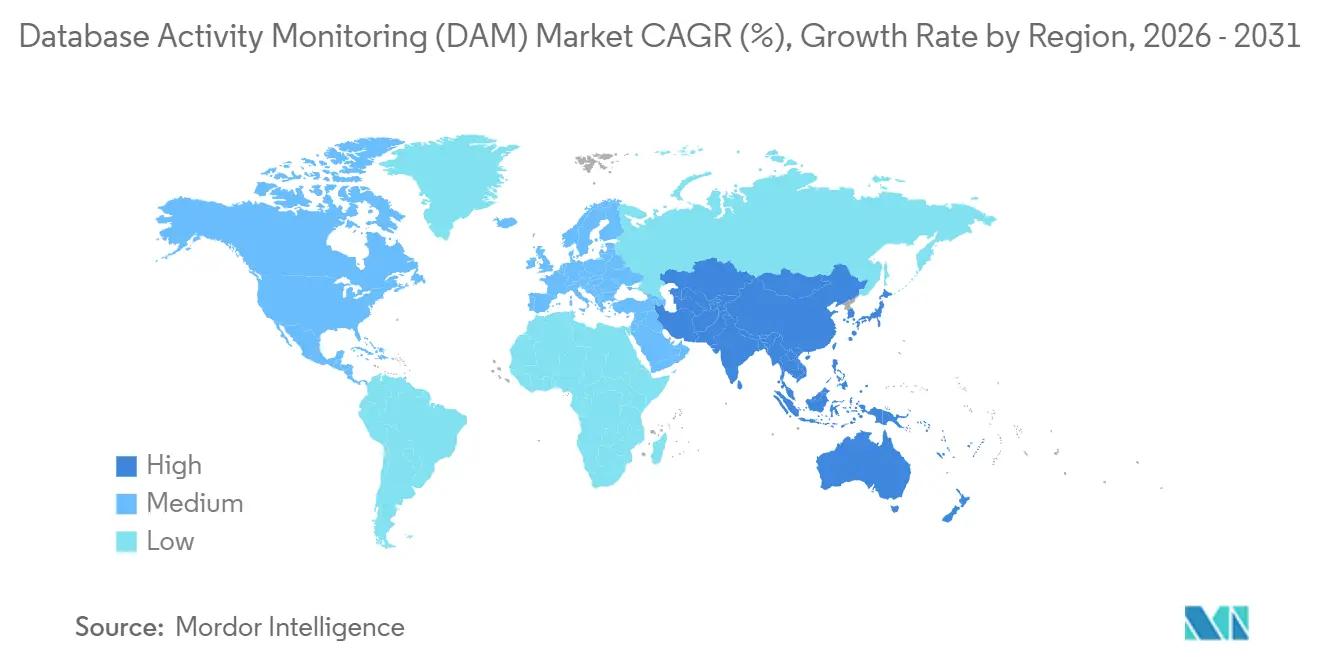
| Fastest Growing Market | Asia Pacific |
| Largest Market | North America |
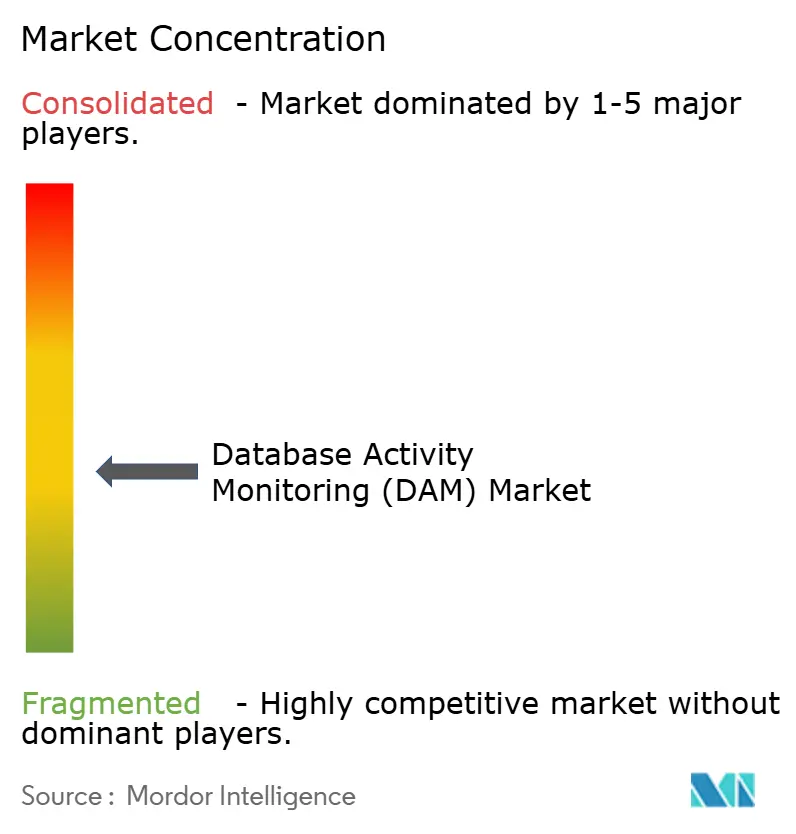
| Market Concentration | Medium |
Major Players *Disclaimer: Major Players sorted in no particular order Image © Mordor Intelligence. Reuse requires attribution under CC BY 4.0. | |
Database Activity Monitoring (DAM) Market Analysis by Mordor Intelligence
The Database Activity Monitoring (DAM) market size was USD 3.68 billion in 2025, USD 4.19 billion in 2026, and is anticipated to reach USD 7.99 billion by 2031, growing at a CAGR of 13.79% from 2026 to 2031. Intensifying data-sovereignty fines, multi-cloud sprawl, and zero-trust mandates are shifting budgets from periodic compliance scans to real-time query auditing. HIPAA Security Rule updates that take effect between 2025 and 2026 require covered entities to encrypt protected health information and enforce multi-factor authentication, accelerating adoption in U.S. healthcare and insurance. A shortage of 4.8 million cybersecurity professionals is pushing enterprises toward managed detection and response subscriptions that bundle database telemetry with automated playbooks. Meanwhile, agentless collection launched by hyperscalers is cutting the 5-15% CPU tax that historically constrained inline inspection.
Key Report Takeaways
- By component, Software accounted for 52.0% of revenue share of the database activity monitoring (DAM) marketin 2025, while Managed Services are forecast to expand at a 14.8% CAGR through 2031 as buyers compensate for cybersecurity talent gaps.
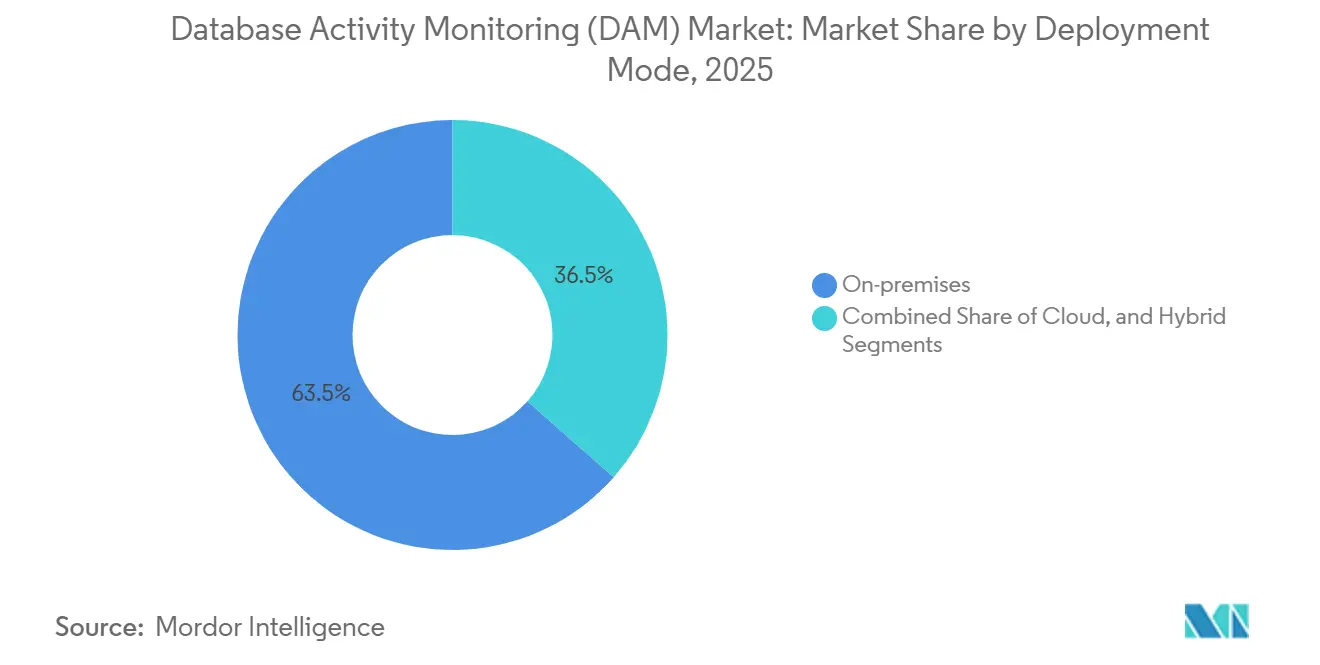
- By deployment mode, On-premises installations held 63.5% share of the Database Activity Monitoring market size in 2025, but Cloud-based offerings are projected to grow at a 17.5% CAGR to 2031 on the strength of native audit trails.
- By organization size, Large Enterprises generated 58.54% of 2025 revenue, whereas Small and Medium Enterprises are advancing at a 15.2% CAGR as software-as-a-service models remove upfront capital outlays.
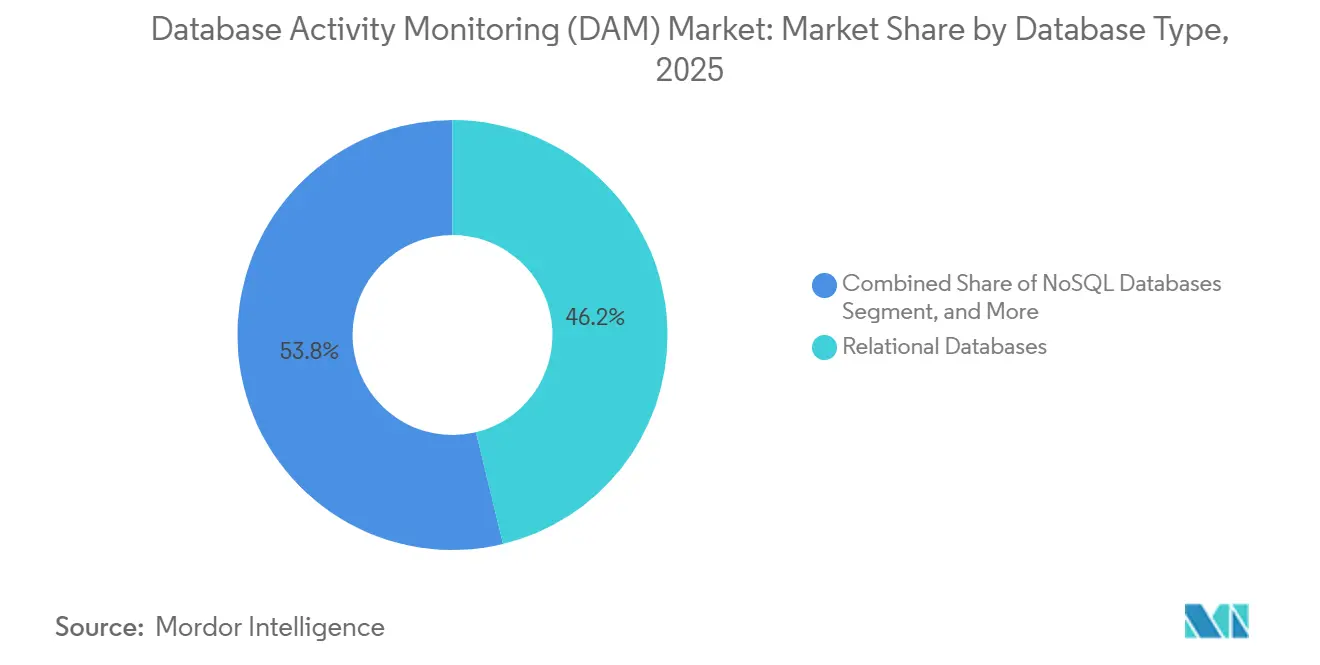
- By database type, Relational engines represented 46.23% of monitored workloads in 2025, yet Cloud-native platforms are climbing at a 16.5% CAGR because audit, role, and encryption controls ship fully embedded.
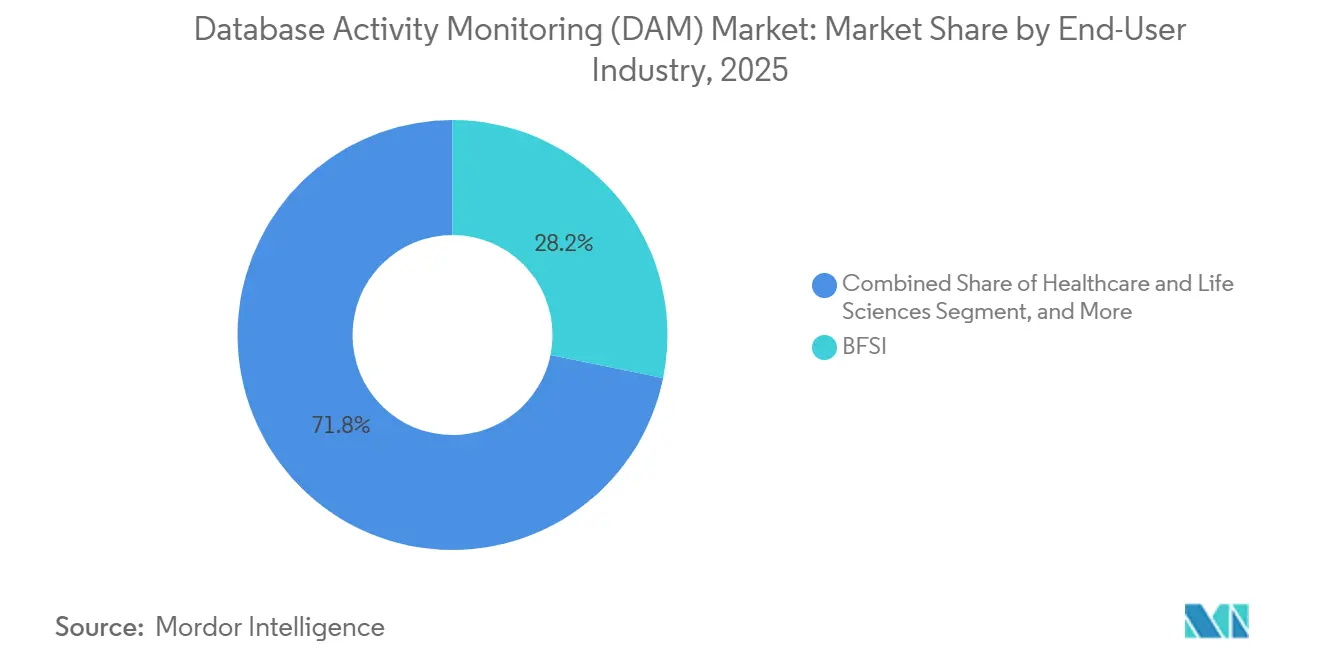
- By end-user industry, Banking, Financial Services and Insurance contributed 28.2% of 2025 revenue, while Retail and e-commerce is set to rise at a 15.90% CAGR to 2031 under Payment Card Industry Data Security Standard v4.0.1 obligations.
- By geography, North America retained 38.4% market share in 2025 on the back of Executive Order 14144, and Asia-Pacific is the fastest-growing region at a 14.40% CAGR through 2031, fueled by China and Singapore privacy enforcement.
Note: Market size and forecast figures in this report are generated using Mordor Intelligence’s proprietary estimation framework, updated with the latest available data and insights as of January 2026.
Global Database Activity Monitoring (DAM) Market Trends and Insights
Drivers Impact Analysis*
| Driver | (~) % Impact on CAGR Forecast | Geographic Relevance | Impact Timeline |
|---|---|---|---|
| Escalating Data-Sovereignty Fines | +3.2% | European Union and United Kingdom | Short term (≤ 2 years) |
| Multi-Cloud Workload Migration | +2.8% | North America and Asia-Pacific | Medium term (2-4 years) |
| AI-Driven Insider-Threat Detection | +2.4% | Global financial hubs | Medium term (2-4 years) |
| Zero-Trust Mandates in Public Sector | +2.1% | United States and European Union | Short term (≤ 2 years) |
| SIEM-SOAR Integrations | +1.6% | Enterprises with security operations centers | Medium term (2-4 years) |
| Agentless Telemetry Adoption | +1.5% | Cloud-first organizations | Short term (≤ 2 years) |
| Source: Mordor Intelligence | |||
Escalating Data-Sovereignty Fines Reshape Compliance Budgets
In the Database Activity Monitoring (DAM) market, global regulators imposed EUR 1.2 billion (USD 1.35 billion) in GDPR penalties during 2024, led by EUR 310 million (USD 350.3 million) against LinkedIn and EUR 251 million (USD 283.63 million) against Meta EDPB.[1]European Data Protection Board, “GDPR Enforcement Tracker,” EDPB.EUROPA.EU Enterprises are directing fresh capital to continuous query-level audit trails that record every cross-border transfer in real time. U.S. healthcare providers face parallel pressure as HIPAA enforcement adds mandatory multi-factor authentication by 2026, prompting hospitals to treat monitoring as a core security control. This regulatory tempo explains why the Database Activity Monitoring market is pivoting from quarterly compliance checks to always-on anomaly-detection infrastructure. Real-time visibility is now a board-level budget line rather than a discretionary item.
Multi-Cloud Workload Migration Fragments Visibility
Synergy Research Group found that AWS held 31%, Azure 25%, and Google Cloud 11% of infrastructure share in Q4 2024, while 87% of enterprises ran workloads across more than one hyperscaler. Each cloud keeps proprietary log schemas that force security teams to normalize data before analysis. The mid-2024 Snowflake breach, which exposed 73 million AT&T and 560 million Ticketmaster records, showed how inconsistent session monitoring across regions can snowball into systemic compromise. Consolidated dashboards that merge on-premises Oracle logs with Snowflake events are therefore moving from wish-list to purchase order.
AI-Driven Insider-Threat Detection Moves Beyond Rule-Based Alerts
In the DAM market, SWIFT went live in January 2025 with an AI-based fraud-detection service that scans payment traffic in real time.[2]SWIFT, “AI-Powered Fraud Detection Service Launch,” SWIFT.COM Machine learning models learn individual access baselines and surface odd login times or unusual export volumes, reducing false positives that once overloaded analysts. IBM Guardium added natural-language search in 2025, allowing investigators to ask conversational questions without writing SQL. Privacy-preserving federated learning was rolled out across 13 banks in September 2025, enabling shared model training without exposing customer data. Together, these upgrades lift detection accuracy and keep insider abuse from slipping through static thresholds.
SIEM-SOAR Integrations Transform Monitoring into Automated Response
In 2024, IBM QRadar integration with Palo Alto Cortex XSOAR automatically revoked credentials when privilege escalation occurred.[3] IBM Security, “Guardium AI Integration 2025,” IBM.COM Splunk connectors for Oracle Audit and Microsoft SQL Server, released in 2025, cut correlation time from hours to minutes. FinCEN reported USD 2.1 billion in ransomware payments between 2022 and 2024, and many attacks began with the compromise of undetected database credentials. Automated playbooks that snapshot logs and isolate instances on the first anomaly are therefore reshaping operational doctrine.
Restraints Impact Analysis*
| Restraint | (~) % Impact on CAGR Forecast | Geographic Relevance | Impact Timeline |
|---|---|---|---|
| Performance overhead in real-time workloads | -1.4% | Global, particularly high-frequency trading | Short term (≤ 2 years) |
| Shortage of DAM security specialists | -2.1% | Global, acute in North America and Europe | Long term (≥ 4 years) |
| Heterogeneous database environments | -1.2% | Enterprise multi-cloud deployments | Medium term (2-4 years) |
| False-positive fatigue | -0.8% | All deployment scenarios | Short term (≤ 2 years) |
| Source: Mordor Intelligence | |||
Performance Overhead in Real-Time Workloads Constrains Deployment
Inline agents impose 5-15% CPU drag that trading systems and Black Friday retail traffic cannot tolerate, and a 100-millisecond delay can shave 7% off cart conversions. Merchants thus sample 10-20% of queries, but gaps let sophisticated attacks hide. PCI DSS v4.0.1 insists on continuous audit coverage, intensifying the struggle. Agentless cloud APIs solve part of the issue, but legacy on-premises estates still face the overhead dilemma.
Shortage of DAM Security Specialists Limits Effective Implementation
ISC2 quantified a 4.8 million-person cybersecurity shortfall in 2024, with database expertise among the scarcest niches. Under-tuned rules overwhelm analysts with alerts, leading some teams to mute monitors entirely. The Snowflake credential attack revealed that many victims owned tools yet never enabled the relevant policies. Managed detection services fill the gap but raise sovereignty concerns in healthcare and finance, where outsourcing is restricted in the Database Activity Monitoring (DAM) market.
*Our forecasts treat driver/restraint impacts as directional, not additive. The impact forecasts reflect baseline growth, mix effects, and variable interactions.
Segment Analysis
By Deployment Mode: Cloud Transformation Accelerates
Cloud-based monitoring is projected to post a 17.5% CAGR to 2031 as Amazon Web Services, Azure, and Google Cloud embed native audit log streams. On-premises still controls 63.5% revenue because mission-critical Oracle and IBM Db2 applications remain in corporate data centers in the DAM market. Hybrid rollouts let organizations standardize logging across both environments, meeting data-residency mandates that prohibit the external storage of regulated information.
European Union transfer restrictions and United States federal zero-trust directives encourage localized logging, but cost relief and reduced CPU overhead make cloud-delivered monitoring attractive once compliance officers approve. Enterprises in long migration cycles are standardizing on single dashboards that ingest Snowflake, MongoDB Atlas, and on-premises SQL telemetry side by side.


By Component: Managed Services Gain Momentum
Managed Services revenue is rising faster than overall demand in the database activity monitoring market, advancing at a 14.8% CAGR through 2031, as buyers outsource detective controls to 24-hour monitoring partners. Software still owns the majority share thanks to perpetual licensing, preferred by financial institutions that keep tooling on-premises. Agent-based suites dominate deep session inspection for Oracle and IBM Db2, while agentless deployments introduced by Microsoft Database Watcher and Datadog attract latency-sensitive workloads.
Second-generation managed detection and response providers integrate rule tuning, threat intelligence, and automated containment. This appeal is strongest in Asia-Pacific, where certified database talent is scarce, and boards seek quicker deployment over long-term capability building. Professional Services revenue also climbs as integrators stitch database logs into centralized security information and event management pipelines.
By Database Type: Cloud-Native Platforms Redefine Priorities
Relational engines held a 46.23% share in 2025, as core banking and claims processing still run on SQL, but Cloud-native systems are growing at a 16.5% CAGR because Snowflake, MongoDB Atlas, and similar services ship with encryption and role-based controls enabled. NoSQL stores gain in digital advertising where scale trumps ACID guarantees.
The Database Activity Monitoring (DAM) market for cloud-native workloads is set to accelerate as vendors make monitoring a default rather than a bolt-on. After the 2024 credential attack, Snowflake hardened MFA settings and auto-enabled session audits, turning security posture into a competitive differentiator. Relational providers respond by adding agentless APIs to retain relevance among cloud migrants.
By Organization Size: SME Adoption Broadens Reach
Large Enterprises delivered 58.54% of 2025 revenue, but SMEs grow faster at 15.2% CAGR, in the DAM market, leveraging subscription pricing that removes hardware outlay. Varonis’ 2025 cloud shift exemplifies packaging that folds database, file, and SaaS telemetry into a per-user model.
SMEs accept vendor default rules rather than custom tuning to cut deployment from months to days. Large Enterprises pour resources into AI analytics and federated log lakes that refine detections by business unit. The Database Activity Monitoring (DAM) market share held by SMEs therefore expands, yet absolute dollars still favor multinationals whose compliance scope is broader.
By End-User Industry: Retail Leads Growth Curve
BFSI accounted for 28.2% of the market in 2025, driven by USD 485 billion in fraud exposure and SWIFT AI rollouts. Retail e-commerce is the fastest-growing segment, with a 14.90% CAGR, because PCI DSS v4.0.1 mandates continuous logging for cardholder environments, raising the Database Activity Monitoring industry baseline across even small merchant sites.
Healthcare breaches involving more than 44 million patients in 2025 spur hospitals to layer audit trails alongside ransomware detection. Government uptake sharpens under zero-trust decrees, while telecom operators tie monitoring to 5G billing platforms that are frequent targets of espionage. The manufacturing and energy segments follow critical infrastructure guidance that mandates real-time auditing to safeguard uptime.
Geography Analysis
North America accounted for the largest share of the Database Activity Monitoring (DAM) market in 2025, with 38.4% revenue, as Executive Order 14144 and HIPAA rules converged, driving zero-trust rollouts across federal, healthcare, and insurance verticals. The Snowflake breach raised public awareness, leading to a 22% increase in agentless deployments in Q3 2024. Canada’s cyber center issued similar directives, while Mexican banks tighten logging to meet data-residency clauses.
Asia-Pacific registers the fastest CAGR at 14.40% through 2031 as China’s Personal Information Protection Law, Singapore’s revised PDPA, and India’s Digital Personal Data Protection Act all require localized audit infrastructure. Japanese and Korean semiconductor plants protect intellectual property with continuous monitoring, and Australia raises penalties to AUD 50 million (USD 33 million) for firms lacking reasonable safeguards.
Europe remains pivotal because GDPR fines totaled EUR 1.2 billion (USD 1.4 billion) in 2024, far exceeding prior years. Germany’s 12-month log mandate sets a standard that cascades into private procurement. South America progresses as Brazil’s LGPD issues its first enforcement cases, while the Middle East and Africa growth rides the UAE and Saudi data-localization statutes that push on-premises or in-country cloud logs.

Competitive Landscape
In the Database Activity Monitoring (DAM) market, competitive intensity is stiff, but no single vendor dominates. Google closed its USD 32 billion purchase of Wiz in March 2026, weaving cloud-native application and database monitoring into one platform that appeals to 87% of enterprises running multi-cloud. Trustwave and Cybereason merged in February 2025, creating a USD 400 million managed detection and response entity that sells 24/7 telemetry oversight to mid-market buyers. Microsoft’s December 2024 release of Database Watcher shows hyperscaler intent to own native monitoring and cut out third-party agents.
Smaller disruptors differentiate through AI and privacy-preserving analytics. IBM Guardium’s 2025 natural-language engine enables analysts to query anomalies without SQL. Datadog’s agentless expansion in 2025 captures Amazon RDS and Google Cloud SQL logs for DevSecOps teams. Vendors that normalize telemetry across Oracle, SQL Server, Snowflake, and MongoDB win deals where hybrid visibility matters.
Database Activity Monitoring (DAM) Industry Leaders
International Business Machines Corporation
Oracle Corporation
McAfee LLC
Forcepoint LLC
Imperva Inc. (Thales S.A.)
- *Disclaimer: Major Players sorted in no particular order

Recent Industry Developments
- April 2026: Citizens Bank and Frost Bank disclosed a vendor breach that spurred accelerated continuous monitoring for third-party access in core banking apps.
- March 2026: Google finalized the USD 32 billion Wiz acquisition, integrating multi-cloud protection with database telemetry.
- February 2026: PrestaShop merchants suffered skimmer attacks that lifted payment data, nudging SMEs toward real-time query inspection.
- February 2025: Trustwave and Cybereason finalized their merger, creating a larger managed detection and response provider.


Global Database Activity Monitoring (DAM) Market Report Scope
The Database Activity Monitoring (DAM) market comprises technologies, platforms, and services that continuously observe, record, and analyze all activities on enterprise database systems in real time to identify policy violations, unauthorized access, data breaches, privilege abuse, and insider threats.
The Database Activity Monitoring (DAM) Market Report is Segmented by Component (Software with Agent-based and Agentless Monitoring, and Services with Professional and Managed Services), Deployment Mode (On-premises, Cloud-based, and Hybrid), Organization Size (Small and Medium Enterprises, and Large Enterprises), Database Type (Relational, NoSQL, Big Data/Hadoop, and Cloud-native), End-User Industry (BFSI, Healthcare, Retail, Government, IT and Telecom, Industrial, Energy, and Other End-User Industry), and Geography (North America, South America, Europe, Asia-Pacific, and Middle East and Africa). The Market Forecasts are Provided in Terms of Value (USD).
| Software | Agent-based Monitoring |
| Agentless Monitoring | |
| Services | Professional Services |
| Managed Services |
| On-premises |
| Cloud-based |
| Hybrid |
| Small and Medium Enterprises |
| Large Enterprises |
| Relational Databases |
| NoSQL Databases |
| Big Data / Hadoop |
| Cloud-native Databases |
| Banking, Financial Services and Insurance |
| Healthcare and Life Sciences |
| Retail and E-commerce |
| Government and Defense |
| IT and Telecommunications |
| Industrial and Manufacturing |
| Energy and Utilities |
| Other End-User Industries |
| North America | United States |
| Canada | |
| Mexico | |
| South America | Brazil |
| Argentina | |
| Rest of South America | |
| Europe | United Kingdom |
| Germany | |
| France | |
| Italy | |
| Rest of Europe | |
| Asia-Pacific | China |
| Japan | |
| India | |
| South Korea | |
| Rest of Asia-Pacific | |
| Middle East and Africa |
| By Component | Software | Agent-based Monitoring |
| Agentless Monitoring | ||
| Services | Professional Services | |
| Managed Services | ||
| By Deployment Mode | On-premises | |
| Cloud-based | ||
| Hybrid | ||
| By Organization Size | Small and Medium Enterprises | |
| Large Enterprises | ||
| By Database Type | Relational Databases | |
| NoSQL Databases | ||
| Big Data / Hadoop | ||
| Cloud-native Databases | ||
| By End-User Industry | Banking, Financial Services and Insurance | |
| Healthcare and Life Sciences | ||
| Retail and E-commerce | ||
| Government and Defense | ||
| IT and Telecommunications | ||
| Industrial and Manufacturing | ||
| Energy and Utilities | ||
| Other End-User Industries | ||
| By Geography | North America | United States |
| Canada | ||
| Mexico | ||
| South America | Brazil | |
| Argentina | ||
| Rest of South America | ||
| Europe | United Kingdom | |
| Germany | ||
| France | ||
| Italy | ||
| Rest of Europe | ||
| Asia-Pacific | China | |
| Japan | ||
| India | ||
| South Korea | ||
| Rest of Asia-Pacific | ||
| Middle East and Africa | ||


Key Questions Answered in the Report
How large will the Database Activity Monitoring market (DAM) be by 2031?
The Database Activity Monitoring market size is projected to reach USD 7.99 billion by 2031, expanding at a 13.78% CAGR from 2026 to 2031.
Which component segment is growing fastest?
Managed Services are forecast to grow at 14.8% CAGR through 2031 as firms outsource monitoring amid a 4.8 million-person cybersecurity talent gap.
How quickly are cloud-based deployments gaining share?
Cloud-based monitoring is advancing at a 17.5% CAGR because hyperscalers now provide native agentless audit trails.
Why is Asia-Pacific the fastest-growing region?
Strict privacy laws and data-localization mandates in China, Singapore, and India drive a 12.4% CAGR for Asia-Pacific through 2031.
What makes BFSI the leading end-user industry?
Escalating fraud losses and AI-augmented payment monitoring keep Banking, Financial Services and Insurance at 28.2% of 2025 revenue.
How does PCI DSS v4.0.1 influence retailer adoption?
The latest standard requires continuous audit coverage for cardholder data, pushing retail and e-commerce platforms toward real-time monitoring at a 13.0% CAGR, according to Mordor Intelligence.
Page last updated on:


