Database Market Size and Share
Market Overview
| Study Period | 2021 - 2031 |
|---|---|
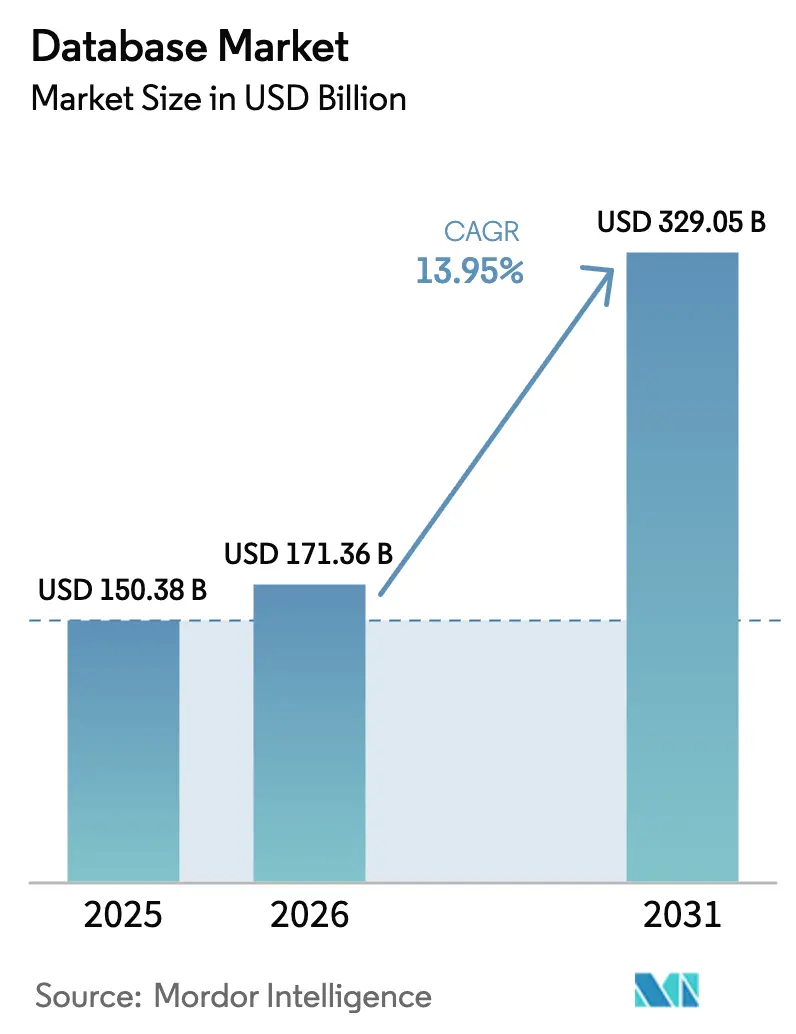
| Market Size (2026) | USD 171.36 Billion |
| Market Size (2031) | USD 329.05 Billion |
| Growth Rate (2026 - 2031) | 13.95% CAGR |
| Fastest Growing Market | North America |
| Largest Market | Asia Pacific |
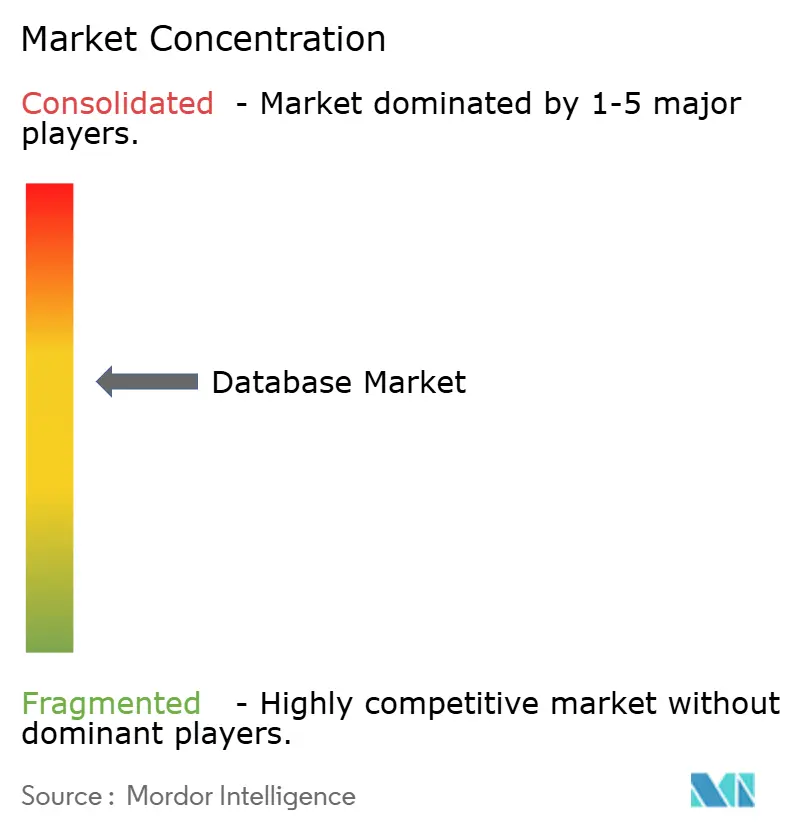
| Market Concentration | Medium |
Major Players*Disclaimer: Major Players sorted in no particular order Image © Mordor Intelligence. Reuse requires attribution under CC BY 4.0. | |
Database Market Analysis by Mordor Intelligence
The database market size was valued at USD 150.38 billion in 2025 and estimated to grow from USD 171.36 billion in 2026 to reach USD 329.05 billion by 2031, at a CAGR of 13.95% during the forecast period (2026-2031). This trajectory is underpinned by rapid enterprise adoption of generative-AI workloads, the widening scope of data-sovereignty rules, and an explosion of IoT-generated data streams. Relational platforms remain dominant, yet NoSQL engines post the strongest growth as firms modernize for semi-structured data use cases. Database-as-a-Service (DBaaS) accounts for 65% of 2024 spend and is expanding, reflecting a clear preference for opex-driven consumption models. Regionally, North America captures the majority of revenue, while Asia records the highest growth as 5G and edge investments accelerate.
Key Report Takeaways
- By deployment model, cloud captured 56.40% of 2025 revenue; on the growth axis, cloud is forecast to expand at an 18.3% CAGR to 2031.
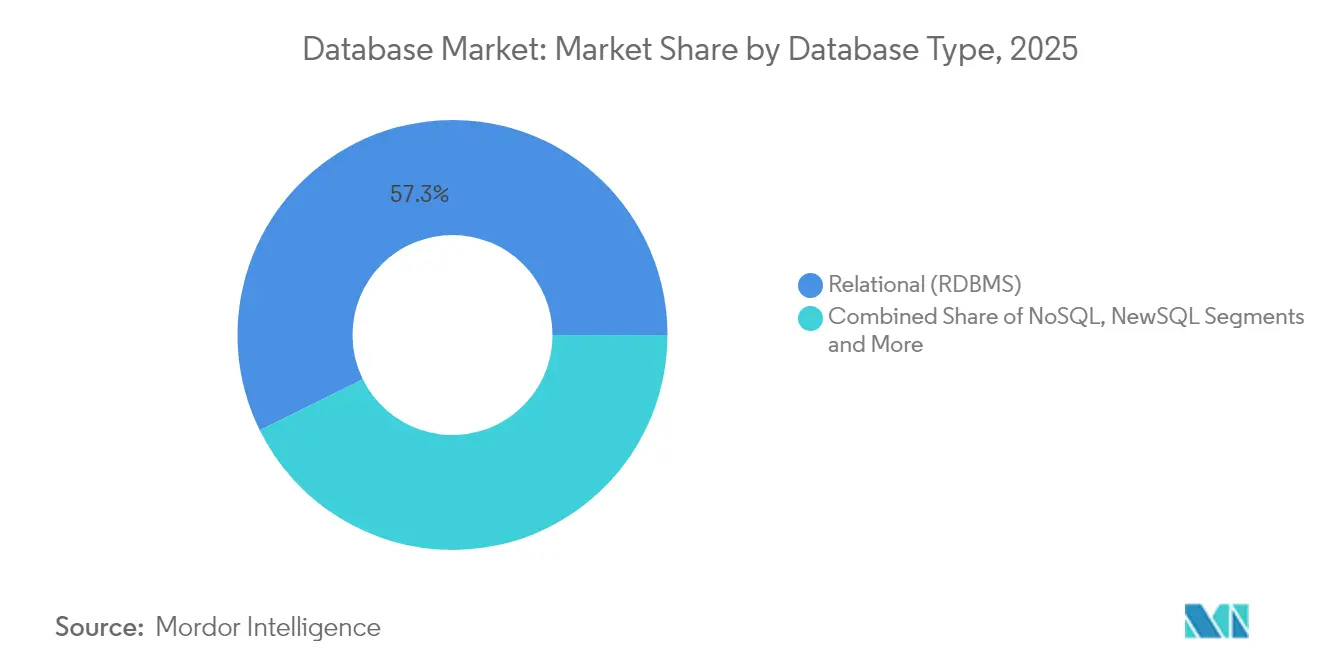
- By database type, relational systems led with 57.30% of the database market share in 2025, whereas NoSQL platforms are projected to post a 17.8% CAGR through 2031.
- By service model, DBaaS accounted for 64.20% of spend in 2025 and is pacing the field with a 16.3% CAGR.
- By enterprise size, large enterprises held 67.10% of revenue in 2025, while the SME segment is expected to register a 16.7% CAGR through 2031.
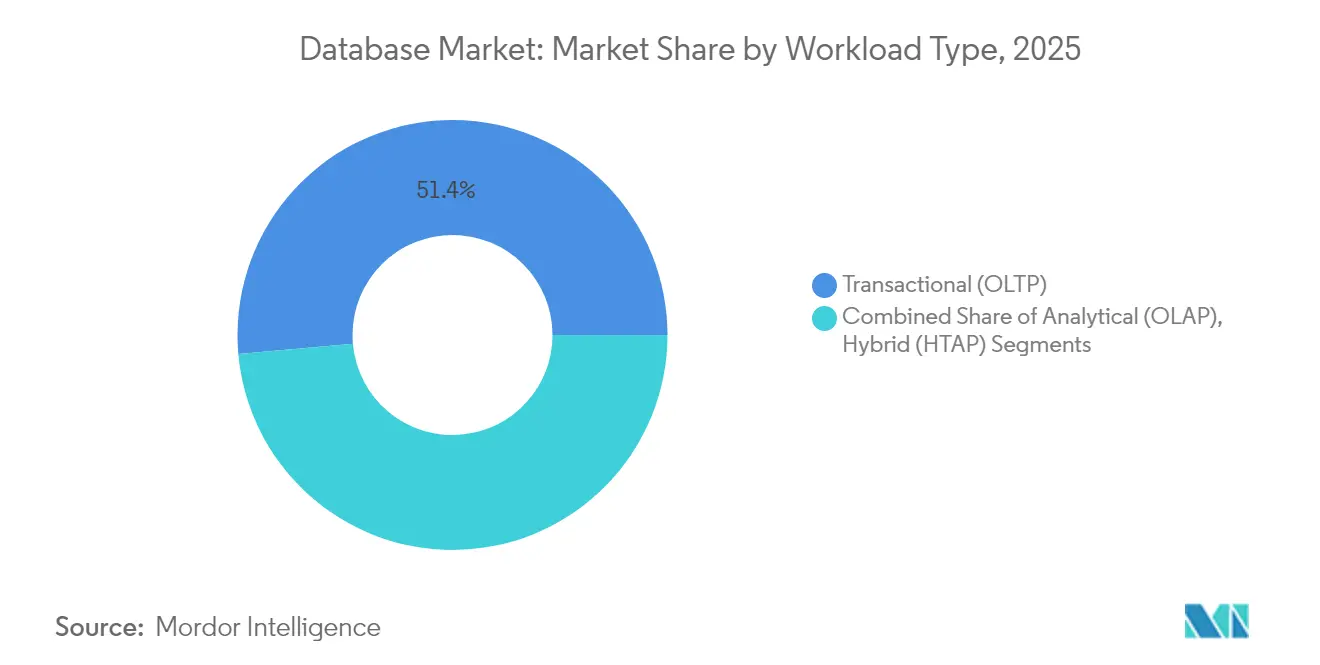
- By workload type, transactional workloads hold a 51.40% slice of 2025, hybrid transactional/analytical processing (HTAP) workloads, however, are rising at 16.2% CAGR by through 2031.
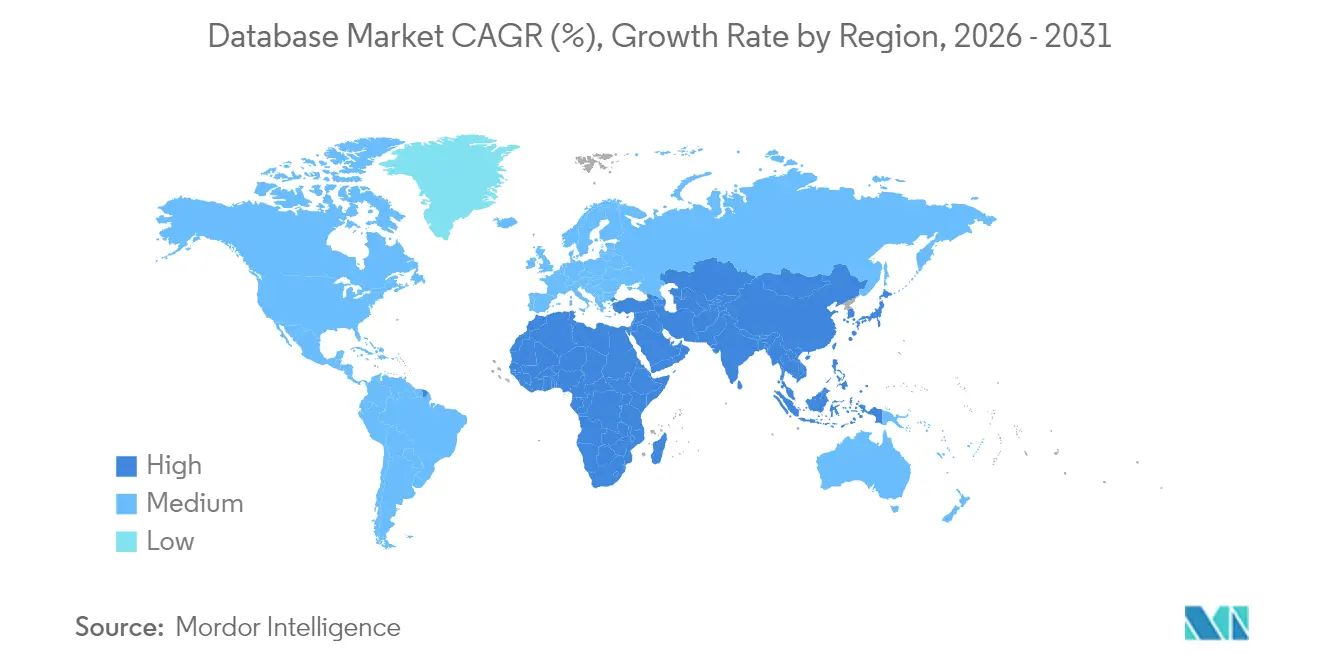
- By geography, North America contributed 40.50% of 2025 revenue, while Asia is projected to expand at a 17.6% CAGR.
- By end-user vertical, BFSI captured 20.60% share in 2025, whereas healthcare & life sciences is forecast to grow at a 14.8% CAGR.
Note: Market size and forecast figures in this report are generated using Mordor Intelligence’s proprietary estimation framework, updated with the latest available data and insights as of 2026.
Global Database Market Trends and Insights
Drivers Impact Analysis*
| Driver | (~) % Impact on CAGR Forecast | Geographic Relevance | Impact Timeline |
|---|---|---|---|
| GenAI Workloads Accelerating Vector-Database Adoption Worldwide | +3.5% | Global, with concentration in North America & Europe | Medium term (2-4 years) |
| Distributed Edge-Native Databases for 5G & Massive-IoT Roll-outs in Asia | +2.8% | Asia, with spillover to North America | Long term (≥ 4 years) |
| Data-Sovereignty Mandates Propelling Regional Cloud DB Growth in MEA | +2.3% | Middle East & Africa, with global implications | Medium term (2-4 years) |
| EU ESG-Reporting Rules Driving Time-Series DB Demand | +1.9% | Europe, with global enterprise impact | Short term (≤ 2 years) |
| Real-time Risk Analytics Fuelling In-Memory Columnar DB Uptake in N. America | +1.8% | North America, with expansion to Europe & Asia | Medium term (2-4 years) |
| Kubernetes-Native Serverless DBaaS Adoption Across Global Enterprises | +1.5% | Global, with early adoption in North America & Europe | Short term (≤ 2 years) |
| Source: Mordor Intelligence | |||
GenAI workloads accelerating vector-database adoption
Surging generative-AI initiatives push enterprises to embrace vector databases that manage high-dimensional embeddings for semantic search, recommendation engines, and retrieval-augmented generation. More than 80% of organizations now have a GenAI strategy, and over half of all database applications run in containers to support these workloads. [1]Nutanix, “More Organizations Adopting GenAI,” mescomputing.com Microsoft’s SQL Server 2025 adds a native vector data type, signalling mainstream adoption of AI-tuned data infrastructure. Demand is strongest in financial services, e-commerce, and natural-language processing domains, where similarity queries power real-time personalization. [2]IEEE Computer Society, “Role of Databases in GenAI Applications,” computer.org
Distributed edge-native databases for 5G & massive-IoT roll-outs
The shift of data processing toward the network edge reduces latency, bandwidth pressure, and cloud-egress costs. By 2025, 75% of enterprise-generated data will be created and acted upon outside traditional data centers. Asian mobile network operators are virtualizing network functions to enable multi-access edge computing, creating fertile ground for edge-native databases that maintain state even when connectivity is intermittent. Use cases include autonomous vehicles, smart factories, and immersive AR services that require millisecond-level responses.
EU ESG-reporting rules driving time-series DB demand
The Corporate Sustainability Reporting Directive adds roughly 39,000 European companies to mandatory ESG reporting from January 2025. Firms need time-series databases to capture granular environmental and social metrics over time. Architectures such as Timescale’s hypertable partitioning and hybrid storage enable high-throughput ingestion and real-time analytics, closing gaps between sustainability oversight and regulatory disclosure.
Data-sovereignty mandates propelling regional cloud DB growth
MEA states require local processing and storage, elevating regional cloud availability zones. Data sovereignty comprises authority, bounds, and compliance, dictating where and how data moves. Service providers respond with tokenization and confidential-computing controls that satisfy jurisdictional rules while preserving analytical value. MongoDB extended Atlas to UAE-based AWS infrastructure to address these specifications.
Restraints Impact Analysis*
| Restraint | (~) % Impact on CAGR Forecast | Geographic Relevance | Impact Timeline |
|---|---|---|---|
| Escalating Cloud Egress Fees Hindering Multi-cloud Portability | -1.2% | Global, with higher impact in North America & Europe | Medium term (2-4 years) |
| Multi-tenant DBaaS Performance Overheads for Tier-1 Telcos | -0.9% | Global, with acute impact in Asia & Europe | Short term (≤ 2 years) |
| Vector-DB Talent Shortage Slowing Production Deployments | -0.8% | Global, with acute impact in emerging markets | Short term (≤ 2 years) |
| Trans-Atlantic Privacy-Framework Uncertainty Stalling Migrations | -0.7% | North America & Europe, with spillover effects | Medium term (2-4 years) |
| Source: Mordor Intelligence | |||
Escalating cloud-egress fees hindering multi-cloud portability
Rising data-transfer charges create economic “data gravity,” locking workloads into single clouds despite architectural ideals of portability. Hybrid-multicloud adoption is set to double within three years, yet 46% of enterprises flag database management across environments as a top challenge. High egress costs can undermine ROI for analytics that span providers, forcing trade-offs between best-of-breed services and budget ceilings.
Vector-DB talent shortage slowing production deployments
Vector databases demand skills in similarity search algorithms and ML pipeline integration rarely found in traditional DBA cohorts. Organizations spend extended cycles recruiting or upskilling, delaying AI product launches. Emerging markets face steeper hurdles where advanced database curricula and practitioner communities are still nascent, widening the AI adoption gap.
*Our forecasts treat driver/restraint impacts as directional, not additive. The impact forecasts reflect baseline growth, mix effects, and variable interactions.
Segment Analysis
By Database Type: NoSQL Challenges Relational Dominance
Relational platforms retained 57.30% of the database market in 2025, underlining their maturity for structured transactional workloads. NoSQL engines, however, are expanding at an 17.8% CAGR as social media, sensor logs, and user-generated content grow. Document, key-value, and wide-column stores curb rigid schema constraints, attracting agile development teams. Graph databases, valued for relationship-centric analytics, are advancing rapidly with vendor innovations that embed graph and vector operations in the same engine. Multi-model databases converge document, graph, and key-value paradigms, cutting integration costs and harmonizing query logic. NewSQL architectures merge ACID integrity with distributed scale; academic research projects a 29.7% CAGR for these systems as enterprises seek both consistency and elasticity.
The database market size devoted to relational engines is forecast to keep expanding, yet its share will erode as large-scale content platforms prefer horizontally scalable alternatives. NoSQL’s acceleration is amplified by serverless implementations that auto-partition storage, enabling cost-effective burst handling during viral traffic surges. Industry adoption patterns show retail and gaming workloads migrating first, while financial services cautiously incorporate NoSQL for analytical micro-services that complement regulated transaction cores.


By Deployment Model: Cloud Accelerates Database Transformation
Cloud accounts for 56.40% of 2025 revenue and advances at an 18.3% CAGR, placing it at the fulcrum of the database market. Elastic capacity, consumption billing, and managed security drive uptake as CIOs prioritize capex-light expansion strategies. The emergence of region-specific sovereign clouds reconciles regulatory constraints with hyperscale economics, supporting multinational rollouts without fragmenting architectures.
On-premises deployments retain relevance for data that requires absolute locality or resides within legacy ecosystems. Hybrid blueprints maintain sensitive assets in private clusters while bursting analytics into public clouds, an arrangement increasingly orchestrated through container control planes and service mesh layers. Cloud-native tools now replicate data across zones in seconds, shrinking recovery time objectives and raising expectations for near-continuous availability. The database market size attached to fully managed cloud services is expected to overshadow self-hosted alternatives well before 2030, despite governance-driven islands of on-premises persistence.
By Service Model: DBaaS Dominates Through Operational Efficiency
The DBaaS construct captures 64.20% of 2025 spending, reflecting the preference for outsourced runtime, patching, and elastic scaling. Serverless DBaaS variations allocate resources per request, trimming idle overhead and simplifying capacity planning. Multi-cloud DBaaS offerings mitigate vendor lock-in fears by synchronizing catalogs across providers and presenting unified management APIs.
Traditional perpetual-license models persist in sectors requiring bespoke tuning or where audit paths remain tightly coupled to in-house change-control procedures. Nevertheless, the shift toward AI-embedded query optimization and auto-remediation further tilts the advantage toward managed platforms. As multitenant security hardens, SMEs adopt enterprise-class controls without staffing dedicated security teams, reinforcing the expanding DBaaS footprint across the database market.
By Enterprise Size: SMEs Accelerate Adoption
Large enterprises maintain 67.10% revenue control, leveraging scale to integrate multi-model systems that span foundational ERP databases through real-time analytics clusters. Yet SMEs now post a 16.7% CAGR as cloud subscriptions neutralize capital barriers. Affordable DBaaS tiers with predictable per-gigabyte fees allow smaller firms to pilot AI-infused services without infrastructure procurement. Industry-specific templates expedite compliance configurations, accelerating time to value.
The ascending SME footprint broadens geographic penetration of the database market, particularly in emerging economies where mid-tier firms leapfrog legacy IT generations. Channel partners increasingly bundle vertical applications with embedded databases, masking backend complexity. Conversely, large enterprises channel expenditure toward hybrid transactional-analytical processing engines that collapse ETL cycles, underscoring divergent investment priorities within the same database market.
By Workload Type: Hybrid Systems Bridge the Transaction–Analytics Divide
Transactional workloads hold a 51.40% slice of 2025 spending, underscoring their role in order processing, payments, and customer interactions. Hybrid transactional/analytical processing (HTAP) workloads, however, are rising at 16.2% CAGR by converging OLTP consistency with real-time analytics. HTAP deployments remove labor-intensive ETL jobs and shrink decision latency, enhancing fraud detection and supply-chain agility. GridGain’s in-memory platform exemplifies simultaneous low-latency writes and vectorized analytical reads in one architecture.
Analytical (OLAP) workloads continue to profit from cloud-scale column stores that disaggregate storage and compute. In practice, distinctions blur as modern engines toggle workload modes dynamically. The database market share attributed to HTAP systems is forecast to widen as AI services demand synchronized insight against live transaction streams.
By End-user Vertical: Healthcare Accelerates Database Innovation
BFSI leads with 20.60% of 2025 revenue, deploying in-memory columnar stores for sub-millisecond risk analytics and regulatory reporting. Concurrently, healthcare & life sciences present the fastest growth at a 14.8% CAGR. Electronic medical records, genomics, and connected-device telemetry intensify data volume and variability, mandating scalable, compliance-ready databases.
Retail & e-commerce exploit real-time inventory visibility and personalization engines, relying on hybrid document-graph stores. Telecom operators implement distributed key-value stores for network telemetry, while public-sector agencies modernize citizen-service portals on relational backbones fortified with granular audit trails. Manufacturing adopts time-series databases for predictive maintenance, and media firms capitalize on scalable object stores to manage rich video libraries.
Geography Analysis
North America anchors 40.50% of 2025 revenue, leveraged by deep cloud penetration, venture funding, and the densest concentration of AI talent. The region’s enterprises lead hybrid-multicloud adoption, a pattern expected to double by 2028. Financial institutions deploy real-time analytics to manage risk and detect fraud, aligning database strategy with broader AI productivity opportunities estimated at USD 4.4 trillion. Governance emphasis on cybersecurity frameworks spurs investments in zero-trust-ready database controls.
Asia exhibits the highest growth at 17.6% CAGR, propelled by 5G roll-outs, mobile innovation, and sovereign-cloud incentives. China and India invest heavily in hyperscale data centers, while Japan and South Korea refine edge-computing models for robotics and autonomous mobility. Government stimulus for smart-manufacturing ecosystems accelerates adoption of distributed edge-native databases that process sensor streams in situ.
Europe’s trajectory is shaped by stringent data-protection legislation. The forthcoming Data Act will standardize access to non-personal device data, forcing enterprises to architect shareable yet secure storage layers. Simultaneously, ESG-reporting mandates fuel demand for time-series solutions. Nordic markets stand out for green data-center design, dovetailing database power consumption targets with renewable energy integration.

Competitive Landscape
The global database market presents a moderate concentration. Legacy providers—Oracle, Microsoft, AWS, IBM, and Google—anchor core revenues, leveraging installed bases and hybrid-cloud extensions. Oracle and Microsoft deepened cooperation via Oracle Database@Azure, allowing customers to run Exadata surfaces inside Azure regions, a move designed to reduce migration friction and capture incremental cloud workloads.
Specialized entrants pursue workload niches. Pinecone, Weaviate, and Chroma target vector search operations essential for generative-AI applications, while Timescale focuses on time-series workloads optimized for ESG reporting and IoT telemetry. Established vendors respond by embedding vector and time-series capabilities into flagship products, closing functional gaps. Microsoft’s SQL Server 2025 exemplifies this convergence with native vector support and built-in model management.
Strategic M&A shapes the landscape. Salesforce’s purchase of Informatica for USD 8 billion aims to solidify a unified data layer underpinning AI-driven CRM workflows. WPP’s acquisition of InfoSum positions the agency group to orchestrate privacy-safe data collaborations across advertiser ecosystems. Competitive positioning is increasingly defined by how seamlessly analytics, AI, and governance modules integrate with core transactional engines, blurring historical demarcations among database categories.
Database Industry Leaders
MongoDB Atlas
Mark Logic
Redis Labs Inc.
Altibase Corp.
Datastax, Inc.
- *Disclaimer: Major Players sorted in no particular order

Recent Industry Developments
- May 2025: Salesforce acquired Informatica for USD 8 billion to create an integrated data foundation across its CRM, analytics, and Agentforce AI stack
- May 2025: Microsoft launched SQL Server 2025 with native vector data types and AI model lifecycle tooling, accelerating hybrid AI deployments
- May 2025: GridGain released Platform 9.1, enabling simultaneous analytical and transactional workloads to support real-time RAG scenario
- April 2025: WPP purchased InfoSum, adding privacy-enhanced data-clean-room capabilities to its marketing cloud


Global Database Market Report Scope
In computing, a database is an organized collection of data or a type of data store based on the use of a database management system, the software that interacts with end users, applications, and the database itself to capture and analyze the data.
The database market is segmented by deployment (cloud, on-premises), enterprise (SMEs, large enterprises), end-user verticals (BFSI, retail and e-commerce, logistics and transportation, media and entertainment, healthcare, IT and telecom, other end-user verticals), geography (North America [United States, Canada], Europe [United Kingdom, Germany, France, Rest of Europe], Asia-Pacific [China, Japan, India, South Korea, Rest of Asia-Pacific], Latin America [Brazil, Mexico, Argentina, Rest of Latin America], Middle East and Africa [United Arab Emirates, Saudi Arabia, South Africa, Rest of Middle East and Africa]). The market sizes and forecasts are provided in terms of value (USD) for all the above segments.
| Relational (RDBMS) |
| NoSQL |
| NewSQL |
| Multi-Model |
| Graph |
| Cloud |
| On-Premises |
| Database-as-a-Service (DBaaS) |
| License and Maintenance Software |
| Small and Medium Enterprises (SMEs) |
| Large Enterprises |
| Transactional (OLTP) |
| Analytical (OLAP) |
| Hybrid (HTAP) |
| BFSI |
| Retail and E-commerce |
| Healthcare and Life Sciences |
| IT and Telecom |
| Logistics and Transportation |
| Media and Entertainment |
| Government and Public Sector |
| Manufacturing |
| Other End-user Verticals |
| North America | United States |
| Canada | |
| Mexico | |
| South America | Brazil |
| Argentina | |
| Rest of South America | |
| APAC | China |
| Japan | |
| India | |
| South Korea | |
| Southeast Asia | |
| Australia | |
| New Zealand | |
| Rest of APAC | |
| Europe | United Kingdom |
| Germany | |
| France | |
| Rest of Europe | |
| Middle East | United Arab Emirates |
| Saudi Arabia | |
| Turkey | |
| Rest of Middle East | |
| Africa | South Africa |
| Nigeria | |
| Kenya | |
| Rest of Africa |
| By Database Type | Relational (RDBMS) | |
| NoSQL | ||
| NewSQL | ||
| Multi-Model | ||
| Graph | ||
| By Deployment Model | Cloud | |
| On-Premises | ||
| By Service Model | Database-as-a-Service (DBaaS) | |
| License and Maintenance Software | ||
| By Enterprise Size | Small and Medium Enterprises (SMEs) | |
| Large Enterprises | ||
| By Workload Type | Transactional (OLTP) | |
| Analytical (OLAP) | ||
| Hybrid (HTAP) | ||
| By End-user Vertical | BFSI | |
| Retail and E-commerce | ||
| Healthcare and Life Sciences | ||
| IT and Telecom | ||
| Logistics and Transportation | ||
| Media and Entertainment | ||
| Government and Public Sector | ||
| Manufacturing | ||
| Other End-user Verticals | ||
| By Geography | North America | United States |
| Canada | ||
| Mexico | ||
| South America | Brazil | |
| Argentina | ||
| Rest of South America | ||
| APAC | China | |
| Japan | ||
| India | ||
| South Korea | ||
| Southeast Asia | ||
| Australia | ||
| New Zealand | ||
| Rest of APAC | ||
| Europe | United Kingdom | |
| Germany | ||
| France | ||
| Rest of Europe | ||
| Middle East | United Arab Emirates | |
| Saudi Arabia | ||
| Turkey | ||
| Rest of Middle East | ||
| Africa | South Africa | |
| Nigeria | ||
| Kenya | ||
| Rest of Africa | ||


Key Questions Answered in the Report
What is the current size of the database market?
The database market size stands at USD 171.36 billion in 2026 and is projected to reach USD 329.05 billion by 2031.
Which deployment model is growing fastest?
Cloud databases lead with an 18.3% CAGR as enterprises shift from on-premises hardware to flexible consumption models.
Why are vector databases gaining traction?
Vector databases efficiently manage high-dimensional embeddings required for generative-AI search and recommendation workloads.
How do data-sovereignty rules influence database strategy?
Sovereignty mandates require certain data to reside in-country, prompting vendors to launch regional cloud zones and tokenization features for compliance.
What segment shows the highest growth among end-user verticals?
Healthcare & life sciences is advancing at a 14.8% CAGR due to electronic health records, genomics, and IoT medical devices.
Are hybrid transactional-analytical processing (HTAP) systems replacing ETL processes?
Yes, HTAP engines integrate real-time analytics with transactional workloads, eliminating traditional ETL overhead and reducing decision latency.
Page last updated on:


