Data Logger Market Size and Share
Market Overview
| Study Period | 2019 - 2031 |
|---|---|
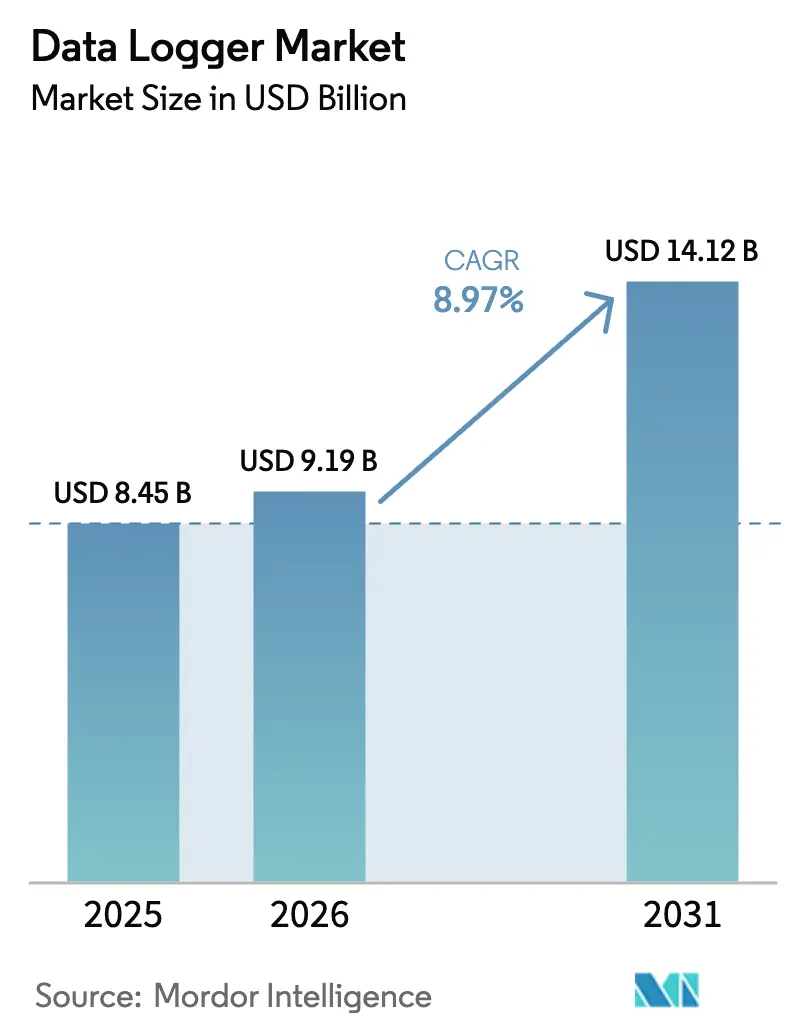
| Market Size (2026) | USD 9.19 Billion |
| Market Size (2031) | USD 14.12 Billion |
| Growth Rate (2026 - 2031) | 8.97% CAGR |
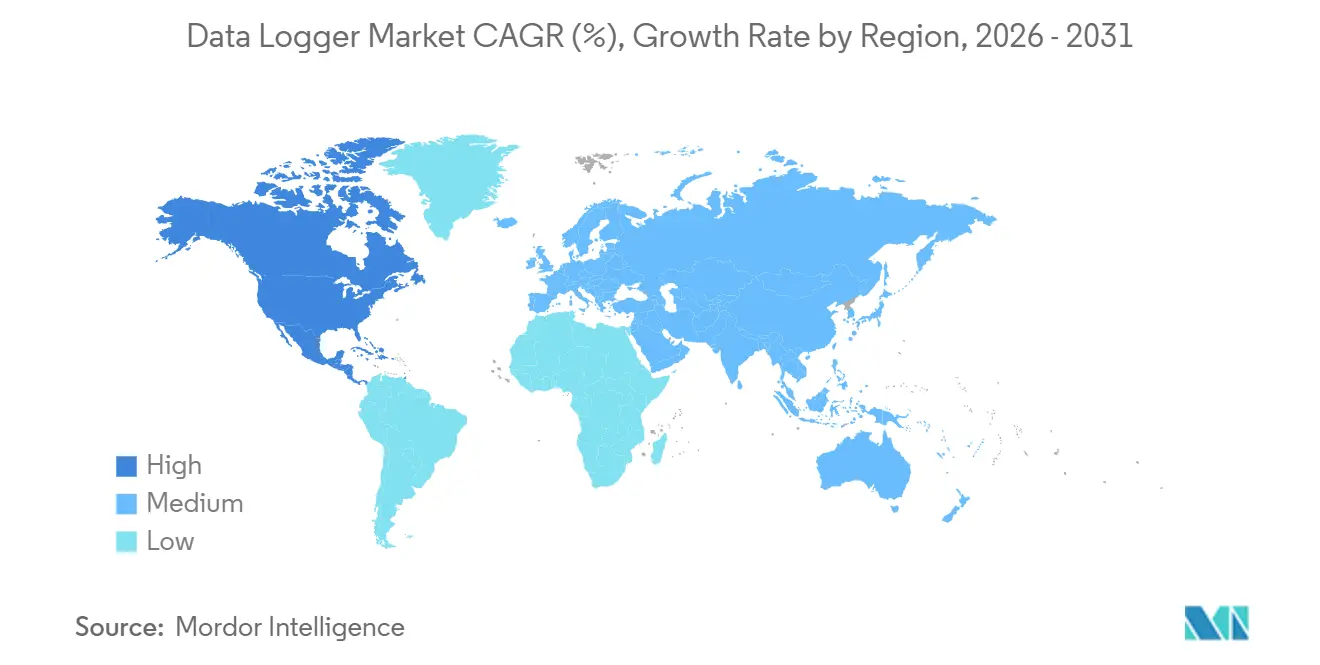
| Fastest Growing Market | Asia Pacific |
| Largest Market | North America |
| Market Concentration | Low |
Major Players *Disclaimer: Major Players sorted in no particular order Image © Mordor Intelligence. Reuse requires attribution under CC BY 4.0. | |
Data Logger Market Analysis by Mordor Intelligence
The Data Logger Market size is expected to grow from USD 8.45 billion in 2025 to USD 9.19 billion in 2026 and is forecast to reach USD 14.12 billion by 2031 at 8.97% CAGR over 2026-2031.
Demand reflects tighter compliance in pharmaceutical and food cold chains under 21 CFR Part 11 and FSMA 204, steady Industry 4.0 deployments across factories, and scale benefits from 125 million LoRaWAN devices already active across global networks. Regulatory momentum extends to EU GMP Annex 1 for sterile manufacturing and to WHO vaccine storage oversight, which together reinforce a non-discretionary replacement cycle for validated monitoring across life sciences and public health facilities. At the same time, cloud-connected workflows are gaining traction as NIST’s Cybersecurity Framework 2.0 and FDA draft guidance on medical device cybersecurity formalize supply chain and software assurance practices for hardware that moves data beyond the plant floor.[1]U.S. Food and Drug Administration, “Part 11, Electronic Records, Electronic Signatures,” FDA, fda.gov
Key Report Takeaways
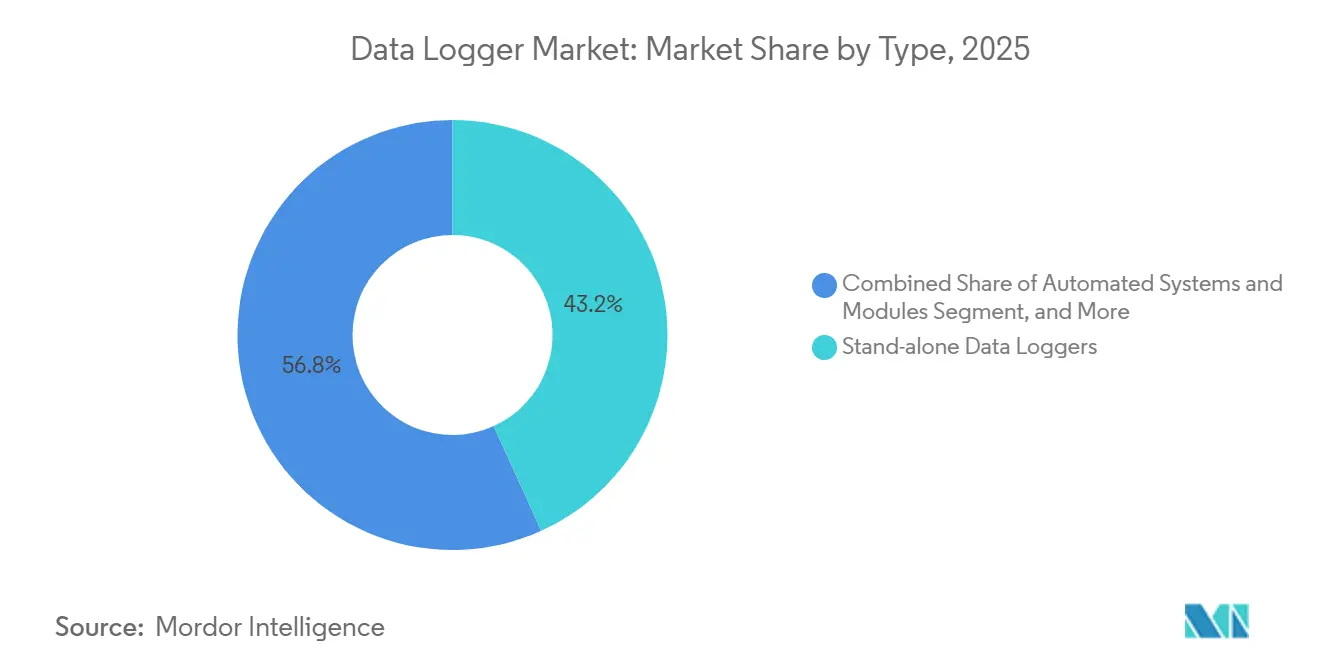
- By type, stand-alone data loggers led with 43.23% revenue share in 2025, while wireless data loggers are projected to expand at a 9.15% CAGR through 2031.
- By measurement parameter, temperature accounted for 37.43% in 2025, while humidity is projected to grow at a 10.07% CAGR through 2031.
- By connectivity, USB maintained a 45.00% share in 2025, while Bluetooth Low Energy is forecast to grow at a 9.71% CAGR through 2031.
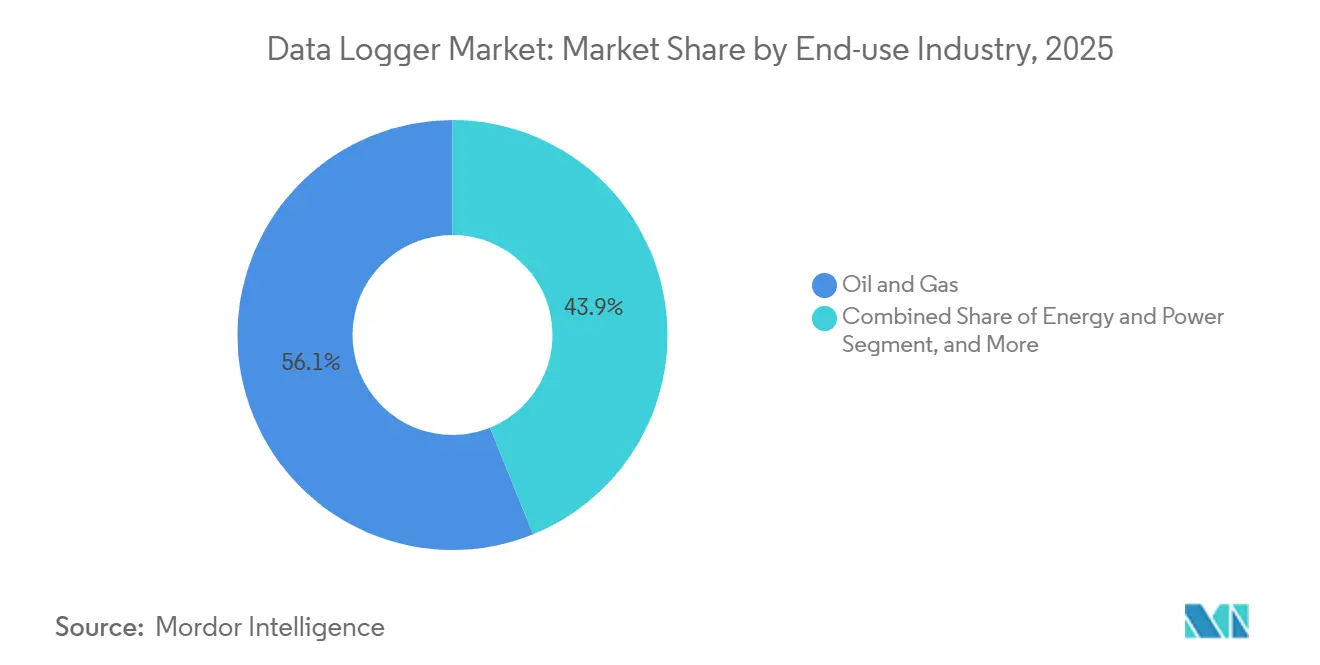
- By end-use industry, oil and gas commanded a 56.12% share in 2025, while the food and beverage sector is projected to post the highest CAGR of 10.32% from 2026 to 2031.
- By form factor, multi-channel devices held 34.30% share in 2025, while portable handheld units are forecast to grow at a 9.55% CAGR through 2031.
- By geography, North America led with a 56.00% share in 2025, while the Asia-Pacific region is projected to grow fastest at a 5.98% CAGR from 2026 to 2031.
Note: Market size and forecast figures in this report are generated using Mordor Intelligence’s proprietary estimation framework, updated with the latest available data and insights as of January 2026.
Global Data Logger Market Trends and Insights
Drivers Impact Analysis*
| Driver | (~) % Impact on CAGR Forecast | Geographic Relevance | Impact Timeline |
|---|---|---|---|
| Stricter Regulatory Compliance In Pharma And Food Cold Chains | +2.8% | Global, strongest in North America and EU | Medium term (2-4 years) |
| Rapid Industrial Automation And Industry 4.0 Adoption | +2.5% | Global, spill-over from APAC manufacturing hubs to Americas and EMEA | Short term (≤ 2 years) |
| Expansion Of Global Cold Chain Infrastructure | +2.1% | Global, with early gains in Asia-Pacific and Middle East | Long term (≥ 4 years) |
| Shift To Wireless And Cloud-Connected Loggers For Real-Time Monitoring | +1.9% | Global, accelerated adoption in North America and Western Europe | Medium term (2-4 years) |
| Data Integrity And Audit-Trail Requirements In Regulated Environments | +1.3% | Global, regulatory influence from FDA, EMA, MHRA | Medium term (2-4 years) |
| Long-Range Low-Power Wireless Protocols Enabling Facility-Wide Deployments | +1.1% | APAC core, spill-over to MEA and South America | Long term (≥ 4 years) |
| Source: Mordor Intelligence | |||
Stricter Regulatory Compliance In Pharma And Food Cold Chains
Pharmaceutical and food supply chains are enforcing digitized records and validated systems, which directly increases reliance on 21 CFR Part 11 compliant devices with electronic signatures and immutable timestamps for audit trails. EU GMP Annex 1 requires real-time environmental monitoring in Grade A and B cleanrooms for sterile manufacturing, which drives upgrades from paper logs to electronic systems across European facilities. In the United States, FSMA 204 mandates electronic traceability for the Food Traceability List by July 2028, promoting temperature logging and data consolidation at each node in the chain. Interoperability under DSCSA requires electronic product tracing that benefits from secure logger data synchronization with item-level pedigrees. WHO has also strengthened vaccine equipment oversight, and prequalified real-time models support continuous monitoring in immunization programs.[2]World Health Organization, “Equipment Monitoring Systems PQS E006,” WHO, who.int Together, these mandates reinforce a non-discretionary refresh cycle across the data logger market as regulators expect digitally signed, tamper-evident records at scale.
Rapid Industrial Automation And Industry 4.0 Adoption
Factories are increasing sensor density and data streaming to enable predictive maintenance and energy optimization, which raises the role of high channel-count data loggers at the edge. ABB and Red Hat have extended their collaboration to run containerized analytics at the edge, enabling Python-based anomaly detection on process signals with reduced round-trip delays to the cloud. Siemens has integrated data logger feeds into digital twins for factory systems, allowing simulation-driven adjustments to HVAC and compressed air setpoints during shifts to reduce energy consumption.[3]Siemens, “Digital Twin for Manufacturing,” Siemens, siemens.com Interoperability is advancing as new equipment supports OPC UA semantics, while legacy lines continue to use Modbus and other serial fieldbuses that many modular data acquisition systems bridge today. High sample-rate logging enables battery cell formation analysis, which pairs voltage, current, and thermal profiles to flag deviations early in commissioning cycles. These operational uses continue to reinforce the data logger market as a foundational layer for smart manufacturing workflows.
Expansion Of Global Cold Chain Infrastructure
Loggers are central to the compliance push in cold chains because they capture continuous evidence of temperature and environment conditions while linking to traceability records. FSMA 204 timelines have accelerated plans to roll out validated logging and automated exception handling across U.S. distribution, retail, and transport nodes. India’s export growth in pharmaceuticals is increasing demand for GDP-compliant logistics and continuous temperature mapping from plant to port. The CDC recommends glycol-buffered temperature probes for vaccine storage to cut false positives caused by door openings, which informs device selection for clinics and pharmacies. Unified cellular and satellite modules are easing connectivity gaps along long-haul lanes by providing seamless failover across terrestrial and non-terrestrial networks. These elements combine to expand the data logger market wherever temperature-sensitive goods move through multi-node, multi-network supply chains.
Shift To Wireless And Cloud-Connected Loggers For Real-Time Monitoring
Wireless data logger adoption is rising as organizations seek real-time alerting, cloud dashboards, and remote access for quality teams, with wireless units projected to expand at a 9.15% CAGR through 2031 in the data logger market. LoRaWAN coverage supports large-scale deployments using only a handful of gateways to cover facilities and farms, and its installed base already crosses 125 million devices. Direct satellite connectivity options are broadening the reach of cellular IoT chipsets to remote locations, which improves telemetry continuity for pipelines and offshore assets. Cloud-first monitoring platforms reduce IT overhead for validated environments and allow secure remote viewing of alarms and trends. Bluetooth 5.3 enhancements extend range and throughput for field commissioning and portable workflows, which shortens upload times while keeping power budgets tight. With carrier-certified modules that fail over between terrestrial and non-terrestrial networks, blind spots that once disrupted long-haul telemetry are now manageable across the data logger market.
Restraints Impact Analysis*
| Restraint | (~) % Impact on CAGR Forecast | Geographic Relevance | Impact Timeline |
|---|---|---|---|
| High Upfront and Lifecycle Costs Including Calibration and Software | -1.8% | Global, acute in price-sensitive emerging markets | Short term (≤ 2 years) |
| Cybersecurity and Data Privacy Risks for Connected Loggers | -1.3% | North America and EU, regulatory influence expanding globally | Medium term (2-4 years) |
| Calibration Traceability and GxP Compliance Overhead at Scale | -1.1% | Global, strongest in regulated pharma and biotech hubs | Medium term (2-4 years) |
| Interoperability and Regional Wireless Spectrum Fragmentation | -0.9% | APAC and EU, spill-over to global deployments | Long term (≥ 4 years) |
| Source: Mordor Intelligence | |||
High Upfront And Lifecycle Costs Including Calibration And Software
Total cost of ownership remains a barrier because validated software, calibrations, and connectivity fees can multiply the initial hardware outlay across a five-year window. Organizations with tight margins often delay upgrades until audits or non-conformances trigger corrective actions, which keeps replacement cycles lumpy in the data logger market. Security hardening can add services and labor when shipped settings are not aligned to best practices, as seen in recent advisory notes that prompted device-level configuration changes in industrial environments. Annual calibration policies required in regulated sectors increase ongoing cost for large fleets while battery replacement for wireless models adds to lifecycle budgets in heavy use cases. These factors raise the importance of calibration-friendly probe designs, PoE-powered hardware, and remote firmware management to lower recurring cost over time in the data logger market.
Cybersecurity And Data Privacy Risks For Connected Loggers
Connected loggers sit near operational assets and can bridge IT and OT domains, which raises risk when firmware and interfaces are not kept current. Public disclosures have shown how default authentication gaps on recorder families allowed settings manipulation if networks were not segmented and patched, which reinforced basic hardening requirements for deployments. European privacy law explicitly calls for encryption and pseudonymization for personal data, which can apply when employee identifiers or patient records are coupled to environmental traces. Medical device cybersecurity guidance also underlines software composition transparency and secure lifecycle practices, which vendors must address when they embed third-party libraries. The latest NIST framework update elevates supply chain assurance and vendor governance expectations that extend down to component-level firmware in sensors and radios. These measures influence procurement, architecture, and maintenance decisions across the data logger market as fleets transition to cloud-linked models.
*Our forecasts treat driver/restraint impacts as directional, not additive. The impact forecasts reflect baseline growth, mix effects, and variable interactions.
Segment Analysis
By Type: Stand-Alone Devices Anchor Pharma Validation Yet Wireless Loggers Surge at 9.15% CAGR
Stand-alone data loggers held 43.23% share in 2025 in the data logger market, supported by validation protocols that prefer independent operation and air-gapped audit trails in highly regulated settings. These units can store large data sets and produce digitally signed PDF reports over USB, which meets FDA Part 11 expectations for tamper evidence and electronic signatures during inspections. In qualification, ruggedized devices withstand thermal cycles without unacceptable drift, which is essential for process runs where minor deviations carry high product risks. Paperless recorders consolidate hundreds of channels for utilities and substations, which helps address NERC CIP-007 requirements for secure logging and long-term retention. Newer product lines provide dual modes, such as Bluetooth for real-time tasks and USB-C for validated audits, which helps teams standardize across commissioning and compliance workflows.
Wireless data loggers are projected to expand at a 9.15% CAGR through 2031 in the data logger market as real-time alerts and remote dashboards reduce response time and travel for quality staff. Integration with SCADA via Modbus TCP or OPC UA helps close loops when repeated out-of-spec readings must trigger control actions instead of manual interventions. PC-connected high-bandwidth systems serve R&D and validation labs where transient power or thermal events need high sample rates beyond typical environmental logging. Hybrid connectivity models are becoming common to balance security and responsiveness, which preserves compliance during audits while enabling continuous improvement for operations teams. Together, these patterns support both legacy GMP expectations and continuous monitoring needs in the data logger market.


By Measurement Parameter: Temperature Dominates at 37.43% Yet Humidity Loggers Expand Fastest at 10.07% CAGR
Temperature devices held 37.43% share in 2025 in the data logger market, reflecting strict cold chain and storage controls in life sciences and food safety programs. The CDC’s updated vaccine storage guide underscores the use of glycol-buffered probes to smooth short door opening spikes, which reduces nuisance alarms and improves signal fidelity for refrigerators and freezers. Devices with hot-swappable calibration support minimize downtime when facilities must maintain continuous monitoring across all storage units. In logistics, transport standards reference vibration and shock thresholds that can void warranties without proper documentation, which further embeds multi-sensor logging in shipping lanes.
Humidity loggers are projected to grow at a 10.07% CAGR through 2031 in the data logger market as GMP setpoints for sterile operations expect tight control to manage electrostatic discharge and material stability. Agriculture and post-harvest storage also depend on moisture tracking because elevated levels can trigger spoilage and contamination in bulk grains and produce. Pressure, voltage, current, and vibration channels support equipment validation and predictive maintenance, while CO₂ and IAQ loggers enable demand-controlled ventilation to trim building energy use consistent with ASHRAE 62.1 practices. pH and conductivity logging sustains compliance in wastewater treatment where automated sampling improves visibility relative to manual grabs, which has been a frequent gap in prior audits. Overall, portfolio breadth by parameter helps vendors address multiple use cases within one facility in the data logger market.
By Connectivity: USB Retains 45.00% Share for Offline Audits Yet Bluetooth Low Energy Surges at 9.71% CAGR
USB connectivity held 45.00% share in 2025 in the data logger market, supported by air-gapped audit workflows and fast data offloads that reduce time during inspections. Facilities lean on deterministic data transfers for validation packages where networks are segmented or restricted under internal policies that reflect cybersecurity standards. In parallel, Wi-Fi and Ethernet suit fixed infrastructure when network access and IT support are available, although commissioning can require additional labor for enterprise authentication.
Bluetooth Low Energy is projected to grow at a 9.71% CAGR through 2031 in the data logger market as Bluetooth 5.3 extends range and doubles throughput for field tasks, which shrinks upload time from devices to phones and tablets. Field researchers are now combining smartphone apps with secure cloud stores to eliminate manual retrieval runs from remote deployments while preserving full context with location tags. Cellular links including NB-IoT and LTE-M support remote covers where Wi-Fi is impractical, and GSMA-backed standards give organizations clear pathways for global deployments under carrier-grade reliability. LPWAN options like LoRaWAN expand site-wide reach with few gateways and improve economics as fleets scale. Multi-bearer modules that auto-switch between terrestrial and satellite networks are removing coverage blind spots along long-haul routes and offshore assets in the data logger market.
By End-Use Industry: Oil and Gas Commands 56.12% Share on Pipeline Integrity Yet Food and Beverage Grows Fastest at 10.32% CAGR
Oil and gas accounted for 56.12% share in 2025 in the data logger market, reflecting heavy use in pipeline integrity, upstream telemetry, and process safety programs that depend on pressure, flow, and temperature monitoring to reduce unplanned outages. Field conditions and long distances raise the value of long battery life, satellite failover, and tamper-resistant enclosures to maintain continuity. Utilities and power operators deploy logging across transmission and substations to satisfy security and audit standards that require immutable records for access and load events. In healthcare and pharmaceuticals, PoE-powered options help remove disposable batteries from hospital networks while preserving continuous performance across thousands of channels.
Food and beverage is the fastest-growing segment at a projected 10.32% CAGR through 2031 in the data logger market, driven by FSMA 204 traceability and monitoring requirements for high-risk foods by July 2028. Shipments are adopting multi-sensor solutions that combine temperature, humidity, light, and shock to document conditions and speed exception handling. Cold-chain providers and packaging suppliers are combining passive thermal systems with real-time telemetry to improve lane economics and reduce spoilage risk. In building automation, CO₂ and IAQ logging enable demand control that aligns fresh air volumes to occupancy counts, which saves energy across campuses and complexes. Environmental monitoring use cases continue to expand with weather and microclimate networks that feed forecasting and resilience plans in the data logger market.
By Form Factor: Multi-Channel Loggers Lead at 34.30% Share for Test Stands Yet Portable Devices Expand at 9.55% CAGR
Multi-channel devices held 34.30% share in 2025 in the data logger market as high channel counts and fast sampling support battery formation, motor testing, and other dynamic validation tasks. ScopeCorder-class platforms combine oscilloscope-grade acquisition with long-duration logging to capture transient events that lower-speed devices miss during startups and switching. Bench-top and rack systems remain essential in metrology labs and national institutes where long-term accuracy and traceability are critical for reference measurements. DIN-rail and panel-mount designs add density in industrial cabinets while channel isolation prevents ground loops in mixed-signal plants.
Portable and handheld data loggers are projected to expand at a 9.55% CAGR through 2031 in the data logger market as field engineers replace paper logs with mobile-linked devices that offload high volumes in seconds. USB stick forms continue to serve couriers and service teams that need tamper-evident cold-chain records with simple workflows and glycol-buffered probes to filter nuisance alarms. Research teams use rugged controllers for remote stations in extreme climates, which places a premium on uptime, wide operating ranges, and long MTBF. Across categories, vendors are also bridging offline audit needs with live streaming for continuous monitoring by offering multi-mode designs and smartphone apps in the data logger market.
Geography Analysis
North America held 56.00% share in 2025 in the data logger market, which reflects a large installed base across temperature-controlled storage, power infrastructure, and regulated manufacturing programs. FSMA 204 deadlines are driving software and device rollouts that automate traceability and consolidate exceptions to speed release decisions in food distribution and retail. Electric sector standards reinforce deployment of recorders with long retention and tamper-evident logs in substations and control centers. Vaccine management policies continue to influence device and probe selection in clinics and pharmacies, which supports standardized monitoring and response workflows. In R&D and battery manufacturing, high channel logging for thermal and electrical parameters helps validate formation and cell quality in commissioning lines. Remote environmental networks rely on rugged controllers with wide temperature ranges to operate through winters and in isolated locations.
Asia-Pacific is projected to grow fastest at a 5.98% CAGR through 2031 in the data logger market, supported by smart manufacturing investments and export-oriented pharmaceutical and electronics supply chains. India’s rising pharmaceutical exports raise demand for GDP-compliant logistics and last-mile visibility with continuous logging from plant to port. Battery and semiconductor manufacturing clusters use millisecond-scale scanning to support process control and quality in cleanrooms, which favors modular DAQ platforms. In agriculture and remote infrastructure, LoRaWAN deployments span large areas with a small number of gateways to track environmental conditions and equipment health. For offshore and remote assets that lack consistent terrestrial coverage, NTN-certified cellular modules are extending telemetry reach with direct satellite links in the data logger market.
Europe held 24.00% share in 2025 in the data logger market as Annex 1 monitoring expectations continue to shape investments in life sciences manufacturing and storage. Vendors have expanded regional logistics capacity to shorten lead times for validated loggers and probes, which supports compliance-driven refresh cycles. Energy transition planning and grid modernization increase the use of data logging to balance renewables and storage, which is a pillar of national energy strategies. Good distribution practice in the United Kingdom continues to demand electronic temperature records, which has expanded Wi-Fi logging in warehouses and transport fleets. Across Southern Europe, wind and solar growth plus offshore plans support more nacelle and meteorological logging for predictive controls and maintenance in the data logger market.

Competitive Landscape
The data logger market remains fragmented, with the top five vendors accounting for 25-30% combined share, while a long tail of regional specialists serves the cold chain. Testo acquired ELPRO-BUCHS AG to combine HVAC instrumentation with pharmaceutical validation solutions and align hardware and software bundles for global cold chain users. LI-COR completed the purchase of Onset, which unifies greenhouse gas measurement with HOBO environmental sensor networks that are widely used in field research. Vaisala expanded into weather intelligence and climate business lines through targeted acquisitions, while also launching PoE logger platforms to reduce maintenance in clinical and laboratory networks. Vendors are also advancing hybrid connectivity with devices that deliver offline validation plus live streaming for continuous monitoring in the data logger market.
Technology differentiation centers on edge analytics, secure cloud integrations, and cross-bearer connectivity. ABB and Red Hat advanced edge orchestration to run analytics locally in process industries, reducing latency and reliance on bandwidth for quality monitoring. High-speed DAQ and long retention paperless recorders continue to anchor power and manufacturing use cases where detailed traces and secure archives are both required. In cloud-connected workflows, cybersecurity frameworks and SBOM expectations influence buyer checklists and vendor roadmaps for validated environments. Multi-protocol devices with Bluetooth, Wi-Fi, Ethernet, and LPWAN are now standard across new product lines in the data logger market.
White-space opportunities include predictive SaaS that merges vibration, temperature, and current signatures to forecast failures and cut downtime, and also cellular-satellite modules that eliminate blind spots for long-haul and offshore lanes. New offerings are automating qualification and continuous temperature mapping for GxP operations to compress timelines while staying Part 11 compliant. Region-specific spectrum needs, certifications, and security baselines still shape product variants and go-to-market plans across global portfolios in the data logger market.
Data Logger Industry Leaders
Testo SE & Co. KGaA
Onset Computer Corporation
Hioki E.E. Corporation
Yokogawa Electric Corporation
Campbell Scientific, Inc.
- *Disclaimer: Major Players sorted in no particular order

Recent Industry Developments
- December 2025: Testo unveiled the 174 BT series mini data loggers featuring dual Bluetooth and USB-C connectivity, enabling offline pharmaceutical validation mode for GMP audits alongside real-time streaming via the testo Smart App, with promotional pricing offering 19% discounts through December 31, 2025 to accelerate market penetration in cold chain applications.
- December 2025: Vaisala, with partner Printec, secured a contract to modernize Runway Visual Range (RVR) systems at seven major Greek airports, deploying advanced environmental sensors and data loggers to enhance aviation safety under low-visibility conditions, reflecting the company's strategic expansion into infrastructure monitoring.
- December 2025: Shanghai Dewav IoT received WHO PQS prequalification for its Frigga V5 Plus multi-sensor logger, which monitors temperature, humidity, light, acceleration, tilt, and GPS location in a single device, addressing vaccine cold chain requirements across 194 WHO member states where 50% of vaccines are wasted due to temperature excursions.
- November 2025: Onset Computer Corporation integrated LI-COR Cloud Store with its HOBOconnect mobile app, enabling field researchers to offload GPS-tagged environmental data wirelessly, reducing manual logger retrieval time from 40 hours monthly to near-zero for 12,000-hectare forestry microclimatology projects.


Global Data Logger Market Report Scope
A data logger is a battery-powered device used for recording and storing information. Various data loggers are designed to record information related to the environment in which they are positioned, thereby enabling users to obtain a record of events that occur over a specified period. Data loggers record sensor data over extended periods for monitoring, testing, and analyzing asset health and performance.
The Data Logger Market Report is Segmented by Type (Stand-alone Data Loggers, Automated Systems and Modules, PC-Connected Data Acquisition Loggers, Paperless Recorders), Measurement Parameter (Temperature, Humidity, Pressure, Voltage and Current, Vibration and Shock, CO2 and IAQ, pH and Conductivity), Connectivity (USB, Bluetooth Low Energy, Wi-Fi, Ethernet, Cellular, Sub-GHz and LPWAN), End-use Industry (Pharmaceuticals and Healthcare, Food and Beverage, Oil and Gas, Manufacturing, Energy, Environmental, HVAC, Transportation), Form Factor (Portable, USB Stick, Single-Channel, Multi-Channel, Rack-Mounted, DIN-Rail), and Geography (North America, South America, Europe, Asia-Pacific, Middle East, Africa). Market Forecasts are Provided in Terms of Value (USD).
| Stand-alone Data Loggers |
| Automated Systems and Modules |
| PC-Connected Data Acquisition Loggers |
| Paperless Recorders |
| Temperature Data Loggers |
| Humidity Data Loggers |
| Pressure Data Loggers |
| Voltage and Current Data Loggers |
| Vibration and Shock Data Loggers |
| CO₂ and Indoor Air Quality Data Loggers |
| pH and Conductivity Data Loggers |
| USB |
| Bluetooth Low Energy |
| Wi-Fi |
| Ethernet |
| Cellular (2G to 5G, LTE-M, NB-IoT) |
| Sub-GHz and LPWAN (LoRa, Zigbee) |
| Pharmaceuticals and Healthcare |
| Food and Beverage |
| Oil and Gas |
| Manufacturing and Industrial Automation |
| Energy and Power |
| Environmental and Weather Monitoring |
| Building Automation and HVAC |
| Transportation and Logistics |
| Portable and Handheld Data Loggers |
| USB Stick Data Loggers |
| Single-Channel Data Loggers |
| Multi-Channel Data Loggers |
| Rack-Mounted and Bench-Top Systems |
| DIN-Rail and Panel-Mount Loggers |
| North America | United States |
| Canada | |
| Mexico | |
| South America | Brazil |
| Argentina | |
| Chile | |
| Rest of South America | |
| Europe | Germany |
| United Kingdom | |
| France | |
| Italy | |
| Spain | |
| Russia | |
| Rest of Europe | |
| Asia-Pacific | China |
| India | |
| Japan | |
| South Korea | |
| Australia | |
| Southeast Asia | |
| Rest of Asia-Pacific | |
| Middle East | Saudi Arabia |
| United Arab Emirates | |
| Turkey | |
| Israel | |
| Rest of Middle East | |
| Africa | South Africa |
| Nigeria | |
| Egypt | |
| Kenya | |
| Rest of Africa |
| By Type | Stand-alone Data Loggers | |
| Automated Systems and Modules | ||
| PC-Connected Data Acquisition Loggers | ||
| Paperless Recorders | ||
| By Measurement Parameter | Temperature Data Loggers | |
| Humidity Data Loggers | ||
| Pressure Data Loggers | ||
| Voltage and Current Data Loggers | ||
| Vibration and Shock Data Loggers | ||
| CO₂ and Indoor Air Quality Data Loggers | ||
| pH and Conductivity Data Loggers | ||
| By Connectivity | USB | |
| Bluetooth Low Energy | ||
| Wi-Fi | ||
| Ethernet | ||
| Cellular (2G to 5G, LTE-M, NB-IoT) | ||
| Sub-GHz and LPWAN (LoRa, Zigbee) | ||
| By End-use Industry | Pharmaceuticals and Healthcare | |
| Food and Beverage | ||
| Oil and Gas | ||
| Manufacturing and Industrial Automation | ||
| Energy and Power | ||
| Environmental and Weather Monitoring | ||
| Building Automation and HVAC | ||
| Transportation and Logistics | ||
| By Form Factor | Portable and Handheld Data Loggers | |
| USB Stick Data Loggers | ||
| Single-Channel Data Loggers | ||
| Multi-Channel Data Loggers | ||
| Rack-Mounted and Bench-Top Systems | ||
| DIN-Rail and Panel-Mount Loggers | ||
| By Geography | North America | United States |
| Canada | ||
| Mexico | ||
| South America | Brazil | |
| Argentina | ||
| Chile | ||
| Rest of South America | ||
| Europe | Germany | |
| United Kingdom | ||
| France | ||
| Italy | ||
| Spain | ||
| Russia | ||
| Rest of Europe | ||
| Asia-Pacific | China | |
| India | ||
| Japan | ||
| South Korea | ||
| Australia | ||
| Southeast Asia | ||
| Rest of Asia-Pacific | ||
| Middle East | Saudi Arabia | |
| United Arab Emirates | ||
| Turkey | ||
| Israel | ||
| Rest of Middle East | ||
| Africa | South Africa | |
| Nigeria | ||
| Egypt | ||
| Kenya | ||
| Rest of Africa | ||


Key Questions Answered in the Report
What is the current size and growth outlook for the data logger market?
The data logger market size is USD 9.19 billion in 2026 and is projected to reach USD 14.12 billion by 2031 at an 8.97% CAGR.
Which end-use segment is growing the fastest in the data logger market?
Food and beverage is the fastest-growing end-use with a projected 10.32% CAGR to 2031, supported by FSMA 204 traceability and continuous monitoring needs.
Which product type leads the data logger market?
Stand-alone devices lead with 43.23% share in 2025, while wireless units are projected to grow at 9.15% CAGR through 2031.
What connectivity is gaining share in the data logger market?
Bluetooth Low Energy is projected to expand at 9.71% CAGR through 2031, driven by field commissioning and mobile upload workflows.
Which region leads and which grows fastest in the data logger market?
North America leads with 56.00% share in 2025, and Asia-Pacific is projected to grow fastest at a 5.98% CAGR through 2031.
What are the main compliance forces shaping the data logger market?
21 CFR Part 11, EU GMP Annex 1, and FSMA 204 are the key forces, and they drive adoption of validated, secure, and traceable monitoring systems.
Page last updated on:


