RAN Analytics and Monitoring Market Size and Share
Market Overview
| Study Period | 2020 - 2031 |
|---|---|
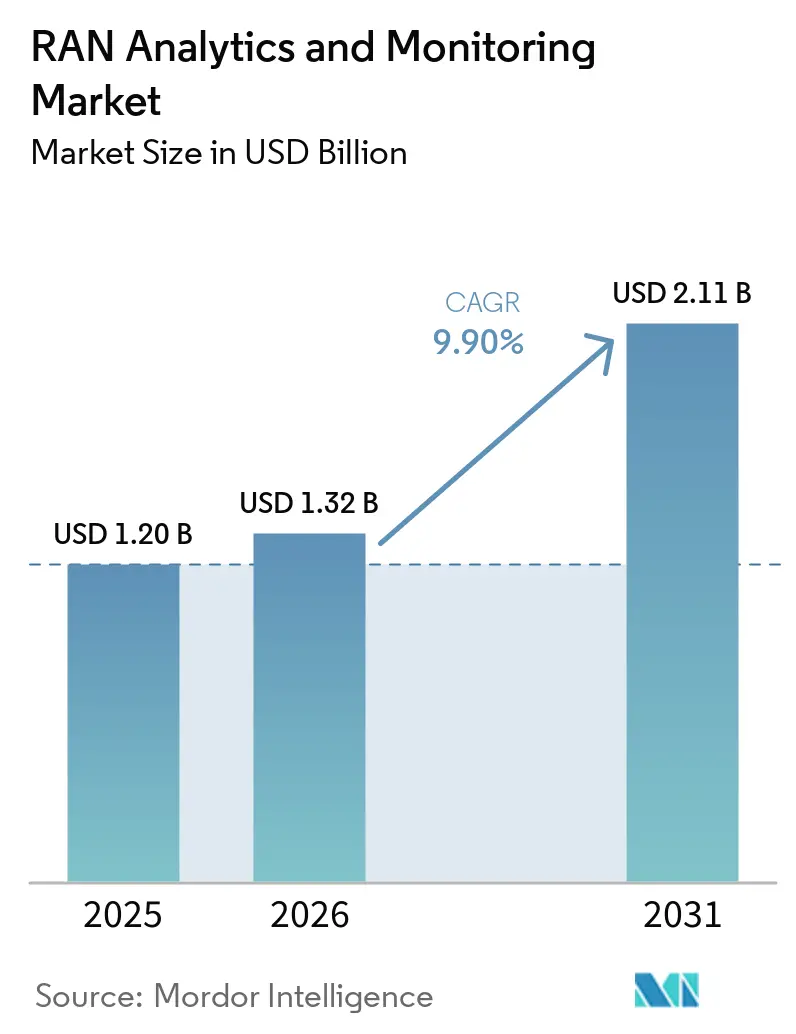
| Market Size (2026) | USD 1.32 Billion |
| Market Size (2031) | USD 2.11 Billion |
| Growth Rate (2026 - 2031) | 9.90% CAGR |
| Fastest Growing Market | Asia-Pacific |
| Largest Market | North America |
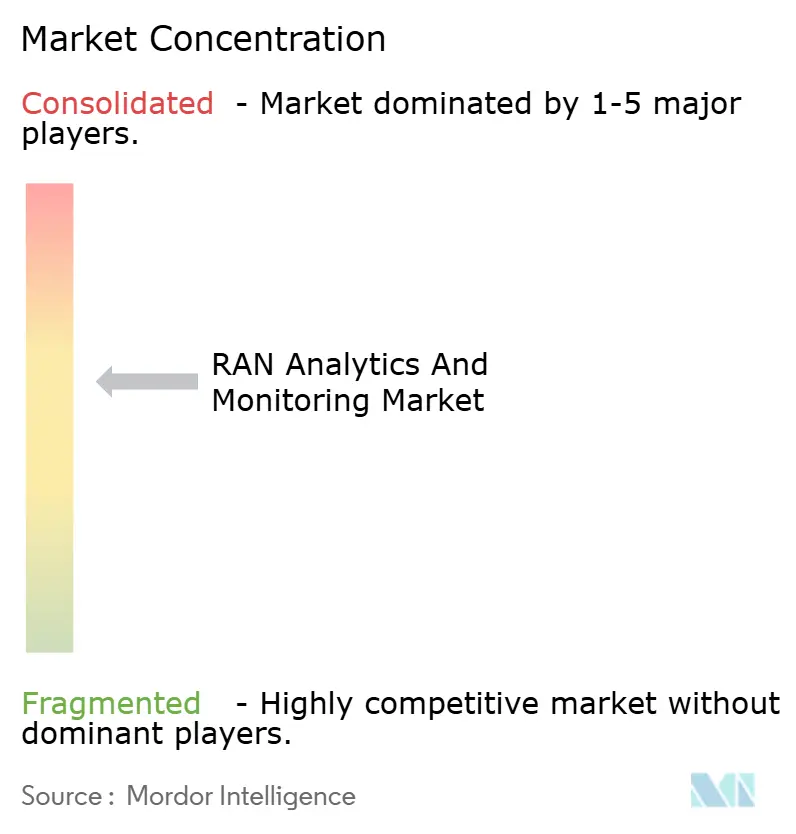
| Market Concentration | Medium |
Major Players *Disclaimer: Major Players sorted in no particular order Image © Mordor Intelligence. Reuse requires attribution under CC BY 4.0. | |
RAN Analytics and Monitoring Market Analysis by Mordor Intelligence
The RAN analytics and monitoring market size is projected to expand from USD 1.20 billion in 2025 and USD 1.32 billion in 2026 to USD 2.11 billion by 2031, registering a CAGR of 9.9% between 2026 to 2031. Ongoing 5G densification, cloud migration, and energy-efficiency mandates are accelerating demand for predictive, AI-enabled visibility across multi-vendor radio access footprints. Operators that once relied on reactive fault management are investing in near-real-time agents able to automate remediation, optimize power consumption, and correlate RAN telemetry with edge compute performance. Large-scale deployments such as Huawei and China Mobile’s 400,000-site intelligent-agent roll-out, together with American Tower’s 5G equipment upgrades across 75% of its United States portfolio, illustrate how commercial momentum has moved from proof-of-concept to mainstream adoption. At the same time, private 5G networks in Industry 4.0 plants, open RAN initiatives, and regulatory pressure to track carbon output are widening the addressable base for specialized platforms and managed analytics services.
Key Report Takeaways
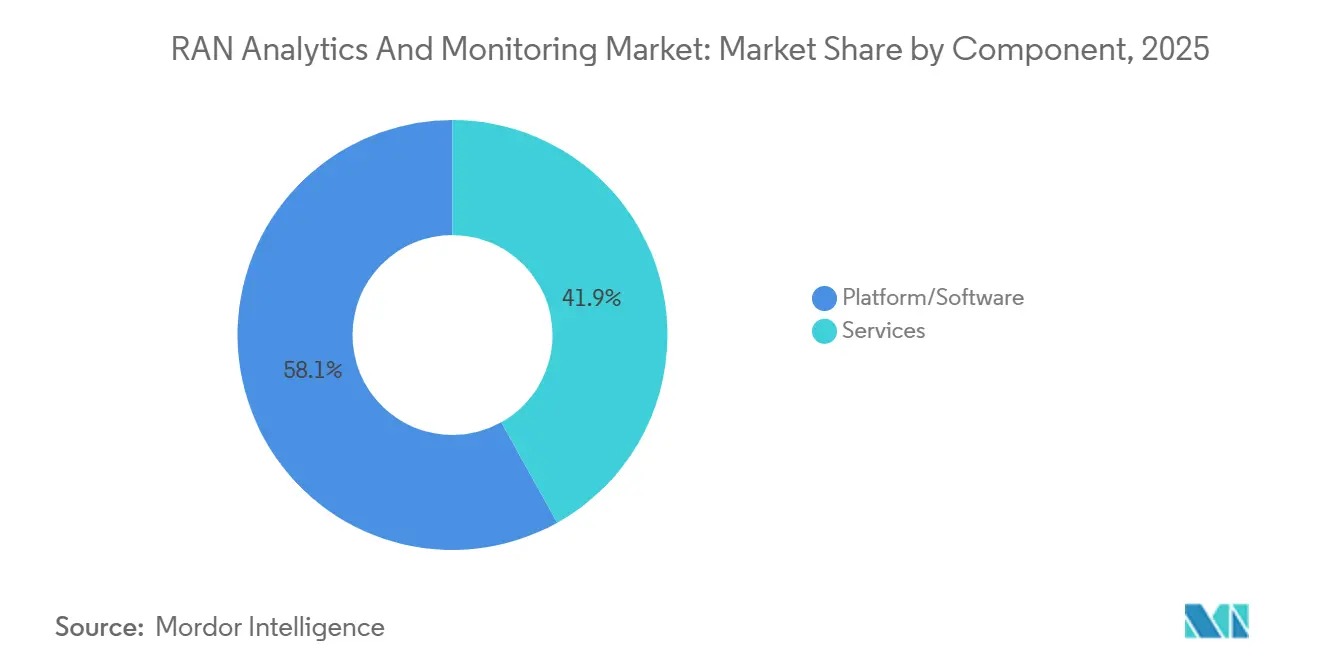
- By component, platform and software solutions led with 58.1% of the RAN analytics and monitoring market share in 2025, while the services segment is set to post the fastest 11.7% CAGR through 2031.
- By deployment mode, cloud-based implementations captured 55.8% of the RAN analytics and monitoring market in 2025 and are forecast to expand at a 12.1% CAGR, outpacing on-premises roll-outs over 2026-2031.
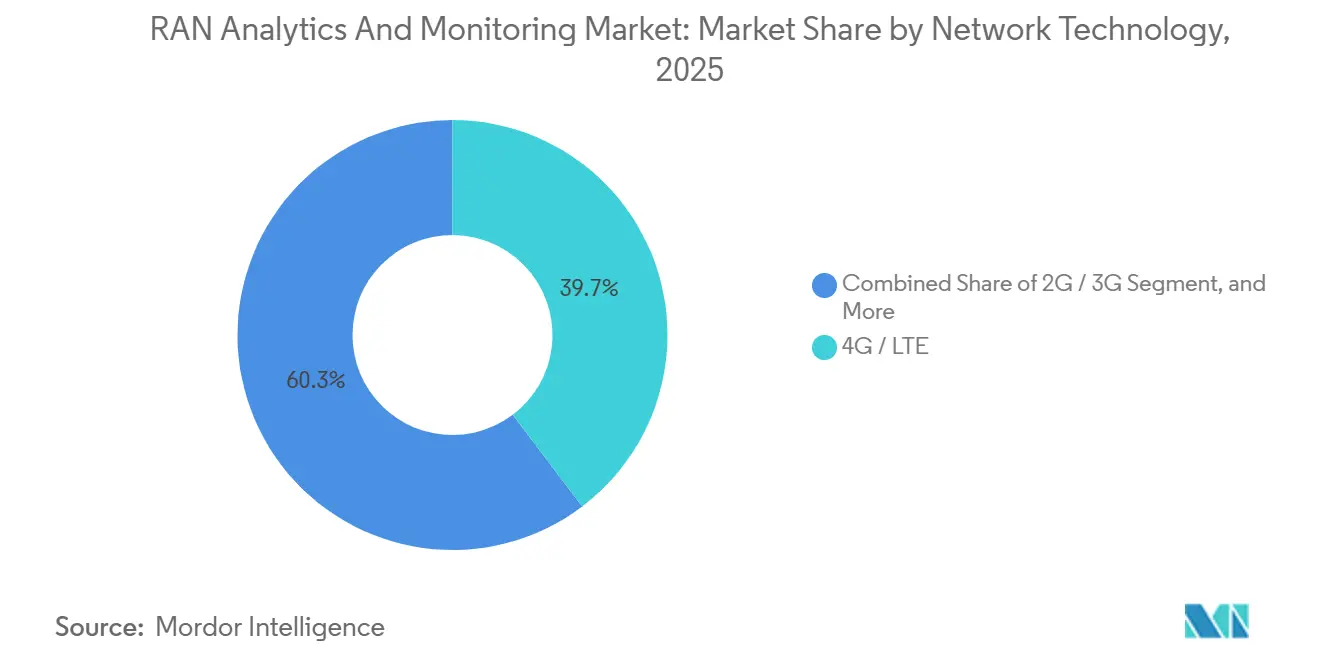
- By network technology, 4G and LTE accounted for 39.7% of the RAN analytics and monitoring market in 2025, whereas 5G NR is projected to grow the fastest at a 12.6% CAGR during the same period.
- By application, performance management accounted for 36.4% of the RAN analytics and monitoring market in 2025, but energy and capacity optimization is advancing at a leading 12.7% CAGR.
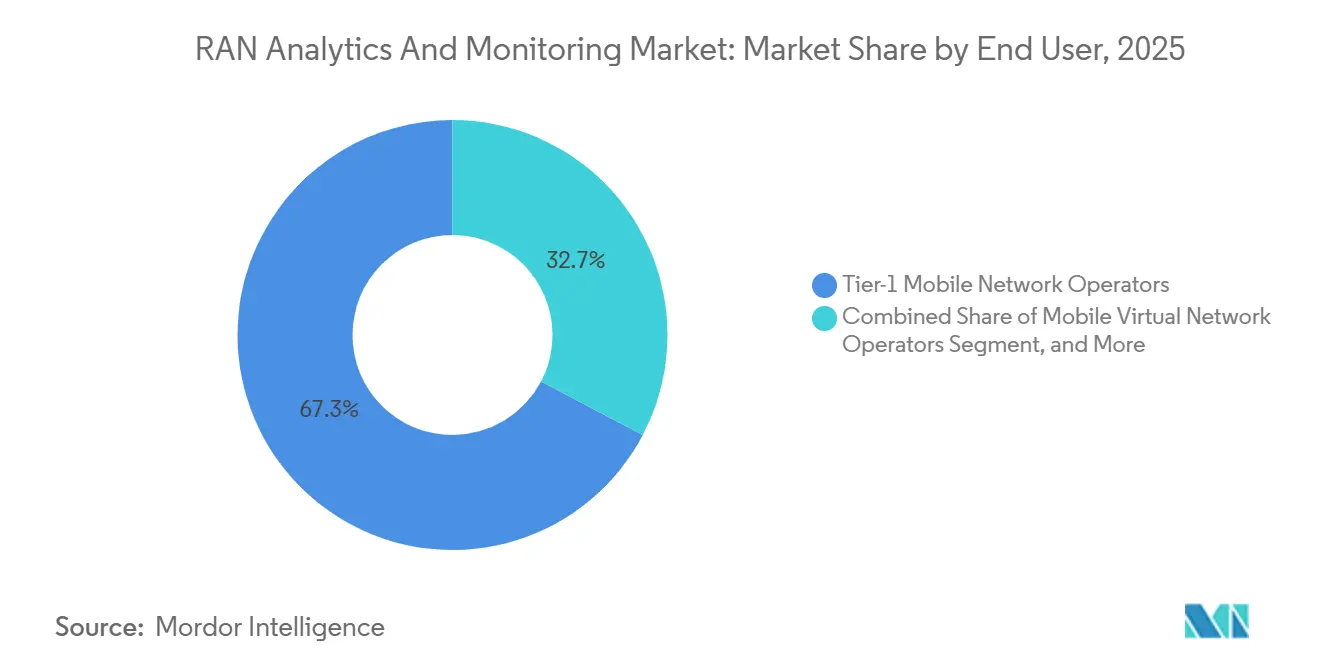
- By end user, tier-1 mobile network operators held 67.3% of the RAN analytics and monitoring market in 2025, yet private enterprise networks will record the highest 12.5% CAGR to 2031.
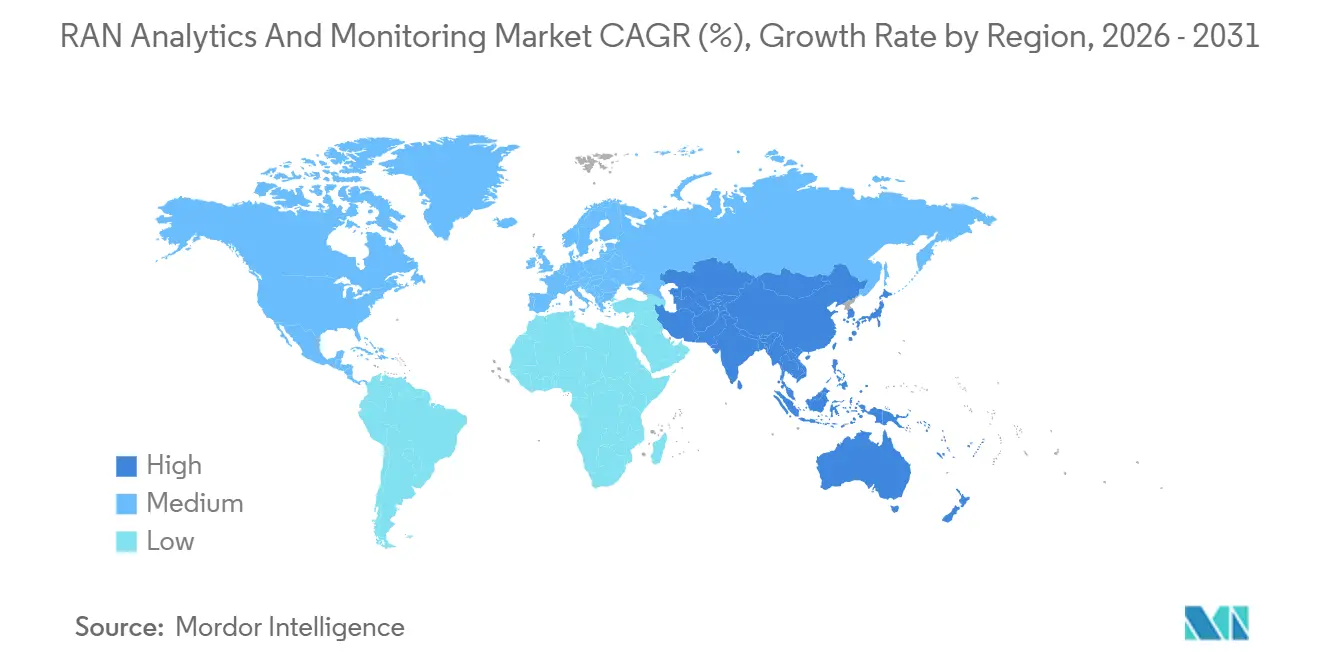
- By geography, North America dominated with 41.2% share of the RAN analytics and monitoring market in 2025, while Asia-Pacific is poised to expand the fastest at an 11.4% CAGR.
Note: Market size and forecast figures in this report are generated using Mordor Intelligence’s proprietary estimation framework, updated with the latest available data and insights as of January 2026.
Global RAN Analytics and Monitoring Market Trends and Insights
Drivers Impact Analysis*
| Driver | (~) % Impact on CAGR Forecast | Geographic Relevance | Impact Timeline |
|---|---|---|---|
| AI-Driven Predictive Maintenance for 5G Densification | +2.1% | Global, led by China, North America, Western Europe | Medium term (2-4 years) |
| Cloud-Native RAN Disaggregation Accelerates Data Visibility | +1.8% | North America and Europe lead, Asia-Pacific rising | Medium term (2-4 years) |
| Surge of Private 5G Networks in Industry 4.0 Plants | +1.5% | North America, Germany, Japan, South Korea, India, Southeast Asia | Short term (≤ 2 years) |
| Open RAN Automation and xApps-rApps Ecosystem Expansion | +1.3% | North America, Europe, India | Medium term (2-4 years) |
| Energy-Efficiency Mandates Driving RAN Power Analytics | +1.2% | Europe, Asia-Pacific, North America | Long term (≥ 4 years) |
| Telco Push Toward Zero-Touch Operations | +1.0% | Global, tier-1 leadership in North America and Europe | Long term (≥ 4 years) |
| Source: Mordor Intelligence | |||
AI-Driven Predictive Maintenance For 5G Densification
Predictive maintenance is becoming essential as operators add thousands of small cells to satisfy mid-band capacity requirements. The shift cuts manual engineering hours by automatically detecting interference, sleeping cells, or degraded beams before service quality dips.[1]O. Smith, “Mycom Enhances Assurance Portfolio With Streaming Telemetry Capabilities,” mycom-osi.com Deployments such as Huawei and China Mobile’s 400,000-site project have proven the scalability of autonomous agents at carrier-grade.[2]TelecomTV Editorial, “China Mobile Scales AI-Driven RAN Agents Across 400,000 Sites,” telecomtv.com Vendors now compete on providing pre-trained models and closed-loop workflows that can be activated without deep data-science skills, shortening time to value. Commercial success stories are accelerating budget reallocation from legacy key performance indicator dashboards to automated remediation platforms. The prevailing expectation is that software able to predict and prevent outages will underpin most new contracts signed after 2026.
Cloud-Native RAN Disaggregation Accelerates Data Visibility
Breaking the RAN into centralized, distributed, and radio units opens additional telemetry points that cloud-native analytics harness in real time. Solutions such as Nokia’s Autonomous Network Fabric and Infovista’s driverless field validation stream gigabit-per-second data streams into elastic, API-first backends.[3]Infovista Press Team, “Driverless Testing Enables Cloud-Native RAN Validation,” infovista.com Operators gain fine-grained visibility across multiple vendors, reduce lock-in, and can spin up new analytic functions without forklift upgrades. This architectural freedom is offset by the need to run dual assurance stacks while legacy systems are retired, yet most tier-1 carriers judge the benefits of flexibility and speed to outweigh transitional complexity.
Surge Of Private 5G Networks In Industry 4.0 Plants
Discrete manufacturers, mining operations, and container ports demand ultra-reliable low-latency links for autonomous vehicles and machine vision. Lech-Stahlwerke’s 5G-enabled steel mill reports 8 ms motion-control latency and 15% energy savings after overlaying VIAVI traffic probes on its campus network. In the United States, the University of Wisconsin-Milwaukee’s smart factory pilot maintained 480 Mbps throughput while predictive algorithms spotted impending robotic arm failures 18 hours earlier than manual checks. These outcomes spur system integrators to bundle site surveys, spectrum planning, and analytics dashboards as turnkey offers, widening addressable revenues beyond carrier capex.
Open RAN Automation And xApps-rApps Ecosystem Expansion
Open RAN separates control logic into near-real-time xApps and non-real-time rApps, letting operators combine best-of-breed analytics without swapping radio units. Demonstrations by Capgemini with Deutsche Telekom and commercial pilots at Verizon have verified multi-vendor interoperability.[4]Amdocs Newsroom, “Cognitive RAN Automation Platform Announced at MWC,” amdocs.com Independent software vendors are rushing to publish applications into emerging marketplaces hosted by RAN intelligent controller suppliers. Although standards continue to evolve, the promise of reduced proprietary lock-in and accelerated innovation is persuading operators in North America, Europe, and India to allocate test-bed budgets that scale into network-wide contracts after performance validation.
Restraints Impact Analysis*
| Restraint | (~) % Impact on CAGR Forecast | Geographic Relevance | Impact Timeline |
|---|---|---|---|
| Fragmented data standards across multi-vendor RAN | -1.8% | Global, acute in Open RAN | Medium term (2-4 years) |
| Skills gap in AI/ML model engineering for CSPs | -1.2% | North America, Europe, Asia-Pacific | Short term (≤2 years) |
| Cost and scalability hurdles for Open RAN in emerging markets | -0.9% | Asia, Africa, Latin America | Medium term (2-4 years) |
| Security and data-privacy concerns in network analytics | -0.6% | Global regulated sectors | Long term (≥4 years) |
| Source: Mordor Intelligence | |||
Fragmented data standards across multi-vendor RAN
Heterogeneous log formats impede the training of unified models, forcing operators to maintain custom parsers that raise integration costs. NETSCOUT’s 2024 AIOps survey lists inconsistent schemas as the top inhibitor of machine-learning rollouts, ahead of compute shortages and licensing fees. [2]NETSCOUT, “Solving the Data Challenge of Telecom AIOps,” netscout.com Indian carriers piloting multi-vendor Open RAN cite the need for third-party system integrators to normalize data as a major expense spike, often doubling project timelines. The O-RAN Alliance promotes common information models, but equipment makers still release proprietary counters for competitive edge, prolonging normalization efforts.
Skills gap in AI/ML model engineering for CSPs
Eightfold AI estimates that one-third of network engineering vacancies in 2025 require competencies such as Python, TensorFlow, and MLOps that most telecom veterans lack. Without in-house data scientists, carriers struggle to fine-tune algorithms for regional spectrum rules or climate conditions. European operators are therefore outsourcing model lifecycle management to vendors on revenue-sharing terms, inflating opex. University partnerships and reskilling initiatives are expanding, yet the talent pipeline will remain tight until 2027, limiting the pace of full-stack autonomy.
*Our forecasts treat driver/restraint impacts as directional, not additive. The impact forecasts reflect baseline growth, mix effects, and variable interactions.
Segment Analysis
By Component: Services Gain As Integration Complexity Rises
Platform software accounted for the bulk of 2025 revenue, yet rising multi-vendor complexity means services are climbing faster. Operators recognize that continuous model retraining and cross-domain correlation exceed routine network operations center competencies, so they purchase deployment, customization, and lifecycle management as outcome-based engagements. The RAN analytics and monitoring market size attributed to managed services is therefore expanding at a double-digit pace, while suppliers differentiate through libraries of pre-built use cases and service-level guarantees.
Services growth also reflects skills shortages in AI engineering and open-RAN orchestration. System integrators such as Capgemini and HCL Technologies are building 24/7 centers of excellence, and vendors bundle evergreen upgrades into subscriptions that convert capital outlays into predictable operating expenses. Because most tier-2 carriers and enterprise private-network owners lack specialist teams, service-led delivery will remain the preferred model through 2031, even as larger operators keep investing in proprietary software stacks.


By Deployment Mode: Cloud Migration Accelerates Amid Scalability Demands
Cloud-based implementations already hold a majority of deployments thanks to elasticity, pay-as-you-grow economics, and native integration with hyperscale AI toolchains. Streaming telemetry from tens of thousands of cell sites is better handled by horizontal auto-scaling than by fixed on-premises clusters. As a result, cloud platforms frequently demonstrate the lowest total cost of ownership when traffic spikes, firmware upgrades, or new spectrum bands multiply data volumes.
On-premises and hybrid models persist for latency-sensitive or sovereignty-constrained workloads. European carriers, for example, process personal-data-heavy analytics in private clouds to comply with the General Data Protection Regulation, while exporting non-identifiable training sets to public clouds for cheaper model iteration. Over the forecast horizon, the RAN analytics and monitoring market will continue shifting toward a cloud-first stance, but vendors able to unify edge, private, and public resources under a single policy framework will enjoy the widest adoption.
By Network Technology: 5G NR Overtakes Legacy As Stand-Alone Cores Proliferate
Legacy 4G still represents a significant share, yet 5G NR’s rapid CAGR means it will dominate new spending before the end of the decade. Stand-alone cores launched in 2025 unlock slice-aware quality-of-service monitoring and ultra-reliable low-latency support, both of which require fresh analytics modules. Energy-saving features such as traffic-adaptive sleep modes add further instrumentation points that legacy dashboards cannot visualize in real time.
Open and virtualized RAN architectures are rising from a small base and bring rich, standards-based telemetry. As suppliers expose beam-level metrics and scheduler events via open interfaces, analytics engines can apply fine-grained machine learning at the edge. The resulting improvements in spectral efficiency and power draw reinforce the business case for software-defined RAN, energizing related analytics demand in the latter half of the forecast period.

By Application: Energy Optimization Emerges As Fastest-Growing Use Case
Performance management remains indispensable, yet energy and capacity optimization are advancing fastest because electricity now accounts for a sizable share of network operating costs. ITU-T L.1510 requires operators to measure power, greenhouse gas, water, and waste at the site level, creating new compliance dashboards. Platforms that automatically dim transmit power or shut down idle carriers routinely cut consumption by double-digit percentages without degrading user experience, freeing budget for coverage expansion.
Fault management, mobility optimization, and slice assurance all benefit from converged data lakes that collapse formerly separate workflows into a single pane of glass. Suppliers respond by packaging modular analytics that operators can sequence according to return-on-investment priorities. As 5G densification raises interference risk, handover tuning and interference mitigation modules will also capture rising wallet share, but energy remains the headline driver of application spending growth.
By End User: Private Enterprise Networks Disrupt Tier-1 Operator Dominance
Tier-1 carriers still invest the largest absolute sums, yet enterprises are expanding most quickly as manufacturers, ports, and mining sites deploy dedicated 5G. Industrial buyers demand deterministic latency, campus-wide coverage, and integration with operational technology systems, forcing analytics vendors to adapt user interfaces and key performance indicators that differ from consumer-centric dashboards. Because many plants lack round-the-clock network personnel, solutions emphasize automation, prescriptive alerts, and one-click root-cause analysis.
Tower companies and neutral-host providers form an additional growth pocket. As these firms manage shared infrastructure for multiple tenants, they need near-real-time inventory accuracy and performance proofs to support service-level agreements. Consequently, the RAN analytics and monitoring market is seeing rising demand for inventory reconciliation, site-asset digital twins, and multi-operator quality-of-experience reporting spanning macro, small-cell, and in-building systems.
Geography Analysis
North America drives the largest share of spending thanks to aggressive mid-band spectrum roll-outs by Verizon, AT&T, and T-Mobile, and a pervasive move toward open RAN test beds. Early trials of multi-vendor RAN intelligent controllers have boosted confidence in standards-based telemetry, unlocking budgets for vendor-agnostic monitoring suites. Densification has also spilled into tower-company capital expenditure, cementing analytics demand across both carriers and infrastructure owners.
Europe combines regulatory support for open interfaces with stringent energy-efficiency directives, channeling investment into power analytics modules and cyber-secure, disaggregated architectures. Operators such as Deutsche Telekom and Vodafone are building internal digital twins to benchmark suppliers and comply with NIS2 requirements, ensuring steady procurement of cross-vendor correlation engines. Germany leads private-network uptake in automotive manufacturing, while the United Kingdom and France prioritize carbon-tracking dashboards to meet national sustainability targets.
Asia-Pacific posts the fastest CAGR as India’s greenfield 5G, China’s autonomous-agent deployments, and Southeast Asia’s virtualized RAN pilots scale concurrently. Projects such as China Mobile’s 400,000-site intelligent-agent deployment validate carrier-grade AI operations, encouraging regional peers to adopt similar frameworks. Japan’s push into software-defined RAN and Australia’s focus on rural coverage round out a highly diverse patchwork, yet all sub-regions converge on a playbook that values cloud elasticity, energy savings, and open-interface flexibility.

Competitive Landscape
Incumbent equipment vendors, Ericsson, Nokia, Huawei, ZTE, and Samsung, retain privileged access to baseband telemetry and ship analytics tightly integrated with their radios. Nonetheless, operator appetite for cross-domain visibility is creating space for pure-play specialists such as MYCOM OSI, Infovista, TEOCO, and Viavi Solutions, as well as hyperscale cloud entrants. Competition now pivots on AI accuracy, time to insight, and out-of-the-box workflow libraries rather than basic dashboarding.
Open RAN standards lower entry barriers, enabling start-ups to publish xApps and rApps without selling hardware. Platform plays from Qualcomm, NVIDIA, and ODC extend analytics toward embedded inference, converting base stations into sensor-rich edge compute nodes. Consolidation appears likely as carriers look to rationalize supplier lists, with larger providers acquiring niche AI innovators to enrich portfolios.
Overall, no single vendor controls more than 15% of global revenue. The combined share of the top five suppliers is roughly 45%, yielding a market concentration score of 6 and signaling moderate competition with room for both incumbents and challengers.
RAN Analytics and Monitoring Industry Leaders
Telefonaktiebolaget LM Ericsson
Nokia Corporation
Huawei Technologies Co., Ltd.
ZTE Corporation
Samsung Electronics Co., Ltd. (Network Business)
- *Disclaimer: Major Players sorted in no particular order

Recent Industry Developments
- April 2026: Telstra and Red Hat showcased an autonomous self-healing proof-of-concept for closed-loop RAN fault remediation.
- March 2026: Huawei and China Mobile completed the world’s first 400,000-site intelligent-agent deployment across eight provinces.
- March 2026: ODC released RANIQ, turning every base station into a programmable sensor and inference engine.
- March 2026: Qualcomm launched an agentic RAN Management Service with AI optimizers for commercial deployments.


Global RAN Analytics and Monitoring Market Report Scope
The RAN Analytics and Monitoring Market Report is Segmented by Component (Platform/Software, Services), Deployment Mode (On-Premises, Cloud-Based), Network Technology (2G/3G, 4G/LTE, and More), Application (Performance Management, Fault and Event Management, and More), End User (Tier-1 Mobile Network Operators, Mobile Virtual Network Operators, and More), and Geography. The Market Forecasts are Provided in Terms of Value (USD).
| Platform / Software |
| Services |
| On-premises |
| Cloud-based |
| 2G / 3G |
| 4G / LTE |
| 5G NR |
| Open RAN / vRAN |
| Performance Management |
| Fault and Event Management |
| Mobility and Handover Optimisation |
| Energy and Capacity Optimisation |
| Tier-1 Mobile Network Operators |
| Mobile Virtual Network Operators |
| Private Enterprise Networks |
| Neutral-Host / TowerCos |
| North America | United States | |
| Canada | ||
| Mexico | ||
| Europe | Germany | |
| United Kingdom | ||
| France | ||
| Russia | ||
| Rest of Europe | ||
| Asia-Pacific | China | |
| Japan | ||
| India | ||
| South Korea | ||
| Australia | ||
| Rest of Asia-Pacific | ||
| Middle East and Africa | Middle East | Saudi Arabia |
| United Arab Emirates | ||
| Rest of Middle East | ||
| Africa | South Africa | |
| Egypt | ||
| Rest of Africa | ||
| South America | Brazil | |
| Argentina | ||
| Rest of South America | ||
| By Component | Platform / Software | ||
| Services | |||
| By Deployment Mode | On-premises | ||
| Cloud-based | |||
| By Network Technology | 2G / 3G | ||
| 4G / LTE | |||
| 5G NR | |||
| Open RAN / vRAN | |||
| By Application | Performance Management | ||
| Fault and Event Management | |||
| Mobility and Handover Optimisation | |||
| Energy and Capacity Optimisation | |||
| By End User | Tier-1 Mobile Network Operators | ||
| Mobile Virtual Network Operators | |||
| Private Enterprise Networks | |||
| Neutral-Host / TowerCos | |||
| By Geography | North America | United States | |
| Canada | |||
| Mexico | |||
| Europe | Germany | ||
| United Kingdom | |||
| France | |||
| Russia | |||
| Rest of Europe | |||
| Asia-Pacific | China | ||
| Japan | |||
| India | |||
| South Korea | |||
| Australia | |||
| Rest of Asia-Pacific | |||
| Middle East and Africa | Middle East | Saudi Arabia | |
| United Arab Emirates | |||
| Rest of Middle East | |||
| Africa | South Africa | ||
| Egypt | |||
| Rest of Africa | |||
| South America | Brazil | ||
| Argentina | |||
| Rest of South America | |||


Key Questions Answered in the Report
What is the projected value of the RAN analytics and monitoring market in 2031?
The RAN analytics and monitoring market size is forecast to reach USD 2.11 billion by 2031.
Which region will grow the fastest through 2031?
Asia-Pacific is expected to post the highest 11.4% CAGR as India, China, and Southeast Asia ramp up 5G and autonomous RAN investments.
Why are services growing faster than platforms?
Integration complexity, multi-vendor environments, and AI skills shortages push operators toward managed analytics services that deliver turnkey outcomes.
Which application segment is expanding most quickly?
Energy and capacity optimization leads with a 12.7% CAGR because operators must meet new ITU-T environmental key performance indicators while controlling power costs.
How concentrated is the vendor landscape?
With the top five suppliers holding roughly 45% combined share, the market scores a 6 on a 1-10 concentration scale, indicating moderate competition.
What role do private 5G networks play in future demand?
Private enterprise deployments are the fastest-growing end-user group, expanding at a 12.5% CAGR as Industry 4.0 plants require deterministic connectivity and specialized analytics.
Page last updated on:


