United States Data Center Server Market Size and Share
Market Overview
| Study Period | 2020 - 2031 |
|---|---|
| Forecast Data Period | 2026 - 2031 |
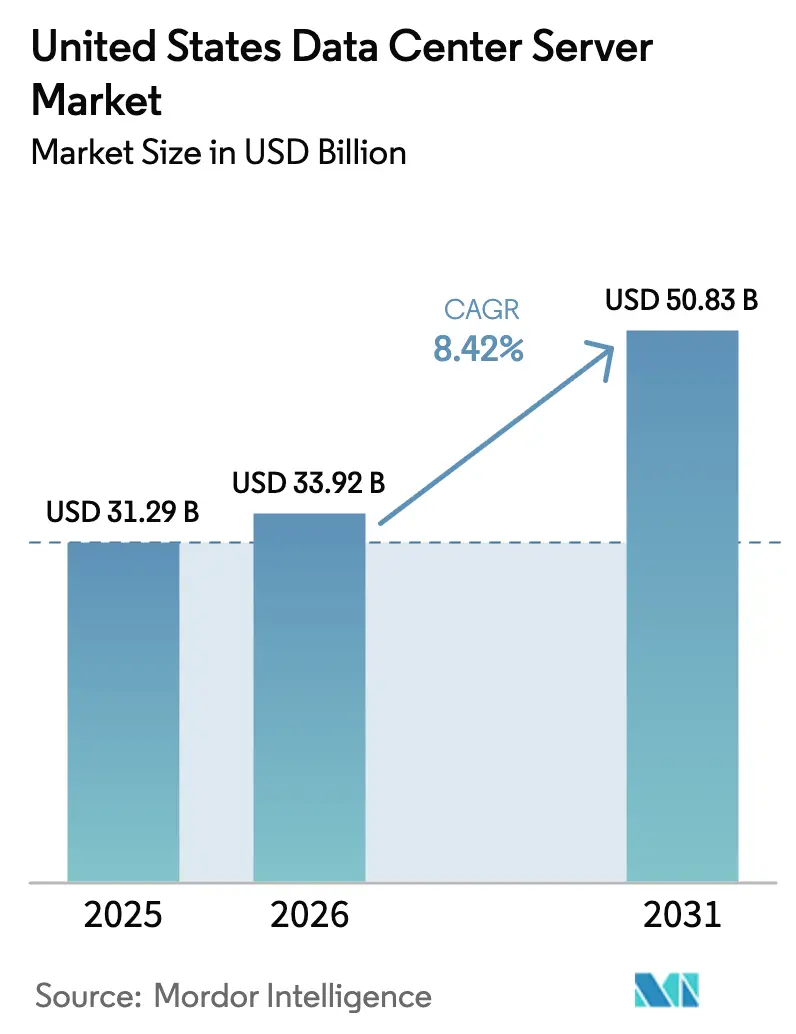
| Base Year Market Size (2025) | USD 31.29 Billion |
| Market Size (2026) | USD 33.92 Billion |
| Market Size (2031) | USD 50.83 Billion |
| Growth Rate (2026 - 2031) | 8.42% CAGR |
| Market Concentration | High |
Major Players *Disclaimer: Major Players sorted in no particular order Image © Mordor Intelligence. Reuse requires attribution under CC BY 4.0. | |
United States Data Center Server Market Analysis by Mordor Intelligence
The United States data center server market size in 2026 is estimated at USD 33.92 billion, growing from 2025 value of USD 31.29 billion with 2031 projections showing USD 50.83 billion, growing at 8.42% CAGR over 2026-2031. Server demand is benefiting from a synchronized hyperscaler capital-expenditure cycle, the rapid spread of enterprise AI workloads, and new federal incentives for on-shore semiconductor manufacturing. Hyperscalers alone disclosed USD 676 billion of fresh data-center investment intentions in January 2025, with AWS and Microsoft earmarking USD 100 billion and USD 80 billion, respectively, for United States build-outs. AI workload growth is redefining server refresh rates, cutting lifecycles from six to five years as firms pursue higher density and liquid-cool-ready racks. IBM's annual Cost of a Data Breach Report revealed that in 2024, the global average cost of a data breach hit USD 4.88 million. This surge comes as breaches become increasingly disruptive, further straining cyber teams. Notably, breach costs increased by 10% from the previous year, marking the steepest rise since the onset of the pandemic. Alarmingly, 70% of organizations that faced breaches acknowledged experiencing significant or very significant disruptions.
Key Report Takeaways
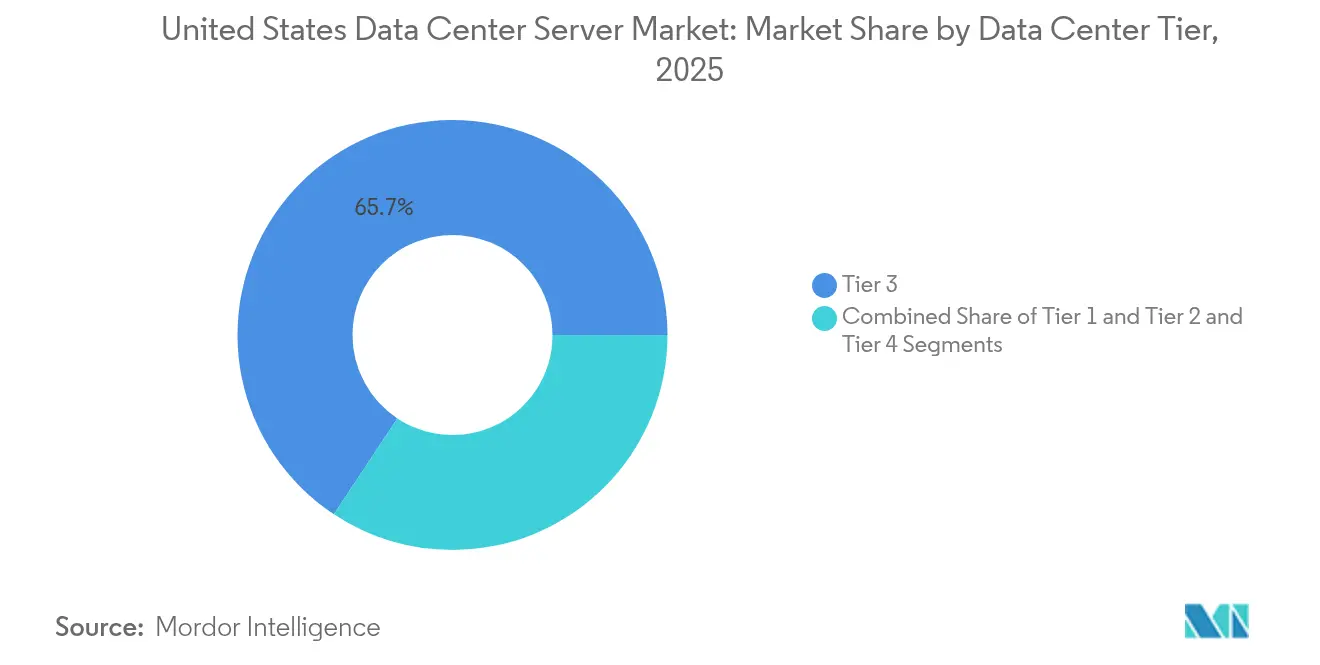
- By tier, Tier 3 facilities led the United States data center server market share with 65.70% in 2025, while Tier 4 is forecasted to grow at a 12.79% CAGR through 2031.
- By form factor, half-height blades held 48.54% share of the United States data center server market size in 2025; quarter-height micro-blades are advancing at 13.87% CAGR.
- By application, virtualization and private cloud retained a 37.92% share of the United States data center server market, and AI/ML workloads are expanding at a 15.81% CAGR.
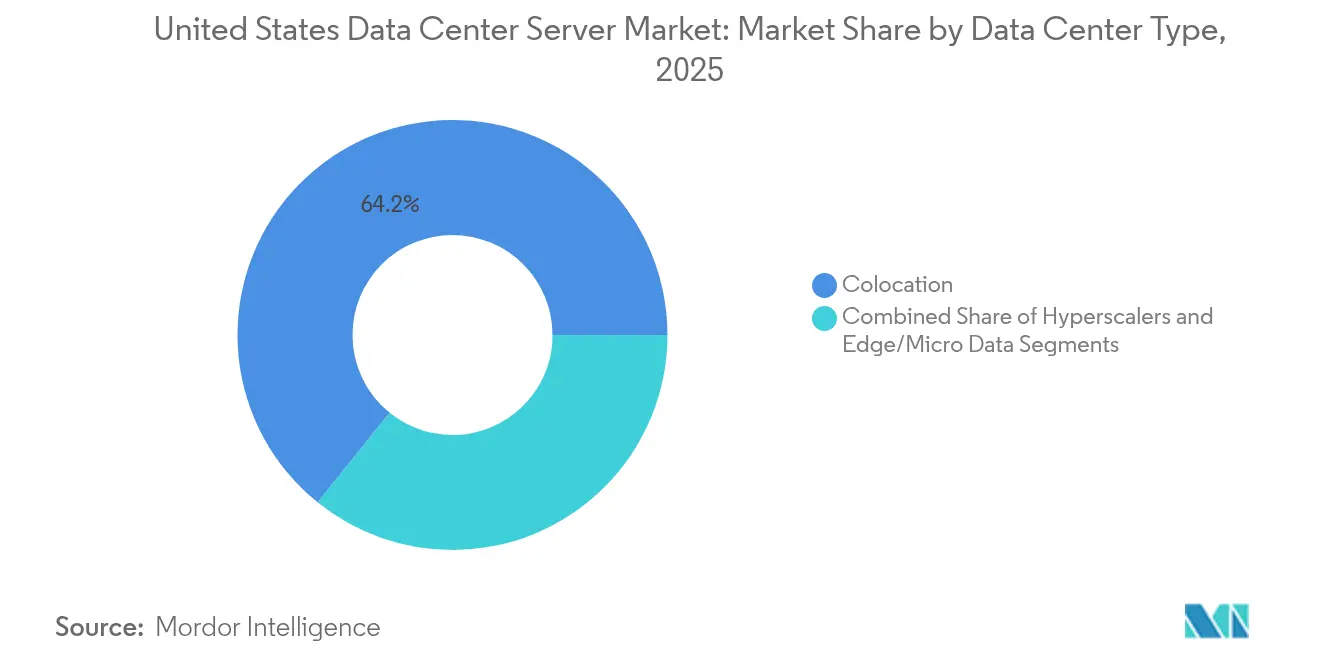
- By data center type, colocation captured 64.20% of the United States data center server market share in 2025, while hyperscaler deployments showed the fastest growth at 14.74% CAGR.
- By end-use industry, IT and telecom accounted for 25.93% of the United States data center server market revenue in 2025, as government and defense workloads are expected to accelerate at a 12.79% CAGR.
Note: Market size and forecast figures in this report are generated using Mordor Intelligence’s proprietary estimation framework, updated with the latest available data and insights as of 2026.
Figures recorded within United states feed into a worldwide estimate while studying the global industry. Mordor Intelligence's data center server market size captures this aggregation.
United States Data Center Server Market Trends and Insights
Drivers Impact Analysis*
| Driver | (~) % Impact on CAGR Forecast | Geographic Relevance | Impact Timeline |
|---|---|---|---|
| Rapid hyperscaler CAPEX cycle renewal | +2.3% | Global, concentrated in Virginia, Oregon, Texas | Medium term (2-4 years) |
| Enterprise AI/ML workload proliferation | +2.8% | National, with early gains in California, New York, Washington | Short term (≤ 2 years) |
| Edge-cloud convergence boosting micro-server demand | +1.4% | Asia Pacific core, spill-over to tier-2 US cities | Medium term (2-4 years) |
| Government incentives for domestic semiconductor/Server manufacturing | +1.2% | National, focused on Arizona, Ohio, Texas | Long term (≥ 4 years) |
| U.S. power-availability contracts favor liquid-cool-ready racks | +0.7% | Regional, concentrated in Pacific Northwest, Texas | Medium term (2-4 years) |
| Tier-2 city tax abatements attracting second-wave data-center builds | +0.6% | National, with early gains in Phoenix, Columbus, Austin | Medium term (2-4 years) |
| Source: Mordor Intelligence | |||
Rapid hyperscaler CAPEX cycle renewal
Amazon, Microsoft, Google, and Meta collectively plan to spend more than USD 320 billion on data centers in 2025, extending server replacement cycles to five years as firms pursue AI compute density. Amazon’s USD 100 billion allocation alone is estimated to add a USD 700 million operating-income drag due to accelerated depreciation, yet it shortens payback periods for advanced liquid-cooled racks. Federal agencies are mirroring the trend; sixteen Department of Energy sites have been fast-tracked for server-dense builds, with online availability expected by 2027, reinforcing demand peaks in Virginia and Oregon.[1]U.S. Department of Energy, “DOE Identifies 16 Sites for AI Data Centers,” Energy.gov, energy.gov
Enterprise AI/ML workload proliferation
Financial institutions cite an 84% concern among executives over catastrophic data loss if AI infrastructure falls short. Accuracy levels of only 21% in banking models spur investment in servers optimized for vector processing and larger memory footprints. Healthcare systems leverage AI for diagnostics and documentation, driving rack densities up to 50 kW. Manufacturing groups are adopting Industry 4.0 applications on edge nodes, combining 5G and micro-data center form factors. Lenovo’s ThinkSystem V4 platform achieves 2.5× rack density and 2.4× performance-per-watt gains, underscoring its efficiency goals.
Edge-cloud convergence boosting micro-server demand
Latency-sensitive services, ranging from interactive gaming to smart-factory analytics, are relocating compute resources near end users through transportable 20-foot micro facilities. Early rollouts in Austin, Tampa, and Raleigh show hyperscalers leasing edge racks to improve content delivery. Dallas has become a Local Zone hub as Verizon deploys 5G Edge on AWS Wavelength. Compact quarter-height blades, liquid cooling, and modular enclosures together define preferred architectures for these distributed sites.
Government incentives for domestic semiconductor manufacturing
CHIPS-Act grants of USD 6.6 billion to TSMC, plus associated state-level tax credits, underpin USD 65 billion of foundry builds in Phoenix. Target output includes advanced AI accelerator dies and server CPUs. Intel collaborates with AWS on custom silicon while Micron lines up HBM production aligned to domestic fabs. Policymakers aim to have 20% of leading-edge nodes onshore by 2030, reducing reliance on Asian supply chains and stabilizing server bill-of-material costs.
Restraints Impact Analysis*
| Restraint | (~) % Impact on CAGR Forecast | Geographic Relevance | Impact Timeline |
|---|---|---|---|
| Rising frequency and cost of cyber-intrusions | -1.8% | Global | Short term (≤ 2 years) |
| Supply-chain volatility for key silicon (HBM, GPUs) | -2.1% | Global, with acute impact on US hyperscalers | Short term (≤ 2 years) |
| Grid-interconnection delays exceeding 24 months in PJM and MISO | -1.3% | PJM and MISO regions (Mid-Atlantic, Midwest) | Medium term (2-4 years) |
| New EPA ENERGY STAR v4 idle-power caps constraining legacy refresh | -0.4% | National | Long term (≥ 4 years) |
| Source: Mordor Intelligence | |||
Rising frequency and cost of cyber-intrusions
Average breach costs of USD 5.56 million in 2024, combined with downtime expenses exceeding USD 100,000 per event, elevate the total cost of ownership. Forty-two percent of banks have migrated AI workloads away from public clouds due to security concerns, prompting on-premises build-outs that lengthen procurement cycles and increase CapEx. Ransomware events, such as CloudNordic’s total customer data loss, illustrate worst-case scenarios compelling wider adoption of zero-trust architectures and biometric access controls.
Supply-chain volatility for key silicon (HBM, GPUs)
Extended twelve-month lead times for HBM stacks and a TSMC CoWoS packaging bottleneck hinder AI server shipments. SK Hynix export volumes fell 30% sequentially in January 2025, and proposed tariffs threaten to lift component costs by up to 30%. NVIDIA still holds 98% of data-center GPU shipments, making the ecosystem highly sensitive to its production cadence.
*Our forecasts treat driver/restraint impacts as directional, not additive. The impact forecasts reflect baseline growth, mix effects, and variable interactions.
Segment Analysis
By Data-Center Tier: Fault-tolerant builds accelerate Tier 4 adoption
Tier 3 installations delivered 65.70% of revenue in 2025, anchoring the United States data center server market. Tier 4, though smaller, is projected to rise at 12.79% CAGR as hyperscalers assign AI training clusters to fully fault-tolerant halls where a single outage can cost over USD 100,000. The United States data center server market size contribution from Tier 4 is projected to grow steeply between 2026 and 2031. Federal programs that earmark sixteen sites for AI-ready builds favor Tier 4 specifications, given 50 kW-per-rack power densities anticipated by 2027.
Tier 1 and Tier 2 designs remain relevant for distributed edge nodes prioritizing cost efficiency over maximum redundancy. Financial-services migration toward Tier 4 also stems from stricter compliance and rising breach penalties. Altogether, the resilience imperative cements Tier 4 as the fastest-moving slice, reshaping colocation upgrade roadmaps and guiding liquid-cooling retrofits.


By Form Factor: Micro-blade innovation squeezes half-height share
Half-height blades retained 48.54% market share in 2025 on the strength of virtualization workloads. Yet quarter-height micro-blades are climbing at 13.87% CAGR as operators compress racks into 20-foot edge modules. The United States data center server market size for micro-blade deployments is thus on an upward trajectory through 2031. EdgeMicro’s city-center installs and manufacturing-sector Industry 4.0 pilots highlight the swing toward compact, energy-efficient hardware.
Full-height blades continue serving HPC clusters, but power-per-rack limits increasingly favor micro-blades paired with direct-to-chip liquid cooling. Hyperscalers are selectively adopting micro-blade platforms for AI inference nodes, balancing density against memory bandwidth needs.
By Application/Workload: AI/ML surges beyond legacy virtualization
Virtualization and private cloud maintained 37.92% share in 2025, anchoring the United States data center server market. AI/ML workloads, however, are forecast to expand 15.81% CAGR, pulling compute toward GPU-heavy nodes and high-bandwidth memory stacks. This shift underpins Dell’s USD 12.1 billion AI server backlog and amplifies demand for rack-scale liquid cooling.
High-performance computing persists for scientific projects, whereas storage-centric topologies absorb the data deluge from AI training. Healthcare’s adoption of inference engines for imaging and patient engagement drives specialized server procurement, and manufacturing brings low-latency edge AI to plant floors.
By Data-Center Type: Hyperscaler build-outs challenge colocation primacy
Colocation providers commanded 64.20% revenue in 2025, yet hyperscaler self-builds are running at 14.74% CAGR as integrated power, network, and cooling designs promise lower unit costs for AI. The United States data center server market share advantage enjoyed by colocation players is therefore narrowing over the forecast horizon. Meta, Google, and Amazon together target more than USD 240 billion in near-term investment, embedding liquid-cooled racks and direct-chip cold plates.
Colocation firms respond with AI-ready pods and renewable-energy PPAs. Flexential reports that 51% of enterprises still place edge workloads in colocation sites, signaling continued relevance for hybrid deployments even as hyperscalers stretch campus footprints.
By End-Use Industry: Government emergence narrows IT/telecom lead
IT and telecom sectors remained the largest buyer group at 25.93% in 2025, but government and defense workloads are growing 12.79% CAGR as federal AI initiatives roll out. The United States data center server industry is therefore seeing procurement diversification that balances commercial and public-sector demand. Department-of-Energy construction plans and AI export-control frameworks guide secure, high-density server specifications.
Financial-services firms report heightened risk concerns, pushing some AI compute onto private racks with enhanced encryption. Healthcare and manufacturing extend edge-server adoption for compliance and predictive-maintenance gains, respectively, broadening the customer mix.
Geography Analysis
Virginia, Oregon, and Texas together form the primary geographic core of the United States data center server market, thanks to competitive power prices, established fiber routes, and hyperscaler zoning incentives. Virginia’s proximity to federal agencies feeds low-latency workloads, whereas Oregon leverages hydroelectric resources and cool ambient temperatures to cut PUE scores. Texas draws development through deregulated energy markets and abundant land, anchoring mega-campus projects from AWS and Microsoft.
Secondary hubs are scaling quickly. Phoenix offers a dry climate and favorable property-tax abatements, while Columbus benefits from centrality to national backbones. Austin marries an expanding tech workforce with airport proximity for supply-chain efficiency. EdgeMicro’s Austin, Tampa, and Raleigh deployments confirm rising investment in tier-2 metros.
Interconnection delays in PJM and MISO pose regional headwinds, with queue times topping 24 months and capacity-auction costs hitting USD 14.7 billion. The NERC 2024 assessment projects 15% summer and 18% winter peak-load increases over the decade, underscoring grid modernization needs. California’s server energy-efficiency mandates add compliance layers but also steer buyers toward lower-idle-power nodes, aiding national sustainability targets.
Mordor Intelligence evaluates the data center server market across all key regional markets, including Americas, Middle East, and Africa, with deeper country-level insights covering Chile, Canada, Saudi Arabia, Nigeria, China, and South Korea.
Competitive Landscape
Competition in the United States data center server market is intensifying amid AI-driven demand spikes. Dell Technologies leads shipment revenue, posting USD 6.3 billion in Q1 FY26, and a record USD 12.1 billion AI backlog. Hewlett Packard Enterprise follows with 12.8% server-segment growth in 2024, leveraging its GreenLake platform for hybrid cloud uptake. AMD’s USD 3.9 billion Q4 2024 data-center revenue moved its CPU share past Intel to 27.2% in early 2025, signaling a reshuffled x86 hierarchy.[3]Tom’s Hardware staff, “AMD Overtakes Intel in Data-Center CPU Revenue,” Tomshardware, tomshardware.com
Partnerships are redrawing the field. AMD and Intel formed an advisory consortium to optimize x86 platform compatibility, while Qualcomm re-entered the server CPU arena via a tie-up with NVIDIA. NVIDIA’s Blackwell ecosystem aligns with ASRock Rack and GIGABYTE to seed AI-factory-grade systems. Super Micro Computer advances rack-scale liquid-cooled offerings, and Chemours partners with DataVolt on fluorinated dielectric fluids to manage 50 kW-per-rack heat loads.
Hyperscalers influence supplier roadmaps by locking multi-year deals for AI accelerator volumes, intensifying competition around delivery lead-times and energy-efficiency metrics. Component makers that secure domestic CHIPS-Act funding gain preferred-supplier status, while the broader vendor pool accelerates liquid-cool-ready designs to preserve relevance in high-density aisles.
United States Data Center Server Industry Leaders
Dell Technologies Inc.
Hewlett Packard Enterprise Company
Lenovo Group Limited
International Business Machines Corporation
Cisco Systems, Inc.
- *Disclaimer: Major Players sorted in no particular order


Recent Industry Developments
- May 2025: Dell recorded USD 6.3 billion in server revenue in Q1 FY26 and secured USD 12.1 billion in AI server orders.
- May 2025: Qualcomm partnered with NVIDIA to co-design server CPUs, signalling its return to the market.
- April 2025: The U.S. Department of Energy named sixteen federal sites for AI-ready data centers, targeting a 2027 go-live.
- January 2025: Amazon announced a USD 100 billion 2025 capital-expenditure plan for AWS builds, a 20% rise from 2024, and shortened server lifecycles to five years.
- January 2025: Microsoft committed USD 80 billion to AI-oriented United States data center projects, while Meta disclosed USD 65 billion in spending intentions.
- January 2025: AMD closed the USD 4.9 billion acquisition of ZT Systems, solidifying its server AI capabilities and reporting 69% year-over-year growth in data-center revenue.


Research Methodology Framework and Report Scope
Market Definitions and Key Coverage
Our study defines the United States data-center server market as revenue generated from new, factory-built x86 and ARM rack, blade, and density-optimized servers that are installed in purpose-built colocation, hyperscale, and enterprise data-center facilities across the fifty states. Servers deployed in corporate wiring closets or rolling stock, as well as refurbished or leased equipment, are excluded from the scope.
Scope Exclusion: Edge micro-nodes integrated in telecom street cabinets, point-of-sale kiosks, and ruggedized field enclosures lie outside this assessment.
Segmentation Overview
- By Data-Center Tier
- Tier 1 and 2
- Tier 3
- Tier 4
- By Form Factor
- Half-height Blades
- Full-height Blades
- Quarter-height / Micro-blades
- By Application / Workload
- Virtualisation and Private Cloud
- High-Performance Computing (HPC)
- Artificial Intelligence/Machine Learning and Data Analytics
- Storage-centric
- Edge / IoT Gateways
- By Data Center Type
- Hyperscalers/Cloud Service Provider
- Colocation Facilities
- Enterprise and Edge
- By End-use Industry
- BFSI
- IT and Telecom
- Healthcare and Life-Sciences
- Manufacturing and Industry 4.0
- Energy and Utilities
- Government and Defence
Detailed Research Methodology and Data Validation
Primary Research
Mordor analysts interviewed data-center design engineers, OEM product managers, and colocation procurement heads across the Midwest, South Atlantic, and Pacific hubs. The conversations helped verify average selling price bands, liquid-cooling adoption rates, and the speed at which AI workloads shorten server life cycles, ensuring assumptions mirrored on-ground decisions.
Desk Research
We initiated our desk review with public datasets from the U.S. International Trade Commission, Energy Information Administration, and Bureau of Labor Statistics, which reveal import values, power draw, and employment trends linked to server deployments. Trade associations such as the Open Compute Project and the Information Technology Industry Council provided shipment design norms, while NSF patent abstracts clarified upcoming board designs. Company 10-Ks, hyperscaler capital-expenditure filings, and press releases, accessed through D&B Hoovers and Dow Jones Factiva, supplied pricing brackets and refresh cadence clues. This list is illustrative, not exhaustive; many additional records informed the evidence base.
Market-Sizing & Forecasting
A top-down model starts with national rack additions reconstructed from utility-reported megawatt hookups, which are then multiplied by verified rack density and server-per-rack ratios. Select bottom-up checks, supplier roll-ups and sampled ASP x volume, align the totals. Key variables include hyperscaler CAPEX outlay, average rack power density, AI accelerator attach rates, Tier 3-4 floor space completions, and historical ASP erosion; each was trended, stress-tested, and fed into an ARIMA-based multivariate regression to forecast 2025-2030 values. When bottom-up tallies diverged beyond two percentage points, gap-handling adjusted either density or ASP, never simultaneously, to preserve traceability.
Data Validation & Update Cycle
Outputs face variance checks against import statistics, utility energy sales, and OEM earnings before a senior reviewer signs off. Reports refresh every twelve months, with mid-cycle revisions triggered by >=10% swings in quarterly server shipments or material regulatory shifts.
Why Our United States Data Center Server Baseline Earns Buyers' Trust
Published figures often vary because studies mix regional scopes, lump non-data-center servers, or extrapolate one-off deal prices. By anchoring on facility-verified power data and separating blade, rack, and density-optimized formats, Mordor prevents overlap and double counting.
Benchmark comparison
| Market Size | Anonymized source | Primary gap driver |
|---|---|---|
| USD 31.29 B (2025) | Mordor Intelligence | |
| USD 21.50 B (2024) | Regional Consultancy A | Covers all of North America, not U.S. alone, diluting per-country precision |
| USD 24.24 B (2024) | Trade Journal B | Tracks only server-rack hardware, excluding CPU and memory revenue |
| USD 59.51 B (2024) | Global Consultancy C | Combines enterprise, edge, and data-center servers, inflating total |
In summary, our disciplined scope, cross-validated variables, and annual refresh cadence give decision-makers a balanced, transparent baseline they can replicate with publicly available inputs.


Key Questions Answered in the Report
What is the current value of the United States data center server market?
The market stands at USD 33.92 billion in 2026 and is forecast to reach USD 50.83 billion by 2031.
Which server application is growing the fastest?
AI and machine-learning workloads show the highest growth at a 15.81% CAGR through 2031.
Why are Tier 4 data centers gaining popularity?
Hyperscalers require fault-tolerant environments for AI training clusters, pushing Tier 4 demand to a 12.79% CAGR through 2031.
How are supply-chain shortages affecting deployment timelines?
Lead times for high-bandwidth memory and GPUs now stretch to twelve months, delaying AI server installations.
Which regions are attracting new data-center investments beyond traditional hubs?
Phoenix, Columbus, and Austin are emerging as preferred tier-2 locations due to land availability, power pricing, and tax incentives.
Page last updated on:


