North America Data Center Server Market Size and Share
Market Overview
| Study Period | 2020 - 2031 |
|---|---|
| Forecast Data Period | 2026 - 2031 |
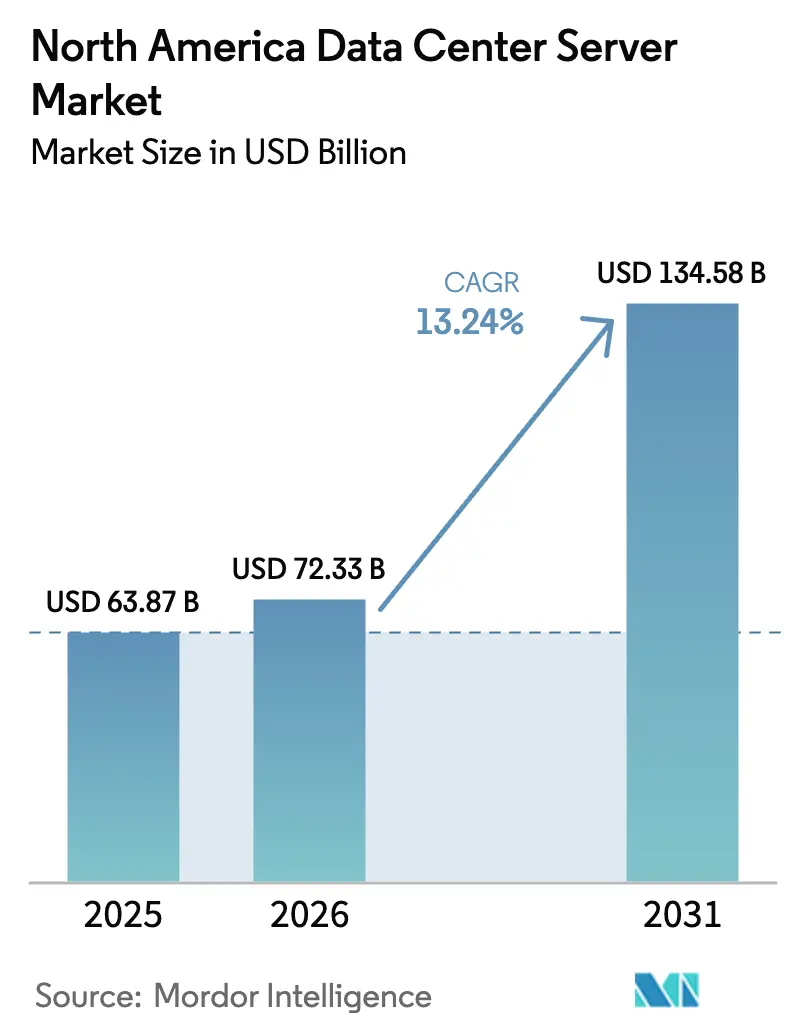
| Base Year Market Size (2025) | USD 63.87 Billion |
| Market Size (2026) | USD 72.33 Billion |
| Market Size (2031) | USD 134.58 Billion |
| Growth Rate (2026 - 2031) | 13.24% CAGR |
| Market Concentration | Medium |
Major Players *Disclaimer: Major Players sorted in no particular order Image © Mordor Intelligence. Reuse requires attribution under CC BY 4.0. | |
North America Data Center Server Market Analysis by Mordor Intelligence
The North America data center server market size is expected to grow from USD 63.87 billion in 2025 to USD 72.33 billion in 2026 and is forecast to reach USD 134.58 billion by 2031 at 13.24% CAGR over 2026-2031. Expanding artificial-intelligence deployments, heightened network traffic and stricter data-sovereignty rules are reshaping procurement strategies as organizations modernize legacy facilities to manage power densities exceeding 100 kW per rack. Server suppliers now compete on liquid-cooling efficiency, GPU density and rapid configuration lead times rather than raw processor speed. In parallel, escalating nearshoring in Mexico and sovereign-cloud mandates in Canada are redirecting capital toward secondary metros that still offer power headroom. Colocation vendors, cloud hyperscalers and edge specialists are each scaling capacity faster than traditional enterprise data centers, tightening competition across the value chain.
Key Report Takeaways
- By application, artificial intelligence and machine learning held 38.84% of the North America data center server market share in 2025, while virtualization and private-cloud workloads are projected to record a 17.02% CAGR through 2031.
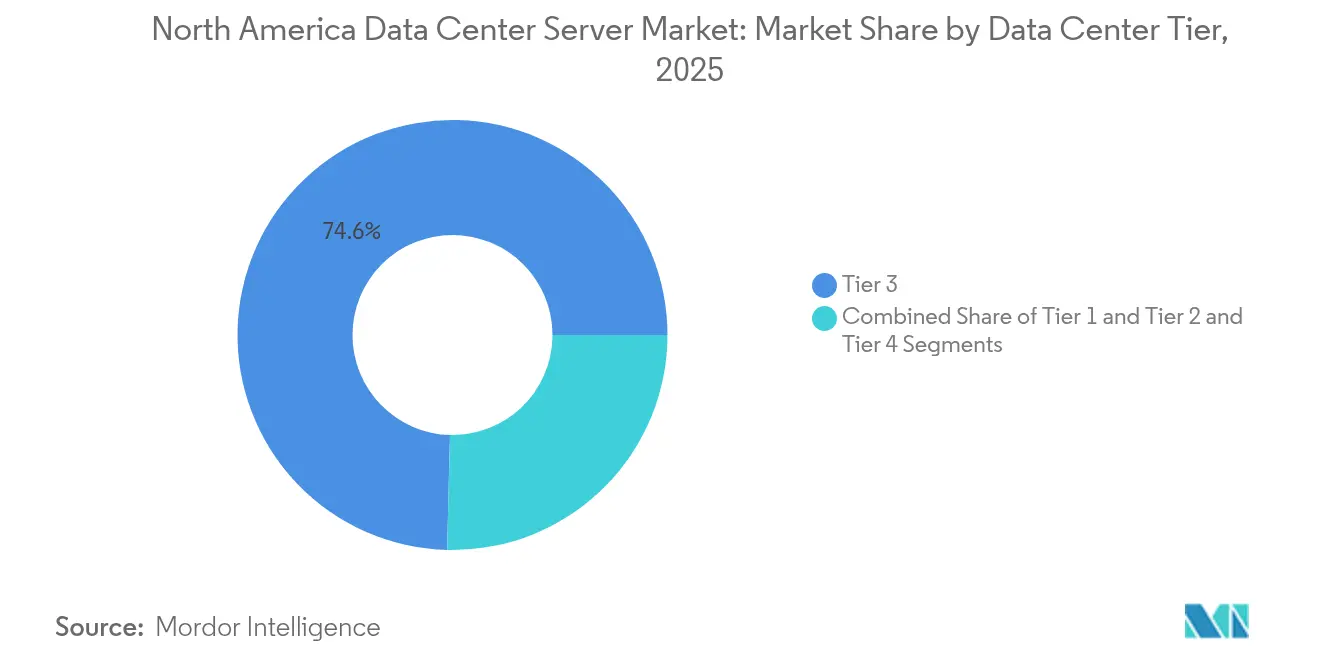
- By data-center tier, Tier 3 facilities led with 74.60% revenue share in 2025; Tier 4 is poised to expand at 18.56% CAGR to 2031 as hyperscalers demand fault-tolerant GPU clusters.
- By form factor, half-height blades accounted for 61.55% of the North America data center server market size in 2025, whereas quarter-height and micro-blades are forecast to grow at 17.92% CAGR edgeir.
- By data-center type, colocation operators captured 57.70% of the North America data center server market share in 2025; hyperscaler facilities are on track for a 20.64% CAGR through 2031.
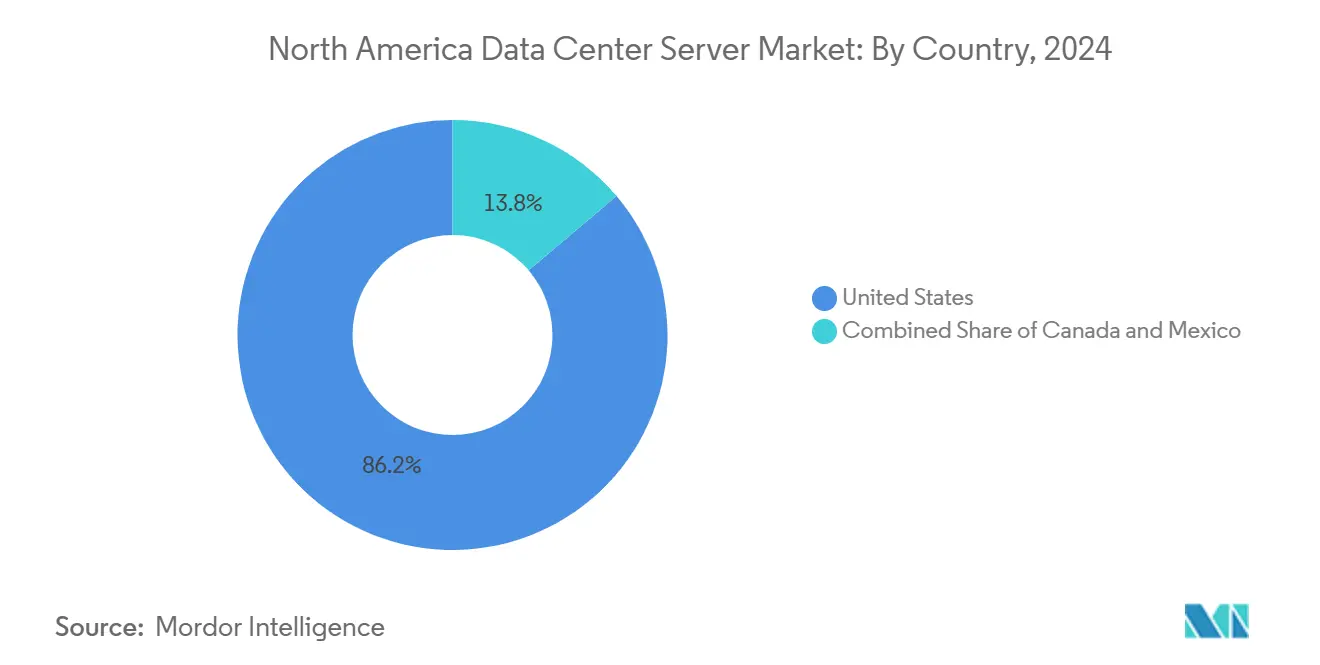
- By geography, the United States led with an 85.80% share in 2025, while Canada is projected to post a 19.05% CAGR to 2031 on the back of CAD 240 million in AI-focused data-center funding.
- By end-use industry, IT & Telecom commanded 34.58% of 2025 revenue; manufacturing and Industry 4.0 workloads are anticipated to expand 18.05% CAGR through 2031.
Note: Market size and forecast figures in this report are generated using Mordor Intelligence’s proprietary estimation framework, updated with the latest available data and insights as of 2026.
North america forms part of a network that extends across regions, each contributing to a shared international environment. The global data center server market outlook by Mordor Intelligence consolidates those connections.
North America Data Center Server Market Trends and Insights
Drivers Impact Analysis*
| Driver | (~) % Impact on CAGR Forecast | Geographic Relevance | Impact Timeline |
|---|---|---|---|
| AI/ML training demand for GPU-dense servers | +4.2% | United States, Canada | Short term (≤ 2 years) |
| Commercial 5G roll-outs driving edge build-outs | +2.1% | North America, Mexico border regions | Medium term (2-4 years) |
| Rising adoption of cloud and IoT workloads | +2.8% | US metros | Medium term (2-4 years) |
| Data-sovereignty mandates in Canada and Mexico | +1.9% | Canada, Mexico | Long term (≥ 4 years) |
| Evergreen hardware refresh cycles | +1.5% | North America enterprise | Long term (≥ 4 years) |
| On-prem sovereign-cloud designs for US public sector | +1.1% | United States | Medium term (2-4 years) |
| Source: Mordor Intelligence | |||
AI/ML Training Demand for GPU-Dense Servers
Artificial-intelligence workloads already consume up to one-fifth of data-center electricity, forcing operators to revamp racks for extreme densities and liquid cooling coresite. NVIDIA’s US 1.4 trillion data-center opportunity projection has accelerated procurement of specialized servers that can host as many as eight GPUs per chassis. Super Micro’s 100,000-GPU liquid-cooled cluster illustrates the market’s pivot toward direct-cooling architectures. HPE’s USD 1 billion order from X signals that large private buyers now rival hyperscalers on single-deal size. These shifts cement high-density AI racks as the primary growth engine for the North America data center server market.
Commercial 5G Roll-outs Driving Edge Build-outs
Ultra-low-latency 5G services are steering compute away from core campuses toward metropolitan edge sites that sit within a one-digit-millisecond round-trip of end users.[1]EdgeIR, “5G Edge AI Rollout Gains Pace,” edgeir.com GPU-as-a-service launches inside micro-colo hubs such as Cologix Toronto provide proof that AI inference will increasingly reside at the edge. Server OEMs have responded by releasing quarter-height and other micro-blade designs tuned for shallow racks and constrained footprints. This distributed topology unlocks new revenue for regional fiber operators and municipal utilities that can guarantee clean power and right-of-way permits. The trend sustains a double-digit expansion streak for edge systems within the broader North America data center server market.
Rising Adoption of Cloud and IoT Workloads
Enterprise architects are rationalizing workload placement across multicloud, on-prem and colocation assets to optimize cost and compliance. Dell’s AI Factory portfolio, which couples servers, storage and networking for hybrid deployment, exemplifies the converged-infrastructure shift. IoT sensor proliferation in logistics and energy adds torrents of time-series data that must be filtered near source to reduce backhaul cost. HPE’s Private Cloud AI bundles show how traditional virtualization stacks now ship with GPU options to cover inferencing tasks inside the same chassis hpe. As organizations right-size their estates, virtualization retains momentum, further widening the addressable base for the North America data center server market.
Data-Sovereignty Mandates in Canada and Mexico
Government rules that citizen data stay on local soil have triggered a building boom north and south of the US border. Eighty-eight percent of Canadian IT leaders insist on domestic hosting, prompting OVHcloud and hyperscalers alike to add capacity in Ontario. Mexico’s nearshoring wave is pushing US manufacturers to process cross-border data inside newly commissioned Queretaro campuses so that both NAFTA and local privacy rules are met. These mandates lengthen contract tenures and raise switching costs, fortifying recurring revenue for operators that satisfy local compliance. Over the long term, sovereignty laws will continue to enlarge the North America data center server market footprint beyond traditional US cores.
Restraints Impact Analysis*
| Restraint | (~) % Impact on CAGR Forecast | Geographic Relevance | Impact Timeline |
|---|---|---|---|
| Escalating data-center CapEx and land costs | -2.3% | US metros, Toronto | Short term (≤ 2 years) |
| Supply-chain volatility for custom silicon | -1.8% | North America | Medium term (2-4 years) |
| Grid-power constraints in key metros | -2.1% | Northern Virginia, Dallas, Silicon Valley | Short term (≤ 2 years) |
| Sustainability / Scope-3 emissions compliance | -1.2% | Corporate mandates | Long term (≥ 4 years) |
| Source: Mordor Intelligence | |||
Escalating Data-Center CapEx and Land Costs
Speculative real-estate bidding in Loudoun County and Santa Clara has doubled parcel prices within 18 months, inflating greenfield project budgets well above earlier pro-formas.[2]Quartz, “Data-Center Land Prices Signal Bubble,” qz.com Build costs rise further when liquid-cooling loops and high-amp busways required by AI servers are included. Microsoft and Amazon have slowed several planned sites, choosing to redeploy capital to secondary regions with cheaper acreage while demand remains intact. Locked-in land premiums cascade through lease rates, potentially delaying smaller entrants’ expansion. Unless permitting fast-tracks or rezoning unlocks fresh parcels, the North America data center server market could experience periodic supply gaps.
Grid-Power Constraints in Key Metros
Utilities in Northern Virginia now face transformer lead times surpassing 150 weeks, holding up energization of pre-leased halls that are otherwise construction-ready.[3]T&D World, “Transformer Shortage Challenges Grid,” tdworld.com Analysts forecast AI data centers could consume up to 12% of US electricity by 2028, a tripling from 2024 levels qz. Southwest providers NV Energy and APS have logged connection requests topping 10 GW, rivaling entire state loads. Power scarcity steers investors toward hydro-rich provinces or Midwest wind corridors, altering historical clustering patterns. Persistent grid headwinds temper short-term capacity expansions for the North America data center server market.
*Our forecasts treat driver/restraint impacts as directional, not additive. The impact forecasts reflect baseline growth, mix effects, and variable interactions.
Segment Analysis
By Data-Center Tier: Balanced Tier 3 Dominance and Tier 4 Momentum
Tier 3 facilities captured 74.60% of 2025 revenue in the North America data center server market, underscoring their appeal for enterprise workloads requiring N+1 resilience without the premium of 2N architectures. Tier 3 build specifications satisfy most virtualization, backup and cloud-gateway tasks while retaining favorable operating economics. Yet hyperscalers training multi-trillion-parameter models now prize Tier 4 environments where concurrent maintenance and fault tolerance are mandatory for uninterrupted GPU clusters that cost tens of millions of USD. As a result, Tier 4 revenue is projected to rise 18.56% CAGR through 2031, gradually lifting its North America data center server market size contribution.
The Tier 4 surge has spurred innovations in modular data halls pre-configured with lithium-ion UPS, rear-door heat exchangers and redundant spine-leaf fabrics. Vendors such as Vertiv recently introduced factory-integrated “360AI” blocks that shorten deployment to under 26 weeks, shaving months off customary greenfield schedules. Meanwhile, Tier 1 and Tier 2 camps remain useful for content caching, local manufacturing execution systems and other edge roles. Over the forecast window, the coexistence of multiple tiers improves workload placement flexibility, sustaining diverse revenue streams inside the North America data center server market.


By Form Factor: Half-Height Stability and Micro-Blade Acceleration
Half-height blades held a commanding 61.55% share in 2025 as enterprises continue to favor familiar 42-U racks that balance compute density with airflow requirements. The design supports two-socket x86 boards paired with modest power budgets, keeping cooling retrofits minimal. However, the North America data center server market size for micro-blade and quarter-height systems is projected to grow fastest at 17.92% CAGR, propelled by the edge build-out associated with IoT and 5G workloads.
Quarter-height frames can slip into telco street cabinets or factory closets where space and weight are constrained. Advancements in system-on-chip architecture and PCIe Gen5 have allowed vendors to embed AI accelerators onto these compact sleds, making them useful for real-time inference. Full-height blades continue to serve HPC and oil-and-gas seismic imaging, yet their marginal growth underscores a pivot toward smaller, power-efficient nodes. The net effect is an expanding portfolio that lets operators mix dense AI training racks at the core with lightweight micro-blades in metro rings, enriching the overall value proposition of the North America data center server market.
By Application/Workload: AI/ML Ascendancy and Hybrid Virtualization Growth
Artificial-intelligence and machine-learning tasks accounted for 38.84% revenue in 2025, cementing the segment as the single largest within the North America data center server market. Generative models, recommendation engines and autonomous-vehicle simulations require tightly coupled GPU fabrics and ultra-fast NVMe storage, pushing power envelopes to unprecedented levels. Suppliers that can guarantee direct-liquid-cool ready chassis and out-of-band telemetry for thermal optimization increasingly win large blocks of business.
Virtualization and private cloud services, while more mature, are forecast to post a robust 17.02% CAGR through 2031 as firms rationalize SaaS spend and bring steady-state workloads back on-prem. This migration aligns with data-sovereignty rules and helps reduce egress fees. High-performance computing retains a niche among life-sciences and energy majors but benefits indirectly when AI-adjacent simulation workflows grow. Storage-centric and edge-gateway tasks round out the mix, ensuring that product managers must support a spectrum of I/O profiles if they aim to capture wallet share within the North America data center server market.
By Data-Center Type: Colocation Leadership and Hyperscaler Surge
Colocation operators supplied 57.70% of North America data center server market share in 2025, leveraging interconnection ecosystems and pay-as-you-grow models that appeal to mid-market enterprises. Providers such as CoreSite now advertise NVIDIA DGX-Ready suites with 70 kW per rack and chilled-door heat rejection, proving that shared facilities can meet AI demands previously reserved for owner-operated campuses. Flexible lease terms also help tenants hedge against fast-moving GPU roadmaps.
Hyperscalers, on the other hand, are scaling physical footprints at 20.64% CAGR as Microsoft, Google and Meta each pledge multi-billion-dollar annual capital outlays. Their proprietary network fabrics and custom silicon designs intensify vertical integration, although many still sub-lease capacity inside carrier-neutral mega-halls during construction. Edge and enterprise self-builds continue to fulfill ultra-low-latency or compliance-led workloads. From a strategic standpoint, the coexistence of multiple facility archetypes expands the addressable North America data center server market size and cushions operators against single-segment volatility.

By End-Use Industry: IT and Telecom Core and Manufacturing Upswing
The IT and Telecom vertical consumed 34.58% of servers shipped in 2025, reflecting its historical role as a first adopter of new processor generations and higher-speed interconnects. Telecom carriers are upgrading central offices into mini-data centers to deliver 5G-enabled edge computing, while SaaS providers are expanding colocation racks to control latency. Because these workloads are evergreen, the segment remains foundational to the North America data center server market.
Manufacturing and Industry 4.0 is projected to be the fastest-growing sector at an 18.05% CAGR, driven by computer-vision quality control and predictive maintenance systems embedded on factory floors. GPU-equipped micro-nodes crunch telemetry streams locally before archiving to core clouds, reducing downtime costs. Healthcare, BFSI, energy, and public-sector deployments follow similar patterns, each layering AI inference on top of legacy virtualization estates. The diversified end-user base mitigates cyclicality and broadens revenue streams within the North America data center server market.
Geography Analysis
The United States retained 85.80% of 2025 revenue thanks to Northern Virginia, Dallas-Fort Worth and Silicon Valley clusters that house the largest hyperscale footprints globally northspyre. Yet skyrocketing land prices and grid bottlenecks now prompt operators to scout secondary markets such as Columbus and Kansas City where utilities can still promise multi-hundred-megawatt blocks. Policy incentives, including investment-tax credits for clean-energy-powered facilities, further shape site-selection models, ensuring the North America data center server market continues extending into new US regions.
Canada, forecast to grow 19.05% CAGR, benefits from abundant hydroelectric power and cooler ambient temperatures that lower PUE levels. The federal CAD 240 million AI-infrastructure program and provincial grants accelerate build starts in Toronto-Waterloo and Montréal. Cyber-security rankings that place the nation fifth worldwide also reassure regulated industries such as finance and healthcare. With 88% of enterprises demanding in-country hosting, server shipments into Canadian halls are set to outpace the broader North America data center server market.
Mexico’s Queretaro corridor has emerged as Latin America’s fastest-rising hub, anchored by ODATA’s USD 3 billion, 400 MW campus that addresses US nearshoring supply-chain strategies mexicobusinessnews. Renewable-energy targets of 45% clean electricity by 2030 align with corporate ESG scorecards, drawing hyperscalers that require low-carbon grids. However, talent-pipeline constraints and regulatory fluidity must be resolved to maximize Mexico’s contribution to the North America data center server market.
Mordor Intelligence delivers a comprehensive view of the data center server market across all major regions such as Africa, Americas, and Europe, alongside country-level analysis for Canada, United States, Norway, Germany, Nigeria, and Switzerland, each offering a view of the local market realities.
Competitive Landscape
Competition in the North America data center server market is intensifying as differentiation shifts toward AI-optimized thermals, rapid configuration services, and co-design with GPU vendors. Dell’s Infrastructure Solutions Group posted USD 11.6 billion revenue during Q2 2025, up 80% in servers and networking, demonstrating resilience across both enterprise and AI pipelines. Hewlett-Packard Enterprise consolidated its position through turnkey liquid-cooled racks aligned with NVIDIA’s MGX reference platform, while fulfilling a USD 1 billion single-customer AI order that validated scale-out capacity.
Super Micro leveraged original-design-manufacturer agility by partnering closely with NVIDIA on accelerated roadmaps, lifting quarterly revenue to nearly USD 6 billion and capturing greenfield AI clusters where legacy OEMs could not match delivery speed. Colocation operators such as CoreSite and Cologix are moving up the stack with DGX-Ready bays and GPU-as-a-service, courting enterprises that prefer Opex-based experimentation before scaling. Power-and-cooling specialists Eaton and Siemens Energy now co-develop on-site natural-gas plants that eliminate diesel generators and cut CO₂ emissions by 50%, illustrating convergence between IT and energy supply chains eaton. The resulting ecosystem complexity compels customers to engage multi-vendor consortia, reinforcing service-led sales motions across the North America data center server market.
North America Data Center Server Industry Leaders
Dell Inc.
Hewlett Packard Enterprise
Lenovo Group Limited
Cisco Systems Inc.
Supermicro
- *Disclaimer: Major Players sorted in no particular order

Recent Industry Developments
- May 2025: Dell Technologies rolled out the Dell AI Factory, new AI PCs and the PowerCool enclosed rear-door exchanger to lower rack inlet temperatures by 25 °C
- May 2023: Cisco Systems Inc. introduced UCS X servers that cut data center energy use in half. The combination of the Cisco Intersight infrastructure management platform and Unified Computing System (UCS) X-Series servers reduces data center energy consumption by up to 52% at a 4:1 server consolidation rate.
- May 2025: ODATA opened Mexico’s DC QR03 in Queretaro after investing more than USD 3 billion for 400 MW IT capacity
- May 2025: NVIDIA introduced the Blackwell Ultra GPU for data-center AI acceleration
- January 2025: X ordered USD 1 billion of HPE AI servers, underscoring private-sector appetite for dedicated GPU clusters
- November 2025: Super Micro reported 181% year-over-year revenue growth and deployed the world’s largest liquid-cooled GPU supercluster
- August 2025: Consensus Core partnered with Cologix to launch GPU-as-a-service in Canada


Research Methodology Framework and Report Scope
Market Definitions and Key Coverage
Our study defines the North America data-center server market as the annual value of new rack, blade, micro, and tower servers that are installed inside commercial colocation halls, hyperscale, and enterprise facilities across the United States, Canada, and Mexico to process, store, or route digital workloads. The figure captures associated chassis, management modules, and bundled firmware support that ship with each server.
Scope Exclusion: Refurbished units, bare PCB system boards sold to hobbyist labs, and compute nodes embedded in telecom edge radios fall outside this boundary.
Segmentation Overview
- By Data-Center Tier
- Tier 1 and 2
- Tier 3
- Tier 4
- By Form Factor
- Half-height Blades
- Full-height Blades
- Quarter-height / Micro-blades
- By Application / Workload
- Virtualisation and Private Cloud
- High-Performance Computing (HPC)
- Artificial Intelligence/Machine Learning and Data Analytics
- Storage-centric
- Edge / IoT Gateways
- By Data Center Type
- Hyperscalers/Cloud Service Provider
- Colocation Facilities
- Enterprise and Edge
- By End-use Industry
- BFSI
- IT and Telecom
- Healthcare and Life-Sciences
- Manufacturing and Industry 4.0
- Energy and Utilities
- Government and Defence
- Geography
- United States
- Canada
- Mexico
Detailed Research Methodology and Data Validation
Primary Research
Discussions with facility design engineers, hyperscale procurement leads, OEM product strategists, and Canadian colocation executives allow us to verify refresh intervals, GPU attach ratios, and average selling prices. Survey pulses across Mexico's Queretaro corridor further test assumptions on shipment lead times and import tariffs.
Desk Research
Mordor analysts scrape open customs codes for HS-8471.50, consult U.S. Energy Information Administration power-consumption dashboards, and track capacity releases posted by the Uptime Institute and Statistics Canada to anchor shipment volumes, load densities, and regional build cycles. Industry white papers from AFCOM, Open Compute Project blogs, SEC 10-K filings, plus insights drawn from Dow Jones Factiva and D&B Hoovers enrich price curves and corporate capex signals. We supplement these with patent trends from Questel that flag liquid-cool ready chassis designs. This list is illustrative; many additional public datasets inform our desk research.
Market-Sizing & Forecasting
A blended top-down and bottom-up logic is applied. Region-level data-center capex and IT-load additions are first reconstructed, then multiplied by validated server spend ratios, which are subsequently stress-checked against sampled OEM shipment roll-ups and channel ASP × volume spot checks. Key model drivers include rack power density, AI accelerator penetration, average three-year refresh cadence, x86 versus ARM mix, and the West Texas electricity price index that influences location decisions. Five-year forecasts rely on multivariate regression that links those drivers with announced capacity pipelines and macro IT-services growth, while scenario analysis bridges supply-chain disruption gaps.
Data Validation & Update Cycle
Outputs pass two-step analyst peer review, variance flags above ±7% trigger source re-checks, and models refresh every twelve months, with interim updates if an operator announces a ≥500 MW build or a major processor launch.
Why Mordor's North America Data Center Server Baseline Commands Reliability
Published numbers often differ because studies choose dissimilar server mixes, allocate varying shares of facility capex to compute, or freeze exchange rates at distinct points.
Key Gap Drivers in rival work include narrower rack-only scopes, conservative ASP deflators, or older 2023 base years that omit the post-ChatGPT GPU surge. Mordor's 2024 base year, quarterly refresh cadence, and dual-check shipment method mitigate those skews.
Benchmark comparison
| Market Size | Anonymized source | Primary gap driver |
|---|---|---|
| USD 63.87 B (2025) | Mordor Intelligence | - |
| USD 39.32 B (2023) | Global Consultancy A | Excludes micro-servers, uses 2023 FX rates, no GPU price uplift |
| USD 21.50 B (2024) | Trade Journal B | Focuses on rack format only, applies single-digit refresh rate |
The comparison shows that, by selecting the full server spectrum, updating currency and density inputs yearly, and validating with real shipment interviews, Mordor Intelligence delivers a balanced, transparent baseline that decision-makers can trace back to replicable variables and steps.


Key Questions Answered in the Report
How large is the North America data center server market today?
The market generated USD 72.33 billion in 2026 and is projected to reach USD 134.58 billion by 2031, delivering a 13.24% CAGR.
What workload segment leads server purchases?
AI and machine-learning servers account for 38.84% of 2025 revenue, reflecting the rise of GPU-dense racks deployed for generative AI training.
Which facility type is growing fastest?
Hyperscale data centers are expanding at a 20.64% CAGR as cloud providers commit multi-billion-dollar budgets to support AI services.
Why is Canada attracting new data centers?
Abundant hydro power, cooler climates and strict data-sovereignty rules underpin Canada’s 19.05% CAGR growth forecast.
What limits capacity expansion in the United States?
Grid-power constraints and soaring land prices in prime metros delay energization of new halls, moderating short-term supply additions.
How will 5G influence future server demand?
5G roll-outs drive edge computing nodes that require quarter-height and micro-blade servers, pushing high-growth pockets at metro aggregation points.
Page last updated on:


