Graph Database Market Size and Share
Market Overview
| Study Period | 2020 - 2031 |
|---|---|
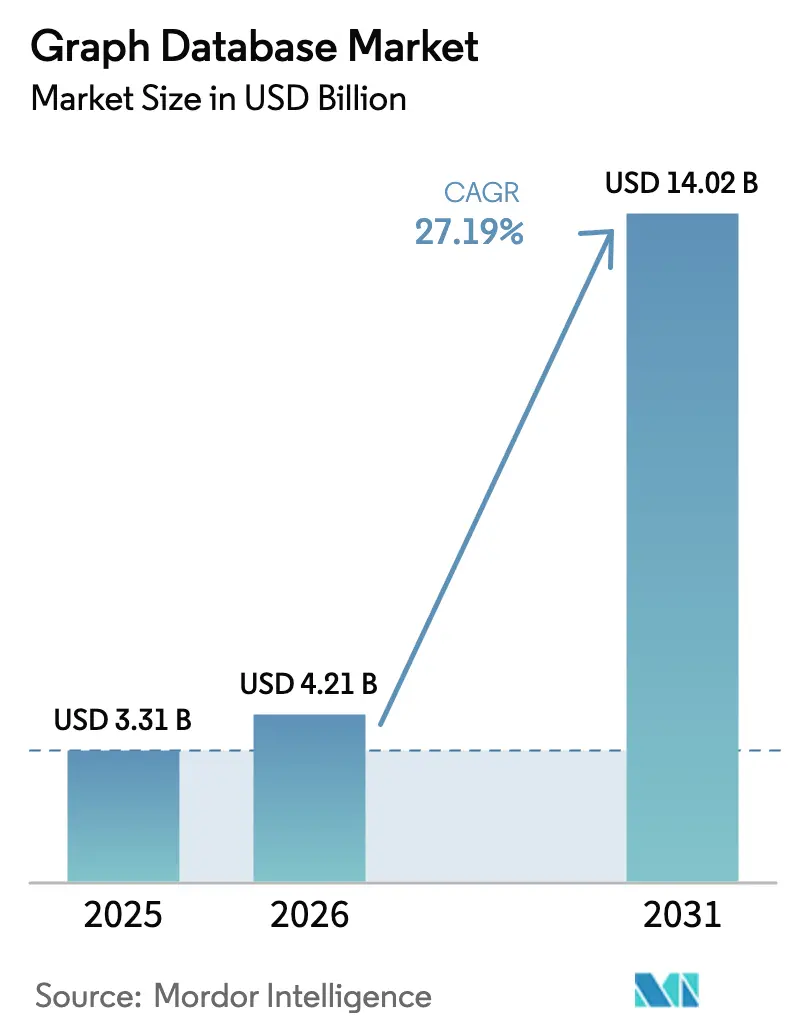
| Market Size (2026) | USD 4.21 Billion |
| Market Size (2031) | USD 14.02 Billion |
| Growth Rate (2026 - 2031) | 27.19% CAGR |
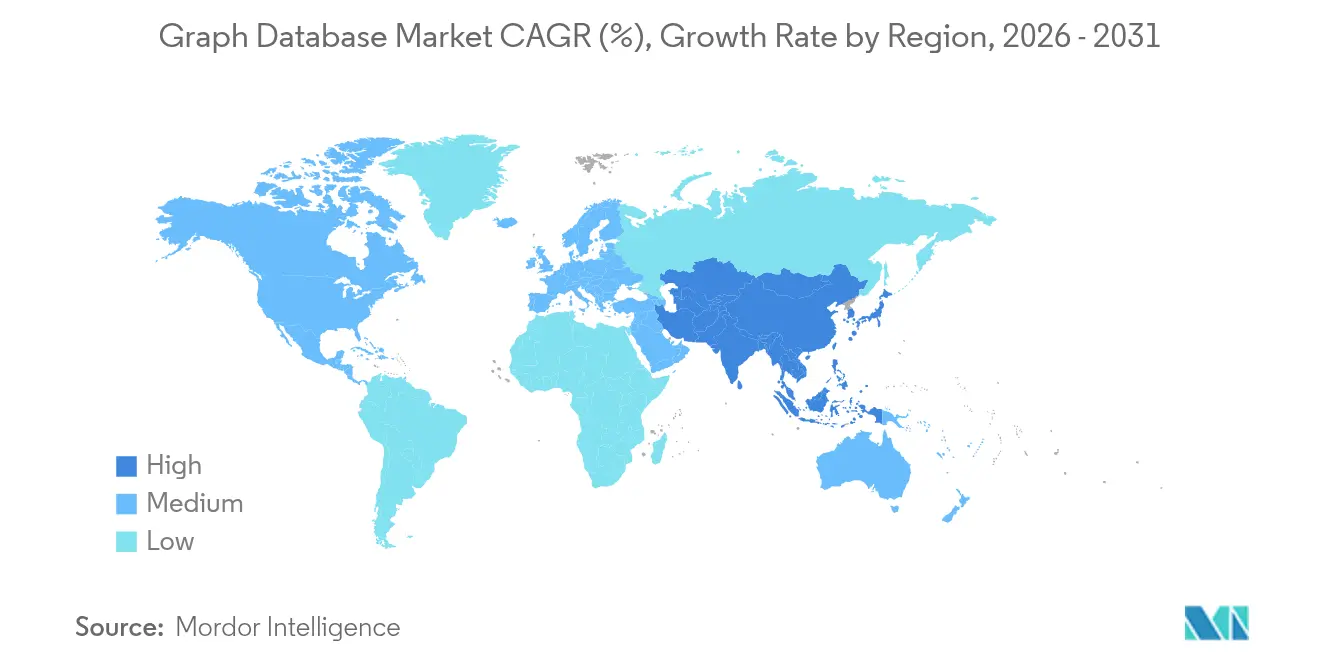
| Fastest Growing Market | Asia Pacific |
| Largest Market | North America |
| Market Concentration | Medium |
Major Players *Disclaimer: Major Players sorted in no particular order Image © Mordor Intelligence. Reuse requires attribution under CC BY 4.0. | |
Graph Database Market Analysis by Mordor Intelligence
Graph database market size in 2026 is estimated at USD 4.21 billion, growing from 2025 value of USD 3.31 billion with 2031 projections showing USD 14.02 billion, growing at 27.19% CAGR over 2026-2031. This steep trajectory reflects the urgency with which enterprises seek to analyze relationships hidden in sprawling data networks that relational systems struggle to model. The rise of AI workloads, the shift to cloud-native data stacks, and the spread of digital-twin programs combine to keep the graph database market in the spotlight. Vendor investment in serverless delivery, hyperscaler partnerships, and knowledge-graph integrations further accelerate adoption. At the same time, services revenue outpaces software licensing as firms lean on outside expertise to design, deploy, and operate mission-critical graph solutions.
Key Report Takeaways
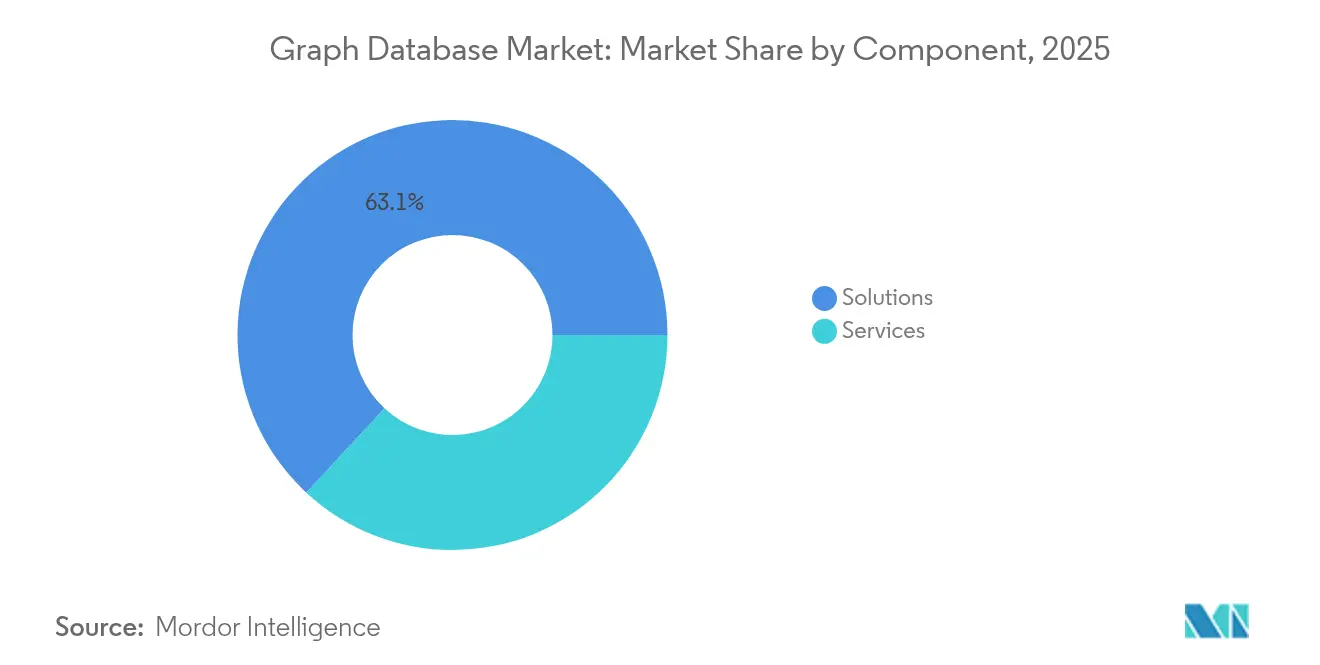
- By component, solutions held 63.10% of the graph database market share in 2025, while services are projected to expand at a 26.63% CAGR through 2031.
- By deployment, the cloud segment commanded 71.50% revenue share in 2025 and is expected to post a 28.92% CAGR to 2031.
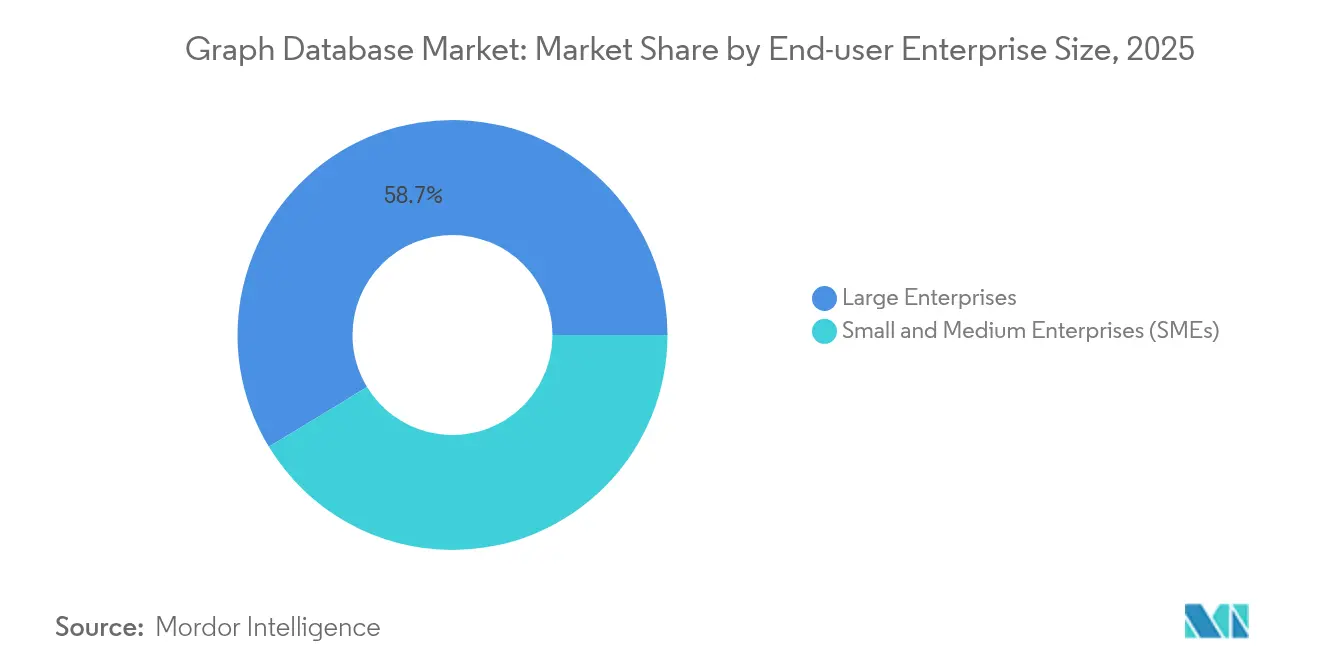
- By end-user enterprise size, large enterprises led with 58.70% share of the graph database market size in 2025, yet SMEs are set to grow at a 29.17% CAGR.
- By end-user industry, BFSI captured 25.80% of 2025 revenue, whereas healthcare and life sciences will likely register the fastest 29.66% CAGR to 2031.
- By geography, North America controlled 36.30% of 2025 revenue, while Asia-Pacific should move ahead at a 28.74% CAGR through 2031.
Note: Market size and forecast figures in this report are generated using Mordor Intelligence’s proprietary estimation framework, updated with the latest available data and insights as of 2026.
Global Graph Database Market Trends and Insights
Drivers Impact Analysis*
| Driver | (~) % Impact on CAGR Forecast | Geographic Relevance | Impact Timeline |
|---|---|---|---|
| Cloud-native adoption in enterprise data stacks | +8.5% | Global, with North America and Europe leading | Medium term (2-4 years) |
| Surge in AI/ML pipelines needing connected data context | +7.2% | Global, concentrated in tech hubs | Short term (≤ 2 years) |
| M&A wave among hyperscalers for graph analytics capabilities | +4.1% | North America and Europe, expanding to Asia-Pacific | Medium term (2-4 years) |
| National digital-twin programs driving public-sector graph spend | +3.8% | Europe and Asia-Pacific, selective North America adoption | Long term (≥ 4 years) |
| Digital transformation initiatives across enterprises | +6.3% | Global, with Asia-Pacific showing highest acceleration | Medium term (2-4 years) |
| IoT data growth requiring relationship analysis | +5.7% | Global, manufacturing-heavy regions leading | Long term (≥ 4 years) |
| Source: Mordor Intelligence | |||
Cloud-Native Adoption in Enterprise Data Stacks
Cloud-first architectures push organizations to connect data stored across multiple services, and graph databases have emerged as the default engine for relationship analytics. Partnerships such as Neo4j’s integrations with AWS Bedrock and Microsoft Fabric highlight how vendors embed graph capabilities deep inside mainstream cloud platforms. Serverless options now let teams run graph queries at scale without managing infrastructure, lowering both cost and latency. The resulting agility cements the graph database market as a staple of the modern data stack rather than a niche tool.
Surge in AI/ML Pipelines Needing Connected Data Context
Generative AI, feature engineering, and recommendation engines depend on a reliable map of entities and relationships. Graph databases supply that semantic layer, increasing model accuracy and trimming training data volumes. Techniques such as Graph Retrieval-Augmented Generation use knowledge graphs to cut hallucinations in large language models, turning relationship data into a competitive advantage.
M&A Wave Among Hyperscalers for Graph Analytics Capabilities
Cloud providers and data-platform vendors are buying graph technologies to widen their AI portfolios. Samsung added Oxford Semantic Technologies to bolster knowledge-graph IP, and Altair folded Cambridge Semantics into its analytics suite, signaling the appetite for graph-driven insights across hardware and software stacks. Consolidation raises the entry bar for smaller suppliers while validating the strategic value of graph databases.
National Digital-Twin Programs Driving Public-Sector Graph Spend
Governments allocate record AI budgets to model energy grids, transit systems, and urban assets. The United States set aside USD 3.3 billion for AI R&D in fiscal 2025, part of which funds graph-based digital-twin pilots. Similar programs in Europe and Asia-Pacific rely on graph models that capture multi-layer relationships necessary for city-scale simulation.
Restraints Impact Analysis*
| Restraint | (~) % Impact on CAGR Forecast | Geographic Relevance | Impact Timeline |
|---|---|---|---|
| Lack of skilled graph data modelers | -6.2% | Global, most acute in emerging markets | Medium term (2-4 years) |
| Interoperability gaps among query languages | -4.8% | Global, affecting multi-vendor environments | Short term (≤ 2 years) |
| Rising egress costs on multi-cloud graph deployments | -3.5% | Global, concentrated in cloud-heavy regions | Short term (≤ 2 years) |
| Data privacy and security concerns | -4.1% | Europe & North America, expanding globally | Long term (≥ 4 years) |
| Source: Mordor Intelligence | |||
Lack of Skilled Graph Data Modelers
Enterprises face a shortfall of professionals fluent in graph theory, schema design, and query languages such as Cypher or Gremlin. Training portals like Neo4j GraphAcademy and Ontotext Academy increase supply, yet demand still outstrips talent, lengthening deployment cycles and elevating consulting costs.
Interoperability Gaps Among Query Languages
The absence of a fully ratified Graph Query Language standard compels users to juggle Cypher, Gremlin, and SPARQL. Migrating across engines increases risk and discourages multi-vendor strategies, particularly in regulated sectors that prize long-term data portability [1]“GQL Standard Project Update,” GQL Standards, gqlstandards.org.
*Our forecasts treat driver/restraint impacts as directional, not additive. The impact forecasts reflect baseline growth, mix effects, and variable interactions.
Segment Analysis
By Component: Services Accelerate Professional Expertise Demand
Solutions captured 63.10% of revenue in 2025, underlining software’s central role in deploying connected-data workloads. Services, however, are scaling faster at a 26.63% CAGR as firms outsource implementation, tuning, and managed operations. Consulting partners report that mature engagements deliver rapid time-to-value, citing double-digit productivity gains once graph models replace brittle relational joins. Because successful graph rollouts hinge on schema design, demand for professional advisers remains high. Vendors respond with packaged reference architectures that compress pilot phases and harden production readiness.
The services wave also reflects broader moves toward consumption pricing. Customers prefer to pay for outcomes rather than licenses, prompting vendors to blend advisory, managed, and training offerings. As graph analytics feeds AI models, specialized services—knowledge-graph construction, Graph RAG optimization, and ontology governance—command premium fees. Consequently, service revenues are positioned to widen their slice of the graph database market through 2031.


By Deployment: Cloud Dominance Reflects Infrastructure Evolution
Cloud implementations accounted for 71.50% of 2025 revenue and continue to accelerate at a 28.92% CAGR. Hyperscalers pre-configure security, autoscaling, and integrations, letting developers spin up clusters in minutes and focus on relationships, not servers. Amazon Neptune, Azure Cosmos DB, and Google’s graph services handle elasticity and backups natively, a draw for teams seeking low-overhead graph infrastructure. Even regulated industries that once defaulted to on-premises are piloting cloud sandboxes for development and training.
On-premises graph clusters persist in defense and healthcare settings that enforce tight data residency rules. These environments increasingly adopt hybrid blueprints, running inferencing pipelines in the cloud while storing sensitive data on site. Rising egress charges, however, push some users to consolidate graph workloads with a single provider, a trade-off between cost and vendor flexibility that the graph database market will watch closely.
By End-user Enterprise Size: SME Adoption Accelerates Digital Transformation
Large Enterprises held 58.70% of the graph database market in 2025, using the technology to defeat fraud, optimize supply chains, and unify customer profiles. Yet the fastest expansion comes from SMEs, which are forecast to grow at a 29.17% CAGR to 2031. Low-code graph workbenches, usage-based pricing, and serverless delivery remove the capital hurdles that once shut smaller firms out. Templates for recommendation engines and customer 360° analytics let SMEs deploy production graphs without deep in-house expertise, leveling the data-strategy playing field.
SMEs also value the pay-as-you-grow economics of cloud graphs. Because billing scales with actual query volume, smaller firms can experiment without committing to costly hardware. As these deployments mature, SMEs become repeat buyers of adjacent graph services, solidifying their role as a high-growth segment within the graph database market.
By End-User Industry: Healthcare Drives Innovation in Life Sciences
BFSI remained the top revenue contributor in 2025 with 25.80% usage, relying on real-time relationship analytics to detect anomalies and comply with KYC mandates. The fastest lift, however, is in healthcare and life sciences, which is projected to register a 29.66% CAGR. Researchers use knowledge graphs to link genomic, chemical, and clinical data, accelerating drug-repurposing discoveries. Hospitals apply graph analytics to patient journeys, boosting diagnostic accuracy and reducing readmissions.
Retail, telecommunications, and media also expand their graph footprints. Recommendation systems, network-route optimization, and content personalization all demand sub-second traversal across billions of edges. As AI adoption spreads, industry diversification ensures the graph database market remains insulated from single-sector slowdowns.
Geography Analysis
North America led the graph database market with 36.30% revenue in 2025, fueled by robust cloud adoption, deep venture capital pools, and government AI funding. The United States channels USD 3.3 billion into AI R&D, part of which underwrites graph pilots in transportation, energy, and defense . Canada’s banks and fintechs expand graph workloads to counter fraud and personalize digital services, reinforcing regional dominance.
Asia-Pacific stands out as the fastest-growing territory, projected at a 28.74% CAGR to 2031. Governments in Japan, Singapore, and India champion smart-city initiatives that depend on relationship data models. Data-center expansions across Southeast Asia shorten latency and lower entry barriers, encouraging local firms to weave graph databases into e-commerce, telecom, and logistics platforms. China’s AI investment surge adds substantial volume, even as data-sovereignty rules spur demand for domestic graph suppliers.
Europe shows steady adoption, driven by GDPR-compliant hybrid architectures in Germany and France. Automotive manufacturers apply graph analytics to supply-chain digital twins, while the pharmaceutical corridor in Switzerland and the United Kingdom funds knowledge-graph drug-discovery programs. Eastern Europe’s developer talent pool, skilled in open-source Cypher and Gremlin, supports a vibrant services ecosystem that helps mid-sized companies onboard graph technology.

Competitive Landscape
The graph database market is moderately fragmented, featuring pure-play vendors, hyperscaler platforms, and niche specialists. Neo4j leads by revenue, surpassing USD 200 million and deepening cloud reach through Aura SaaS and serverless analytics. TigerGraph pursues high-performance OLAP graphs, unveiled in its Savanna cloud launch, and leverages USD 171.7 million in funding to court financial-services and telecommunication clients.
Hyperscalers tighten competition by embedding fully managed graph engines into broader data fabrics. Amazon, Microsoft, Oracle, and Google bundle identity management, AI toolchains, and observability dashboards, appealing to enterprises that prefer unified procurement and support. Meanwhile, smaller innovators such as PuppyGraph, backed by USD 5 million in seed capital, pioneer zero-ETL graph query layers, underscoring investor appetite for specialized performance plays [3]“PuppyGraph Secures Seed Funding,” PuppyGraph, puppygraph.com.
Strategic acquisitions reshape the field. Samsung’s pickup of Oxford Semantic Technologies and Altair’s buyout of Cambridge Semantics fold semantic stack assets into larger ecosystems, foreshadowing tighter links between knowledge graphs and generative AI workflows. Vendors that deliver open standards and seamless AI integration are poised to capture outsized share as customer preference shifts toward end-to-end data platforms.
Graph Database Industry Leaders
Amazon Web Services Inc.
Oracle Corporation
Microsoft Corporation
Neo4j, Inc.
TigerGraph, Inc.
- *Disclaimer: Major Players sorted in no particular order


Recent Industry Developments
- May 2025: Neo4j launched Neo4j Aura Graph Analytics, a serverless service that removes ETL and specialist-query barriers for business users.
- January 2025: TigerGraph introduced Savanna, a cloud-native release designed to surface relationships and power AI systems with minimal setup.
- January 2025: Neo4j joined the Linux Foundation AI & Data to advance open-source AI development through knowledge graphs.
- November 2024: PuppyGraph secured USD 5 million in seed funding to speed development of its zero-ETL graph query engine.


Global Graph Database Market Report Scope
A graph database is defined as single-purpose platform for creating and manipulating graphs. Graphs contains edges,nodes, along with properties, all of which represents and stores data in a way that relational databases are not equipped to do.
The graph database market is segmented by component (solutions, services [managed, professional]), deployment (cloud, on premises), size (smes, large enterprises), end user (BFSI, healthcare, retail & e-commerce, IT and telecom, media and entertainment, other end users),, geography (North America, Europe, Asia-Pacific, rest of the World). The Report Offers Market Forecasts and Size in Value (USD) for all the Above Segments.
| Solutions | |
| Services | Managed Services |
| Professional Services |
| Cloud |
| On-premises |
| Small and Medium Enterprises (SMEs) |
| Large Enterprises |
| BFSI |
| Healthcare and Life Sciences |
| Retail and E-commerce |
| Information Technology and Telecommunications |
| Media and Entertainment |
| Transportation and Logistics |
| Other End-users |
| North America | United States | |
| Canada | ||
| Mexico | ||
| South America | Brazil | |
| Argentina | ||
| Rest of South America | ||
| Europe | Germany | |
| United Kingdom | ||
| France | ||
| Italy | ||
| Spain | ||
| Russia | ||
| Rest of Europe | ||
| Asia-Pacific | China | |
| Japan | ||
| India | ||
| South Korea | ||
| Australia and New Zealand | ||
| Rest of Asia-Pacific | ||
| Middle East and Africa | Middle East | Saudi Arabia |
| United Arab Emirates | ||
| Turkey | ||
| Rest of Middle East | ||
| Africa | South Africa | |
| Nigeria | ||
| Egypt | ||
| Rest of Africa | ||
| By Component | Solutions | ||
| Services | Managed Services | ||
| Professional Services | |||
| By Deployment | Cloud | ||
| On-premises | |||
| By End-user Enterprise Size | Small and Medium Enterprises (SMEs) | ||
| Large Enterprises | |||
| By End-user Industry | BFSI | ||
| Healthcare and Life Sciences | |||
| Retail and E-commerce | |||
| Information Technology and Telecommunications | |||
| Media and Entertainment | |||
| Transportation and Logistics | |||
| Other End-users | |||
| Geography | North America | United States | |
| Canada | |||
| Mexico | |||
| South America | Brazil | ||
| Argentina | |||
| Rest of South America | |||
| Europe | Germany | ||
| United Kingdom | |||
| France | |||
| Italy | |||
| Spain | |||
| Russia | |||
| Rest of Europe | |||
| Asia-Pacific | China | ||
| Japan | |||
| India | |||
| South Korea | |||
| Australia and New Zealand | |||
| Rest of Asia-Pacific | |||
| Middle East and Africa | Middle East | Saudi Arabia | |
| United Arab Emirates | |||
| Turkey | |||
| Rest of Middle East | |||
| Africa | South Africa | ||
| Nigeria | |||
| Egypt | |||
| Rest of Africa | |||


Key Questions Answered in the Report
What is driving the rapid growth of the graph database market?
Real-time relationship analytics for AI workloads, cloud-native delivery models, and national digital-twin projects are the chief growth engines pushing the market toward a 27.19% CAGR.
Which deployment model is preferred for graph databases?
Cloud deployment dominates with 71.50% revenue share in 2025 because hyperscalers offer fully managed graph services that trim operational overhead.
Why are services growing faster than software licenses?
Implementing production-grade graph solutions demands specialized skills, so enterprises increasingly outsource consulting, training, and managed operations, propelling services at a 26.63% CAGR.
Which industry is expected to adopt graph databases most rapidly through 2031?
Healthcare and life sciences lead future adoption, forecast to expand at a 29.66% CAGR as researchers use knowledge graphs for drug discovery and precision medicine.
Page last updated on:


