
India Data Center Server Market Size and Share
Market Overview
| Study Period | 2020 - 2032 |
|---|---|
| Forecast Data Period | 2026 - 2032 |
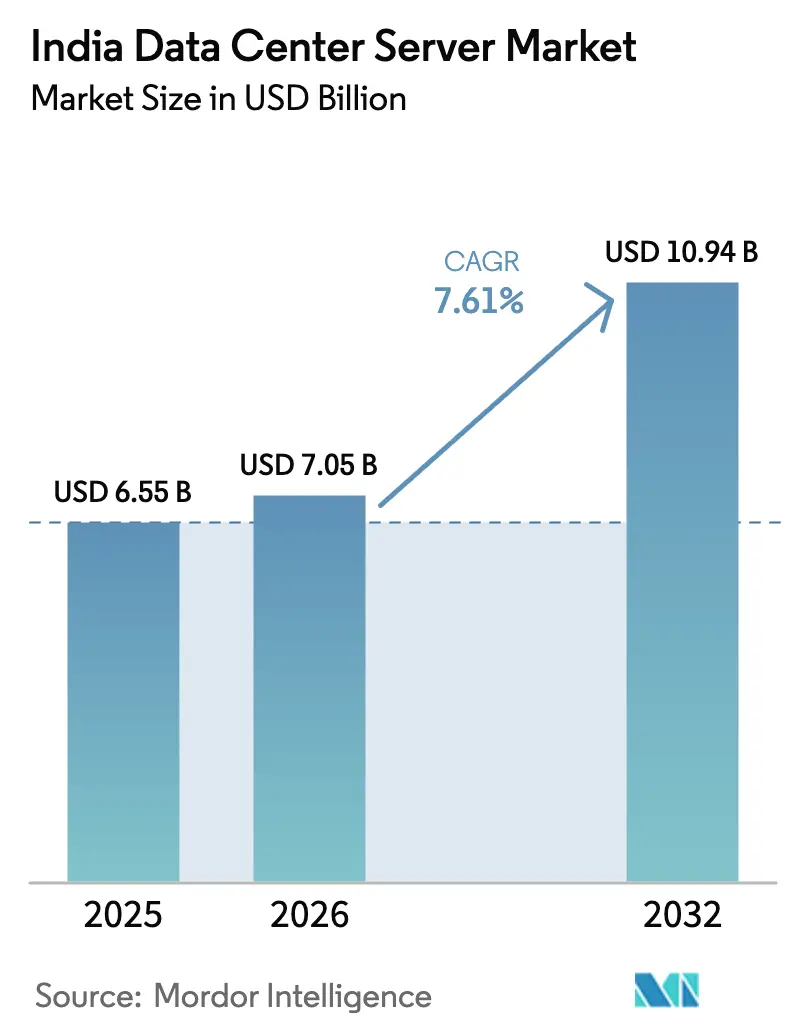
| Base Year Market Size (2025) | USD 6.55 Billion |
| Market Size (2026) | USD 7.05 Billion |
| Market Size (2032) | USD 10.94 Billion |
| Growth Rate (2026 - 2032) | 7.61 % |
| Market Concentration | Medium |
Major Players *Disclaimer: Major Players sorted in no particular order Image © Mordor Intelligence. Reuse requires attribution under CC BY 4.0. | |
India Data Center Server Market Analysis by Mordor Intelligence
The India data center server market size is expected to grow from USD 6.55 billion in 2025 to USD 7.05 billion in 2026 and is forecast to reach USD 10.94 billion by 2032 at 7.61% CAGR over 2026-2032. This performance is shaped by hyperscaler capital expenditure, data-localization mandates, and artificial-intelligence workloads that now cut across every enterprise vertical. Rack servers retain a 38% revenue share, yet micro and edge servers post the quickest 8.0% CAGR thanks to 5G network densification. ARM-based platforms deliver the fastest 7.9% processor growth as state incentives favor indigenous assembly, while x86 keeps a 62% foothold through broad software compatibility. Hyperscale cloud service providers hold 49% of deployment share and still expand, but edge micro-data centers register an even higher 8.1% CAGR as latency-sensitive applications reshape infrastructure placement. Geographic diversification into tier-2 cities continues, driven by renewable-energy availability and government incentives that ease land, power, and permitting hurdles.
Key Report Takeaways
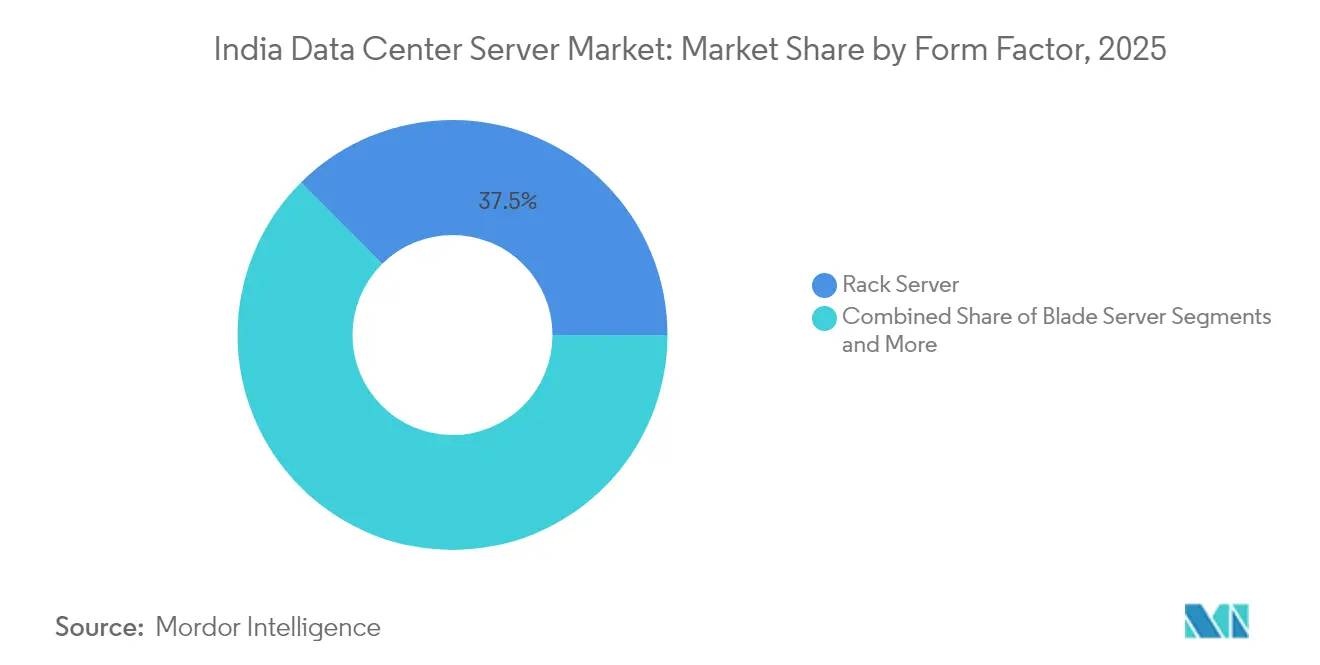
- By form factor, rack servers led with 37.45% of the India data center server market share in 2025, while micro and edge servers are forecast to expand at an 7.76% CAGR through 2032.
- By processor architecture, x86 accounted for 61.25% share of the India data center server market size in 2025; ARM processors are advancing at a 7.68% CAGR over the same period.
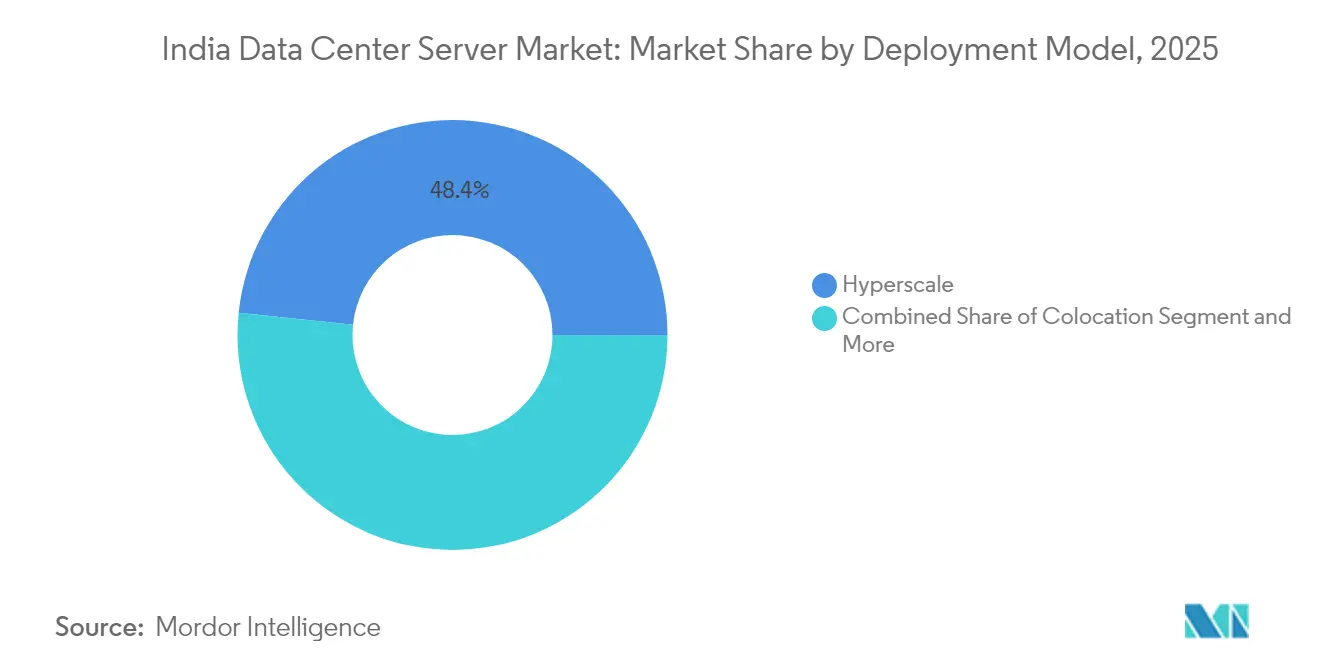
- By deployment model, hyperscale cloud service providers commanded 48.35% of the India data center server market size in 2025, whereas edge micro-data centers are on track for an 7.89% CAGR to 2032.
- By end-user industry, IT and telecommunications held 55.35% of the India data center server market share in 2025; media and entertainment registered the fastest 7.96% CAGR through 2032.
Note: Market size and forecast figures in this report are generated using Mordor Intelligence’s proprietary estimation framework, updated with the latest available data and insights as of 2026.
India Data Center Server Market Trends and Insights
Drivers Impact Analysis*
| DRIVER | (~) % IMPACT ON CAGR FORECAST | GEOGRAPHIC RELEVANCE | IMPACT TIMELINE |
|---|---|---|---|
| Hyperscaler and colocation CAPEX surge (2025-30) | +2.1% | West India (Mumbai, Pune), South India (Bengaluru, Chennai) | Medium term (2-4 years) |
| 5G roll-out driving edge-node micro-server demand | +1.8% | Nationwide, early adoption in Delhi-NCR, Mumbai, Bengaluru | Short term (≤ 2 years) |
| Gen-AI GPU server clusters for BFSI and OTT workloads | +1.5% | South India (Bengaluru, Hyderabad), West India (Mumbai) | Medium term (2-4 years) |
| Data-localization mandates under DPDP Act | +1.2% | National, concentration in major metros | Long term (≥ 4 years) |
| Green Open-Access policy lowering renewable PUE costs | +0.8% | Gujarat, Tamil Nadu, Karnataka, Maharashtra | Long term (≥ 4 years) |
| State incentives for Make-in-India ARM server assembly | +0.6% | Tamil Nadu, Gujarat, Andhra Pradesh, Karnataka | Medium term (2-4 years) |
| Source: Mordor Intelligence | |||
Hyperscaler and Colocation CAPEX Surge
Reliance Industries has announced a 3 GW data-center campus in Gujarat that will triple current national capacity and employ NVIDIA AI semiconductors powered by renewable energy.[1]Reliance Industries Ltd., “Jamnagar Green Data Center Campus Overview,” ril.com Colocation specialist CtrlS is rolling out 350 MW of “AI-ready” white space buffered by USD 2 billion of fresh investment. Government policy now allows 100% foreign direct investment in data-center infrastructure, which has accelerated cloud-region launches and deepened hardware refresh cycles. Facility blueprints increasingly specify high-density racks, liquid cooling, and DCIM systems calibrated for GPU clusters. With multiple operators racing to lock in land and power at favorable rates, procurement cycles for servers, networking, and power distribution units have shortened from twelve to six months, dramatically lifting baseline demand across the India data center server market.
5G Roll-out Driving Edge-Node Micro-Server Demand
Indian telecom operators will need 22 million skilled workers by 2025 to complete nationwide 5G, underlining the vast scale of tower-side compute that must be installed. Micro-server nodes with ruggedized, low-footprint enclosures house ARM-based boards that consume less than 250 W yet deliver adequate AI inference at the network edge. Bharti Airtel and Reliance Jio have issued multi-year purchase orders that bundle integrated cooling, distributed UPS, and zero-touch provisioning. Open-access fiber and renewed spectrum policies keep backhaul costs manageable, while state PLI schemes reimburse 4-6% of factory gate value for optimized edge systems manufactured locally. The resulting 8.1% CAGR uplift for edge micro-data centers will continue to pull share from centralized hyperscale racks inside the India data center server market.
Gen-AI GPU Server Clusters for BFSI and OTT Workloads
The IndiaAI Mission earmarks USD 1.2 billion to deploy 10,000 GPUs via public-private partnerships.[2]Ministry of Electronics and IT, “IndiaAI Mission Investment Note,” meity.gov.in Yotta has already installed 8,192 NVIDIA H100 GPUs inside its Shakti Cloud platform. BFSI leaders led by State Bank of India partner with IBM to embed generative AI in fraud analytics and customer support. OTT players require real-time video transcoding and recommendation engines that run on dense GPU trays with high-bandwidth memory. Vendors are therefore shipping 6-9 kW sleds cooled by direct-to-chip liquid loops, locking in higher ASPs and elongating replacement cycles. The convergence of financial, streaming, and gaming workloads keeps GPU-accelerated servers on premium price curves well into the forecast horizon of the India data center server market.
Data-Localization Mandates Under DPDP Act
The Digital Personal Data Protection Act stipulates that sensitive personal data must be stored, processed, and deleted only inside Indian territory. Oracle responded by launching additional NetSuite zones in Mumbai and Hyderabad to guarantee local residency for ERP data. The National Government Cloud Services Portal mandates that ministries consume IaaS exclusively from certified domestic regions. As a result, multinationals shift from cross-border latency trade-offs toward in-country racks outfitted with encryption accelerators and tamper-proof key-management modules. Compliance reviews now examine physical cabling routes and even BIOS patch governance, generating stickier demand for domestically built systems inside the India data center server market.
Restraints Impact Analysis*
| RESTRAINTS | (~) % IMPACT ON CAGR FORECAST | GEOGRAPHIC RELEVANCE | IMPACT TIMELINE |
|---|---|---|---|
| Grid-power scarcity and rising utility tariffs in Mumbai | -1.4% | West India (Mumbai metropolitan region) | Short term (≤ 2 years) |
| Import duties and INR volatility inflating server BoM | -1.1% | National, all manufacturing hubs | Medium term (2-4 years) |
| Supply-chain bottlenecks for HBM and advanced packaging | -0.9% | National, constraining AI server deployments | Short term (≤ 2 years) |
| Shortage of data-center-skilled workforce outside tier-1 | -0.6% | Tier-2 and tier-3 cities nationwide | Long term (≥ 4 years) |
| Source: Mordor Intelligence | |||
Grid-Power Scarcity and Rising Utility Tariffs in Mumbai
Mumbai remains India’s prime financial hub yet faces a stressed grid where large data-center additions can wait up to 18 months for new substation tie-ins. Operators now lock renewable power purchase agreements for solar farms in Gujarat at INR 3.1 per kWh, circumventing city tariffs that exceed INR 8.0 per kWh.[3]Power Finance Corporation, “Maharashtra Utility Tariff Schedule 2025,” pfcindia.com Maharashtra’s policy offers stamp-duty rebates and fast-track approvals for facilities built in dedicated technology parks, though capacity will come online only after 2027. In the interim, hyperscalers pivot expansions toward Navi Mumbai and Pune, diluting near-term server shipments into the city while sustaining national growth in the India data center server market.
Import Duties and INR Volatility Inflating Server BoM
Server bills of material rely on high-bandwidth memory, PCIe switches, and precision power stages that are still largely imported. A 2% depreciation in the INR can lift landed component costs by 1.6% given the 80% import share of BOM. Production-Linked Incentive tranches reimburse qualifying assemblers, but only if annual sales top INR 250 crore, leaving smaller ODMs exposed to currency shocks. Vendors therefore hedge through forward contracts and negotiate multi-quarter silicon allocation, yet pricing volatility continues to compress gross margins inside the India data center server industry.
*Our forecasts treat driver/restraint impacts as directional, not additive. The impact forecasts reflect baseline growth, mix effects, and variable interactions.
Segment Analysis
By Form Factor: Edge Computing Drives Micro-Server Adoption
Micro, modular, and edge servers will contribute USD 1.59 billion to the India data center server market size by 2032, expanding at an 7.76% CAGR. Rack designs still house 37.45% of 2025 shipments but lose incremental share to 2U micro-nodes that mount directly at tower shelters. The move shortens latency and lowers backhaul costs for video, AR, and industrial IoT. Apollo Hospitals uses Nutanix hyper-converged clusters across 72 facilities, boosting real-time monitoring while cutting IT energy by 80%. Tower servers keep traction among SMEs that lack rack infrastructure, while blade frames remain staples for finance workloads requiring dense virtualization.
Heightened power density within edge cabinets raises demand for direct-to-chip cooling plates and 48 V DC bus bars that reduce copper losses. Vendors package sealed module servers rated for 55 °C ambient operation with fan-less convection, essential for rural deployments. Engineering advances such as silicon photonics further consolidate functions, allowing even higher compute per liter. These shifts cement micro-servers as the fastest unit vector inside the India data center server market.



By Processor Architecture: ARM Gains Ground Despite x86 Dominance
The India data center server market size attributable to x86 reached USD 4.01 billion in 2025, but ARM nodes grow faster toward 19.60% share by 2032. Make-in-India incentives give Netweb Technologies the economics to ship Tyrone ARM servers hosting 192 cores at 225 W TDP. ARM systems trim power by 25-30% relative to x86, a key advantage for edge locales with limited cooling. RISC/Power stays a niche for scientific workloads under the National Supercomputing Mission that has installed 35 PF of compute across 34 facilities.
Software stacks mature quickly: Red Hat and Canonical both certify core banking, ERP, and analytics frameworks on ARM, reducing migration friction. x86 maintains primacy in Microsoft Windows environments and legacy VMware estates, helped by predictable roadmaps from Intel and AMD. Overall, architectural choice now hinges on total-cost calculations that factor electricity, licensing, and supply-chain risk, ensuring healthy coexistence inside the India data center server market.
By Deployment Model: Edge Micro-DC Growth Outpaces Hyperscale Expansion
Hyperscale operators provided 48.35% of 2025 revenue but edge micro-data centers clock the highest 7.89% CAGR. The National Informatics Centre is erecting a 60 MW facility in Guwahati to support northeastern e-governance, highlighting how public cloud is no longer strictly metro-centric. Enterprises adopt colocation footprints when capital preservation or timeline pressures override ownership preference. Wholesale models that supply dedicated halls to single tenants now account for 18% of new MW take-up.
The infrastructure mix shifts toward low-latency caching, real-time AI inference, and sovereign cloud partitions. Server SKUs ordered for micro-DCs increasingly ship with 1.2 kW PSUs, front-serviceable fans, and BMCs certified for zero-touch-provisioning protocols. These characteristics ripple through vendor product strategies and manifest as incremental export opportunities for “India-specific” configurations across Southeast Asia, further reinforcing volume within the India data center server market.
By End-User Industry: Media and Entertainment Accelerates Digital Infrastructure
IT and telecom lines of business consumed 55.35% of server shipments in 2025. They remain the backbone for enterprise cloud, yet media and entertainment drives the top CAGR at 7.96% as OTT subscriptions surpass 149 million. Hotstar, Viacom18, and Amazon Prime Video invest in GPU-dense transcode farms that sit adjacent to ISP peering hubs, curbing network egress charges. BFSI adds AI-centric fraud-detection clusters and high-frequency trading blades. Max Healthcare migrated workloads to Nutanix Cloud, slashing IT management labor by 60-70% and cutting power by 80%.
Government and public-sector agencies adopt cloud through a sovereign framework to digitize citizen services and record management. Localized compute ensures compliance under DPDP, pushing ministries to co-locate or build regionally distributed racks. Automotive, oil and gas, and life sciences round out “other industries,” each contributing niche requirements that spur customization of ruggedized, extended-temperature systems within the India data center server industry.
Geography Analysis
West India remains the single-largest addressable region, accounting for roughly 41.60% of 2025 server spending due to banking, capital-markets, and international connectivity nodes. Gujarat emerges as the fastest incremental contributor as Reliance’s 3 GW campus enters phased commissioning from 2026. Mumbai nevertheless confronts grid congestion, motivating operators to hedge expansion toward Pune and Navi Mumbai where land banks and sub-station slots are still available. Developers deploy hybrid cooling towers, lithium-ion UPS, and green power contracts to mitigate tariff spikes and carbon targets.
South India enjoys the deepest talent reservoir and an accommodative policy umbrella. Karnataka’s economic survey shows IT producing 25-28% of state gross value add. Bengaluru, Chennai, and Hyderabad combine to deliver an additional 650 MW of commissioned capacity by 2030. Unit colocation prices average INR 7,200 per kW per month, drawing gaming, SaaS, and design-automation tenants. Tamil Nadu allocates fast-track clearances and stamp-duty waivers when renewable power sourcing exceeds 60%, compressing go-live timelines to under 14 months.
North India’s Delhi-NCR corridor functions as the backbone for public-sector IT, connecting sovereign cloud regions and defense networks. Operators such as Iron Mountain and NTT leverage dual 220 kV feeds from Power Grid Corporation substations, providing five-nines reliability necessary for financial clearinghouses. East and North-East India are pivoting from greenfield to active builds. Kolkata reserved 195 acres for data-center hubs with cumulative USD 4.6 billion earmarked through 2027. Guwahati’s government-funded facility will operate as a regional edge anchor, improving service parity for underserved populations. These geographic shifts distribute growth evenly, ensuring that the India data center server market scales beyond traditional metro strongholds.
Regulatory Landscape
India's regulatory environment for data center servers is increasingly shaped by data protection compliance and standardization. The Digital Personal Data Protection (DPDP) Rules notified on November 13, 2025 introduced an implementation runway through May 13, 2027, reinforcing in-country hosting and processing requirements and translating into more server deployments for enterprises and cloud providers serving Indian personal data.
On infrastructure governance, the Bureau of Indian Standards (BIS) notified voluntary standards on February 25, 2026 for cloud computing, data center performance (including Cooling Efficiency Ratio), and ethical AI design under the BIS Rules, 2018. In procurement support, data center classification above 5 MW as essential infrastructure improves access to long-tenor funding routes such as external commercial borrowings, while state-level IT/industrial policies that use single-window clearance and incentive packages compress project timelines and, in turn, server purchase cycles.
Value Chain Analysis
The India data center server value chain begins with workload planning and capacity forecasting by hyperscalers, colocation operators, enterprises, and government bodies, followed by site selection and power procurement that increasingly incorporate renewable-energy sourcing pathways. Project execution then covers design and build (civil works, MEP systems, connectivity, and security), while server hardware selection reflects density targets (GPU-ready racks, liquid cooling readiness), deployment model (hyperscale versus colocation versus edge micro-DC), and DPDP-driven governance controls.
Server supply and integration involve OEMs and ODMs, silicon and memory supply, local assembly and configuration, logistics, and channel/system integrators that bundle racks, power distribution, cooling manifolds, and DCIM/management software. On the demand side, third-party operators such as STT GDC India, Yotta Infrastructure, and CtrlS support large standardized procurement, while telecom-led edge rollouts push smaller, distributed orders that require ruggedization and remote provisioning. Operations and maintenance close the chain with spares, firmware lifecycle management, and service contracts, with component constraints (HBM, advanced packaging) and import exposure influencing lead times and platform choices.
Competitive Landscape
The supplier field is moderately concentrated. Dell, HPE, Lenovo, Cisco, IBM, and Super Micro deliver diverse form factors and firmware ecosystems that help customers standardize and automate. Indigenous players such as Netweb Technologies, VVDN, and Consistent Infosystems participate through PLI-enabled ODM models that lower import reliance and satisfy localization clauses. Channel partners increasingly bundle server hardware, liquid-cooling manifolds, and integrated DCIM licenses, easing adoption for mid-market buyers.
Energy-efficiency innovations act as differentiators. NeevCloud’s immersion-cooled racks cut PUE below 1.2, a boon in tariff-heavy metros. Super Micro promotes 8-GPU boards that mount within 2U envelopes, fitting more compute within existing data halls. ASUS integrates NVIDIA L40S GPUs inside ESC-N8-E11 chassis validated on Yotta’s Shakti Cloud. Strategic alliances multiply: TCS teams with CDAC to build a sovereign cloud that prioritizes open-hardware reference designs, while Reliance Jio collaborates with manufacturing partners to co-develop edge enclosures for 5G cells. Supply-chain constraints in HBM and PCIe switches favor vertically integrated vendors able to secure long-term silicon allocation, indirectly concentrating wallet share toward those with strong component control.
India Data Center Server Industry Leaders
Hewlett Packard Enterprise
Dell Inc.
IBM Corporation
Fujitsu Limited
Lenovo Group Limited
- *Disclaimer: Major Players sorted in no particular order


Market Opportunities and Future Outlook
Compliance-led onshoring and standardization create whitespace for vendors that can package India-ready server stacks with auditable governance controls. The DPDP Rules timeline through May 13, 2027 adds near-term urgency for regulated industries and government-adjacent workloads to expand in-country capacity, while BIS voluntary standards notified on February 25, 2026 for data centers, cloud computing, and ethical AI provide a clearer reference point for performance and operational reporting that procurement teams can use when specifying platforms and facilities.
AI and edge deployment patterns broaden opportunities beyond traditional metro hyperscale refresh cycles, especially for GPU-dense systems, high-memory configurations, and liquid-cooling-compatible designs. This is supported by the IndiaAI Mission (USD 1.2 billion earmarked to deploy 10,000 GPUs via PPPs) and Yotta's deployment of 8,192 NVIDIA H100 GPUs in Shakti Cloud. On the supply side, localization and faster fulfillment support greater domestic assembly and integrated lifecycle services, aligned with OEM efforts such as Dell stating that a majority of its servers are now manufactured locally in India, and with operators' growing requirement for partners that cover design, deployment, and ongoing maintenance across hyperscale, colocation, and edge footprints.
Recent Industry Developments
- June 2026: Dell Technologies: Dell Technologies reports majority of its servers manufactured locally in India to support domestic AI demand and enterprise modernization. The move strengthens local supply chains and aligns with incentives to boost domestic capacity, accelerating delivery for Indian hyperscalers and enterprises.
- June 2026: Hewlett Packard Enterprise: Hewlett Packard Enterprise expands Private Cloud AI factory portfolio with upcoming NVIDIA Vera CPU support to enable on-premises agentic AI deployments. The development broadens India-ready AI data center infrastructure options and advances sovereign AI capability and on-premises deployment models for Indian customers.
- June 2026: Dell Technologies: Dell Technologies modernizes NTT DOCOMO internal IT private cloud with full platform migration expected by end-2026. This demonstrates private-cloud modernization in large-scale deployments, informing demand for enterprise-grade servers and related infrastructure.


Research Methodology Framework and Report Scope
Market Definition and Coverage
This market covers the revenue generated from servers deployed in India-based data centers, across new purchases and replacement demand, valued at the point of sale in USD.
Scope exclusions: It excludes data center construction, power and cooling equipment, networking gear, and stand-alone storage systems that are not sold as part of a server configuration.
Segmentation Overview
- By Form Factor
- Blade Server
- Rack Server
- Tower Server
- Micro / Modular / Edge Server
- By Processor Architecture
- x86
- ARM
- RISC / Power
- By Deployment Model
- Hyperscale/ Cloud Service Provider
- Colocation / Wholesale
- Enterprise On-premise
- By End-User Industry
- IT and Telecommunications
- BFSI
- Government and Public Sector
- Media and Entertainment
- E-commerce and Retail
- Healthcare and Life Sciences
- Other End Users
Data Sources, Market Sizing, and Validation
Desk Research
Desk research sets the basic demand picture and helps us avoid building the model on opinions alone. We reviewed public datasets and reference series such as MeitY policy releases and Digital India updates, TRAI telecom statistics, MOSPI and RBI macro indicators, and customs trade statistics from the Government of India (DGCIS where relevant). We also used sources such as BIS standards notes, peer-reviewed papers on data center efficiency and server utilization, and public disclosures from large operators and cloud ecosystem participants.
To turn these into sizing inputs, we mapped India data center build activity and IT load additions into expected server shipments, then checked typical refresh cycles and average selling price movement for mainstream and high-density configurations. Company filings, investor presentations, and reputable press were used to validate capex direction, procurement timing, and localization signals. For faster company-level cross checks, we also referred to paid subscriptions that consolidate company financials and news, and a patent database to understand where compute architecture and acceleration trends were moving. These desk sources are illustrative, and many other public documents and datasets were also used for collection, validation, and clarification.
Primary Interviews and Surveys
Primary work was used to pressure-test the desk-based model, especially where public data is thin, delayed, or mixed across hardware categories. We spoke with a mix of data center operators, server OEM and channel-side participants, and component ecosystem experts to confirm order patterns, configuration mixes, and realized pricing by workload type. Because this is an India-focused market, inputs were balanced across major hub states and emerging tier-2 locations, so our assumptions reflect both hyperscale builds and enterprise modernization activity.
Distribution of primary research fieldwork respondents
| Company type | Respondent position |
|---|---|
| Top tier: 25% | CXOs: 15% |
| Mid tier: 57% | Functional/Unit leaders: 26% |
| Smaller Players: 18% | Managers: 59% |
Market-Sizing & Forecasting
Sizing starts with a top-down reconstruction of India server demand by translating data center capacity additions and deployment intensity into server unit needs, which are then priced using realistic configuration-level ASP ranges. To keep the totals grounded, we corroborated results with selective bottom-up checks such as channel feedback on quarterly run-rates, sampled ASP multiplied by expected unit volumes for key form factors, and supplier-side signals on lead times and allocation.
Key inputs that shaped the model included (illustratively) announced and under-construction IT load additions, rack density trends driven by AI and virtualization, typical server refresh and replacement cycles in Indian facilities, the mix shift between rack, blade, and micro/edge deployments, and processor architecture preferences that affect bill-of-materials and pricing. Where gaps appeared in the bottom-up cross checks, we used conservative interpolation based on adjacent quarters and validated the direction through follow-up calls.
For forecasting, we used scenario analysis supported by regression-based checks on a small set of macro and sector indicators (for example, data consumption growth, cloud capex direction, and facility capacity additions). Assumptions were then tuned with what interviewees expected on rollout pacing, procurement bundling, and pricing movement across mainstream and high-density builds.
Data Validation & Update Cycle
Model outputs were validated through stepwise checks so that unusual jumps are questioned before they make it into the final numbers. We compared totals against independent signals such as facility capacity additions, large project announcements, and observed procurement cycles, then reviewed variances by form factor and workload type to ensure the mix stays realistic.
Before sign-off, the model and assumptions are reviewed by another analyst, and re-contact is triggered when price or volume inputs fall outside the expected range shared by multiple respondents. Reports are refreshed annually, with interim updates when material events shift capex timing, trade conditions, or major deployment plans. Right before delivery, a final pass is completed so clients receive the latest updated view based on newly available public information.
Mordor Intelligence's India Data Center Server Market Size Measured Against Other Published Estimates
Published market sizes for India data center servers can look far apart because each publisher picks a different product basket, uses different price points, and sometimes mixes installed base thinking with new shipments. We kept the logic tied to a reproducible demand pool, then checked it with primary feedback so one-off announcements do not distort the yearly value.
Networking switches and routers are excluded from this number, which keeps the server-only total tighter in Mordor Intelligence's scope, while other published figures may bundle broader data center IT hardware and report a larger value for the same year.
Benchmark comparison
| Source | Market Size | Gaps in Research Methodology |
|---|---|---|
| Mordor Intelligence | USD 6.55 B (2025) | |
| Industry Association A | USD 5.90 B (2025) | Uses conservative refresh-cycle assumptions and prices mainstream rack servers with limited adjustment for high-density AI-oriented configurations. |
| Trade Journal B | USD 7.80 B (2025) | Likely blends adjacent data center IT hardware categories into the total and applies a broad ASP uplift without validating configuration mix through field checks. |
The spread is mainly explained by what is counted as a server versus adjacent IT hardware, and by how quickly ASPs are assumed to move as AI workloads grow. Our approach keeps inputs traceable to capacity additions, refresh timing, and confirmed configuration mix, which makes the final value easier to reconcile and update year to year.


Key Questions Answered in the Report
How large is the India data center server market in 2026?
The market is valued at USD 7.05 billion in 2026 and is forecast to reach USD 10.94 billion by 2032, reflecting a 7.61% CAGR over 2026-2032.
Which form factor leads shipments today?
Rack servers hold a 37.45% revenue share, but micro and edge servers are expanding faster at an 7.76% CAGR over 2026-2032.
What role does the DPDP Act play in server demand?
The Act forces sensitive data to remain on-shore, compelling multinationals and cloud providers to add in-country racks and full processing stacks.
Which processor architecture is growing fastest?
ARM-based servers expand at a 7.68% CAGR over 2026-2032 due to energy efficiency and state incentives for domestic assembly.
Why are edge micro-data centers gaining popularity?
5G roll-outs and latency-sensitive applications need compute close to users, resulting in an 7.89% CAGR for edge deployments over 2026-2032.
Which industry vertical shows the highest growth through 2032?
Media and entertainment projects an 7.96% CAGR over 2026-2032, propelled by OTT expansion and content-delivery optimization requirements.
Page last updated on:
- Data Center Construction Market Construction across all regions, split by tier, facility size and facility type.
- Artificial Intelligence (AI) Data Center Market Global AI facilities demand, split by facility type, component and tier.
- India Data Center Rack Market Racks in India, split by rack size, rack type and cooling compatibility.
- China Hyperscale Data Center Market China hyperscale sites, split by facility type, component and tier.
- France Hyperscale Data Center Market France hyperscale sites, split by facility type, component and tier.
- South Korea Data Center Storage Market Storage in South Korea, split by storage technology, storage type and facility type.




