
Data Center Networks Market Size and Share
Market Overview
| Study Period | 2020 - 2032 |
|---|---|
| Market Size (2026) | USD 36.17 Billion |
| Market Size (2032) | USD 95.34 Billion |
| Growth Rate (2026 - 2032) | 17.52 % |
| Fastest Growing Market | Asia Pacific |
| Largest Market | North America |
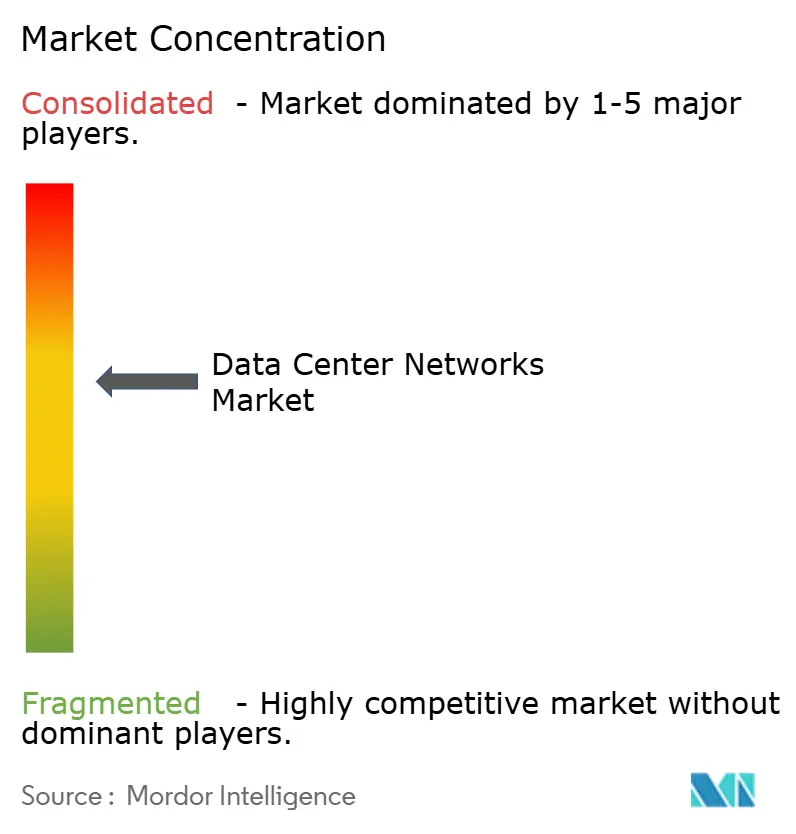
| Market Concentration | Medium |
Major Players *Disclaimer: Major Players sorted in no particular order Image © Mordor Intelligence. Reuse requires attribution under CC BY 4.0. | |
Data Center Networks Market Analysis by Mordor Intelligence
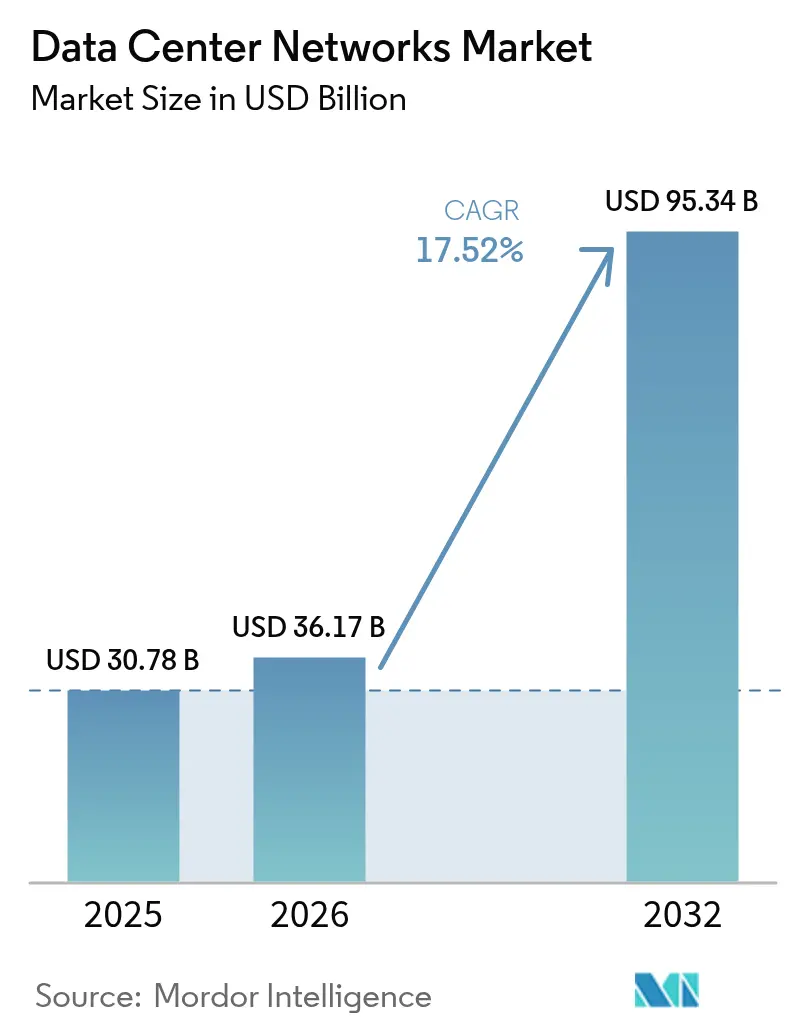
The Data Center Networks market size is expected to grow from USD 30.78 billion in 2025 to USD 36.17 billion in 2026 and is forecast to reach USD 95.34 billion by 2032 at 17.52% CAGR over 2026-2032.
Robust capital spending by hyperscale cloud providers, rapid migration to hybrid-cloud architectures, and the integration of large-scale artificial intelligence workloads are the primary forces behind this growth. Shipments of 400G and 800G optics are lowering cost-per-bit metrics, which is prompting enterprises to refresh switching fabrics at an accelerated cadence. Edge data center construction is expanding the addressable footprint for low-latency applications, while silicon photonics is improving power efficiency across optical interconnects. Consolidation among traditional equipment vendors and AI-native specialists is redefining competitive dynamics as buyers prioritize integrated, software-defined platforms over discrete hardware.
Key Report Takeaways
- By product category, Ethernet switches led with 43.82% revenue share in 2025, while optical interconnect and cabling is projected to expand at an 18.32% CAGR to 2032.
- By network architecture, spine-leaf captured 48.25% of the data center networks market share in 2025; SDN overlay solutions record the highest projected CAGR at 18.64% through 2032.
- By deployment model, hyper-scale cloud data centers accounted for 50.88% share of the data center networks market size in 2025 and edge or micro facilities are advancing at an 17.86% CAGR through 2032.
- By end-user industry, IT and telecom held 32.35% of revenue in 2025, whereas retail and e-commerce is forecast to post a 19.05% CAGR between 2026 and 2032.
Note: Market size and forecast figures in this report are generated using Mordor Intelligence’s proprietary estimation framework, updated with the latest available data and insights as of 2026.
Market Trends and Insights
Drivers Impact Analysis of Data Center Networks Market*
| DRIVER | (~) % IMPACT ON CAGR FORECAST | GEOGRAPHIC RELEVANCE | IMPACT TIMELINE |
|---|---|---|---|
| Increasing utilization of cloud storage | +4.2% | Global with concentration in North America and APAC | Medium term (2-4 years) |
| Rising need for data back-up and restoration | +3.1% | Global, particularly BFSI and Healthcare | Short term (≤ 2 years) |
| Growth in retail and e-commerce data traffic | +3.8% | Global with highest impact in APAC and North America | Medium term (2-4 years) |
| Surge in global IP traffic from IoT and video | +4.5% | Global with early adoption in developed markets | Long term (≥ 4 years) |
| Rapid adoption of 400G/800G optics lowers USD/bit | +2.9% | North America and Europe, expanding to APAC | Short term (≤ 2 years) |
| Edge data center build-outs for low-latency apps | +3.7% | Global with focus on urban centers | Medium term (2-4 years) |
| Source: Mordor Intelligence | |||
Increasing Utilization of Cloud Storage
Hybrid and multi-cloud strategies are reshaping traffic flows inside and between facilities. Operators now twin spine-leaf fabrics with 25G and 100G uplinks to meet parallel object-storage I/O requirements. Lumen Technologies doubled intercity fiber to back AI-driven demand, underscoring the link between cloud storage growth and network upgrades.[1]Lumen Technologies, “AI Demand Drives USD 5 Billion in New Business,” lumen.com Continuous scaling pressures are tilting designs toward leaf-spine topologies that minimize oversubscription and keep latency predictable.
Surge in Global IP Traffic from IoT and Video
Industrial IoT sensors, medical devices, and smart-city endpoints now stream data that must be ingested at edge nodes for real-time analytics. At the same time, high-definition video accounts for the majority of consumer traffic. Lumentum’s 300 × 300-port optical switch highlights the scale of interconnect density being adopted to keep pace with this surge.[2]Converge Digest, “Lumentum Debuts 300×300-Port Optical Switch,” convergedigest.com Intelligent traffic-management systems are therefore becoming mandatory for bandwidth arbitration across mixed workload profiles.
Growth in Retail and E-Commerce Data Traffic
Personalized recommendation engines and flash-sale events create bursty, unpredictable loads. Colony Brands achieved elastic scaling during peak shopping seasons through an Equinix-AWS hybrid model, proving the efficiency of on-demand capacity augmentation. Retailers now insist on converged fabrics that handle transactional queries and AI inference within the same cluster, lowering infrastructure duplication.
Rapid Adoption of 400G/800G Optics Lowers USD/bit
More than 20 million 400G and 800G modules are slated for shipment in 2024. Economies of scale have cut cost per bit sharply, allowing million-GPU clusters to be networked economically. Co-packaged optics add further power savings of 3.5 ×, freeing rack budgets otherwise allocated to cooling.[3]Co-packaged optics add further power savings of 3.5 ×, freeing rack budgets otherwise allocated to cooling.
Restraints Impact Analysis of Data Center Networks Market*
| RESTRAINTS | (~) % IMPACT ON CAGR FORECAST | GEOGRAPHIC RELEVANCE | IMPACT TIMELINE |
|---|---|---|---|
| Shortage of skilled network professionals | -2.8% | Global, acute in North America and Europe | Long term (≥ 4 years) |
| High capex for next-gen switching fabric | -3.2% | Global with higher impact on SMEs | Medium term (2-4 years) |
| Security and compliance risks in SDN overlays | -1.9% | Global, regulatory focus in Europe and North America | Short term (≤ 2 years) |
| Advanced-chip supply-chain volatility | -2.1% | Global with manufacturing concentration in APAC | Medium term (2-4 years) |
| Source: Mordor Intelligence | |||
Shortage of Skilled Network Professionals
AI-native fabrics require expertise spanning silicon photonics, intent-based policy, and multi-cloud orchestration. Juniper’s Apstra shows that automated intent engines can reduce provisioning cycles by 85%, highlighting automation as a direct response to talent gaps. Training investments and low-code operational tools continue to grow as enterprises try to mitigate staffing risk.
High Capex for Next-Gen Switching Fabric
800G-capable equipment demands higher power densities and specialized cooling. Cisco’s Nexus Hyperfabric tackles financing barriers by delivering the switching plane as a cloud-controlled service, shifting spend from capital to operating budgets. Service-based acquisition models are therefore gaining traction among small and mid-size enterprises that cannot absorb large upfront outlays.
*Our forecasts treat driver/restraint impacts as directional, not additive. The impact forecasts reflect baseline growth, mix effects, and variable interactions.
Data Center Networks Market Segment Analysis
By Product:
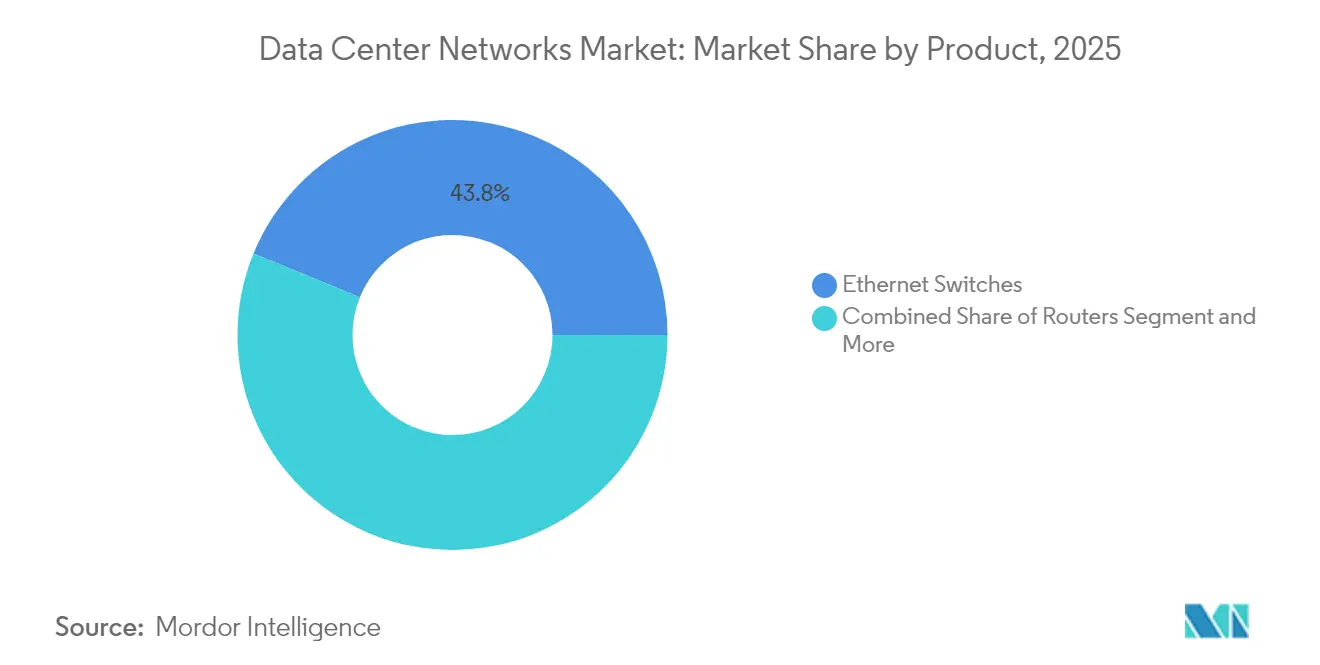
AI Workloads Drive Ethernet Switch DominanceEthernet switches contributed 43.82% revenue in 2025, reflecting their status as the backbone of GPU training clusters. Several 102.4 Tb/s devices entered volume production this year, elevating port density without expanding rack footprint. Optical interconnect and cabling is the fastest riser with an 18.32% CAGR through 2032, powered by co-packaged optics that deliver 3.5 × power efficiency improvements. Integration of switching, routing, and firewall functions inside unified appliances is also emerging, enabling zero-trust enforcement at line rate.
Continuous ASIC innovation is reshaping vendor hierarchies. NVIDIA’s Spectrum-X made its commercial debut in March 2025, merging photonics and Ethernet switching in a single platform. These dynamics are narrowing differentiation based purely on throughput and shifting focus toward software feature sets and energy efficiency. The data center networks market continues to reward suppliers that can couple hardware advances with cloud-based operational tooling.



By Network Architecture:
Spine-Leaf Topology Reshapes Data Center DesignSpine-leaf held 48.25% market share in 2025 owing to predictable latency and linear scale characteristics. The architecture eliminates single-tier choke points by creating equal-cost paths between every leaf and spine, which aligns with microservices traffic patterns that dominate east-west directions. SDN overlays post the fastest growth at 18.64% CAGR as enterprises centralize control across multi-vendor underlays.
Three-tier designs remain in brownfield installations where refurbishment budgets are constrained. Mesh or hyper-scale custom topologies serve niche AI factories demanding sub-microsecond hop latency. Intent-based provisioning is being layered on top of all designs, reducing manual errors and fostering compliance. The data center networks market size for SDN overlays is poised to benefit as organizations prioritize agility over fixed-function hardware investments.
By Deployment Model:
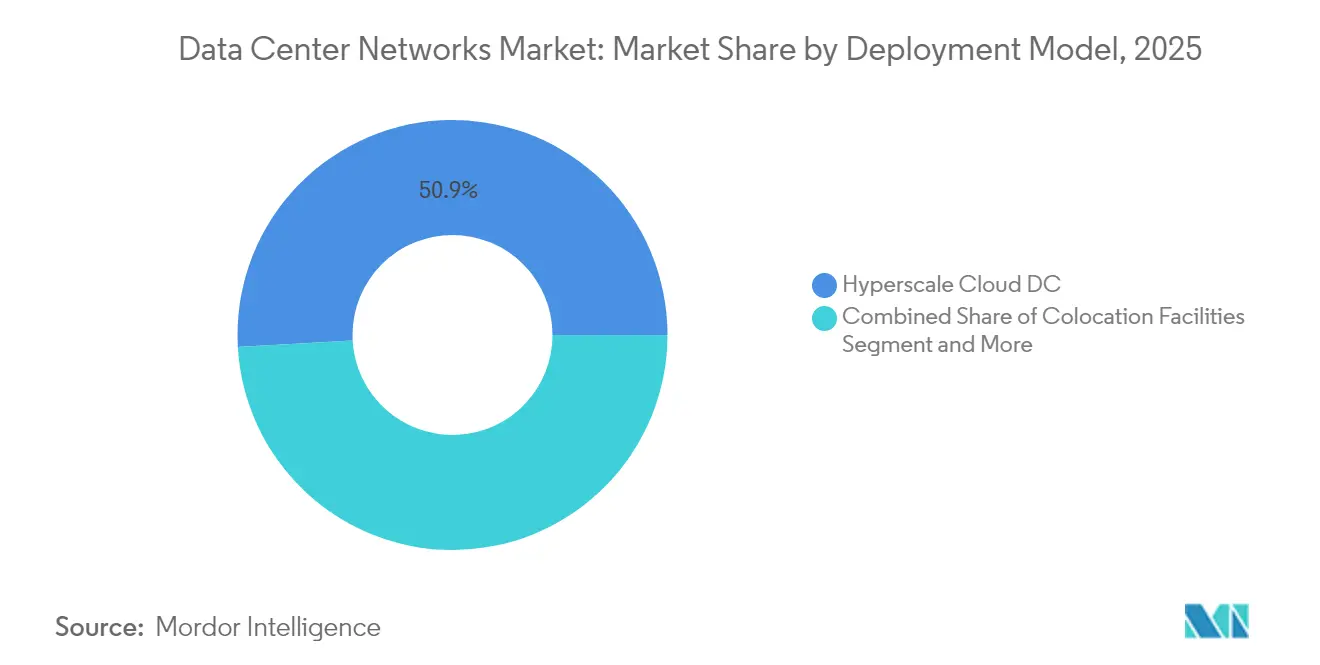
Hyper-Scale Dominance Faces Edge Computing ChallengeHyperscale cloud operators accounted for 50.88% revenue in 2025. Their influence is visible in the adoption speed of each new optics generation and the preference for open, disaggregated hardware. Edge and micro data centers are the fastest-growing cohort at 17.86% CAGR, enabled by modular designs that can be sited closer to users without compromising redundancy. The data center networks market size for edge facilities will expand further as autonomous systems and immersive applications mature.
On-premises enterprise sites endure where data sovereignty or deterministic latency is non-negotiable. Colocation facilities bridge the gap, letting tenants combine private gear with carrier-neutral connectivity matrices. Operators now integrate telemetry feeds from all three deployment models into a single dashboard, improving fault isolation and life-cycle planning.
By End-User Industry:
IT and Telecom Leadership Challenged by Retail GrowthIT and telecom represented 32.35% of 2025 revenue because service providers both consume and resell connectivity. Retail and e-commerce, however, is on track for a 19.05% CAGR through 2032, driven by AI-centric recommendation engines and omnichannel fulfillment. BFSI continues to refresh low-latency fabrics that support real-time trading and regulatory mandates. Healthcare and public-sector agencies are digitizing records and citizen services, injecting incremental demand for secure, high-throughput fabrics.
The data center networks market share tilt toward consumer-facing verticals is prompting vendors to tailor outcome-based offerings. For instance, headquarters-holistic security bundles resonate with financial institutions, while edge-ready micro-modules resonate with retailers operating in malls and logistics hubs.
Geography Analysis
North America Data Center Networks Market
North America leads the data center networks market due to the presence of Amazon Web Services, Microsoft Azure, and Google Cloud. Meta committed USD 65 billion for new AI-ready campuses and Equinix secured USD 15 billion for AI-optimized facilities, accelerating domestic demand. Canada is capitalizing on abundant renewable energy, making several provinces attractive for new hyperscale sites.
Europe Data Center Networks Market
Europe follows with Germany at the forefront. Energy-efficiency legislation compels operators to adopt power-lean optical fabrics, boosting upgrade cycles. The United Kingdom focuses on sub-millisecond trading networks that require deterministic switching and granular telemetry.
APAC, South America and MEA Data Center Networks Market
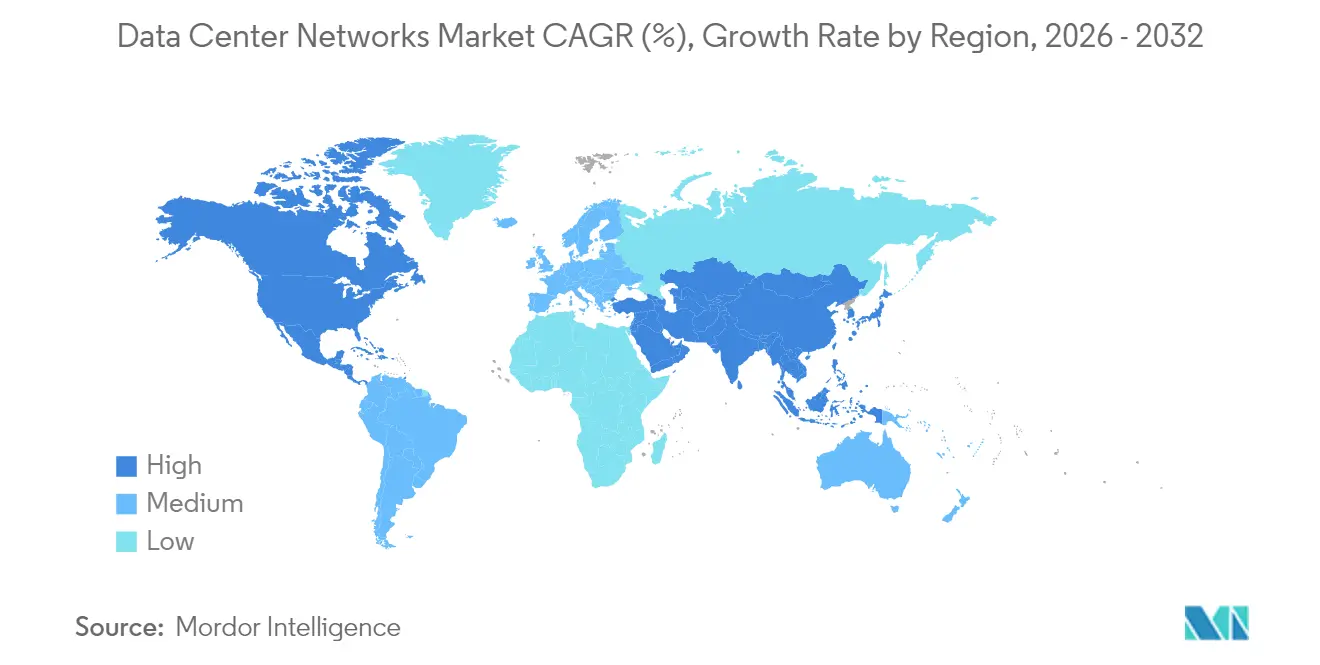
Asia-Pacific is the fastest mover as China, India, and Indonesia channel sovereign-cloud incentives into new builds. Edge computing hotspots are emerging in populous metros to support 5G and IoT services. South America plus Middle East and Africa are nascent yet rising; internet-penetration gains and digital-transformation projects set the groundwork for double-digit regional growth rates.

Regulatory Landscape
Data center network design and procurement are increasingly shaped by cybersecurity, data-governance, and sustainability reporting rules that apply to digital infrastructure. In the European Union, the Data Act became applicable on September 12, 2025, reinforcing requirements around data access and switching for connected products and related data processing services. This, in turn, affects how providers architect multi-tenant platforms, telemetry, and portability across hybrid environments. In parallel, the NIS2 Directive expanded cybersecurity and incident-reporting obligations through national transpositions during 2025. That has raised expectations for operational resilience controls that extend into SDN overlays, management planes, and interconnection services.
In the United States, new transparency and metrology efforts are emerging around large-load facilities. S. 4213 (Data Center Water and Energy Transparency Act of 2026) was introduced in March 2026 and targets annual reporting for data centers at or above 25 MW peak demand, including energy and water metrics such as PUE. Relatedly, H.R. 9372 directs NIST to develop standardized methodologies and best practices for measuring data center energy and water use, explicitly including AI-related compute loads. These policy directions increase emphasis on auditable monitoring, standardized measurement, and supply-chain documentation, influencing network equipment choices (power profiles, optics efficiency) and operational tooling (telemetry, compliance reporting, and change control).
Value Chain Analysis
The value chain starts with silicon and optics inputs (merchant switch ASICs, NIC/DPUs, optical DSPs, lasers, and transceivers), moves through OEM/ODM manufacturing and system integration (Ethernet switches, routers, security appliances, and optical interconnect/cabling), and then flows into channel partners, cloud/colocation procurement, and enterprise or vertical deployments. On the demand side, hyperscalers and large colocation operators increasingly drive specifications for high-radix switching, 400G/800G interconnect, and rack-scale designs. Enterprises typically consume these solutions through integrated platforms, including SDN overlays and intent-based operations, to reduce provisioning time and the skills burden.
Bottlenecks concentrate upstream, particularly around advanced switch silicon availability, optical DSP capacity, and high-volume transceiver supply for 800G class links. This affects lead times and strengthens multi-sourcing strategies. The value chain is also reflecting deeper disaggregation, as major cloud operators (for example, Meta, Microsoft, and Google) design more white-box hardware and rely on interoperable network operating systems. As a result, value shifts toward software, automation, and validation rather than proprietary chassis alone. As co-packaged optics enters early volume ramps (notably cited for 2026), the chain expands further to include tighter co-design among switch silicon vendors, optics module suppliers, and thermal or liquid-cooling ecosystem partners to meet AI fabric density and power constraints.
Competitive Landscape
Vendor concentration is moderate. NVIDIA surpassed Cisco and Arista in datacenter Ethernet revenue during 2025, signaling the ascension of AI-native networking. Hewlett Packard Enterprise closed a USD 14 billion acquisition of Juniper Networks in July 2025, merging edge and AI operating-system capabilities into a single portfolio.
Competition pivots on software features such as intent-based policy engines, cloud-managed provisioning, and AI-driven telemetry. Juniper’s Apstra showcases double-digit reductions in both operational expense and outage frequency. Enfabrica entered the scene with an Ethernet-based AI memory fabric that bypasses CPU bottlenecks, introducing new design alternatives for high-performance clusters.
Vendor roadmaps now emphasize energy proportionality and compliance transparency. IEEE 802.3 compatibility and open compute standards are non-negotiable for hyperscale buyers that pursue multi-sourcing to lower procurement risk. Strategic alliances such as the Cisco-NVIDIA AI Ethernet partnership illustrate the shift toward ecosystem-level competition.
Data Center Networks Industry Leaders
Cisco Systems Inc.
Juniper Networks Inc.
Arista Networks Inc.
H3C Holding Limited
VMware Inc
- *Disclaimer: Major Players sorted in no particular order
Data Center Networks Market Companies Covered in this Report
- Cisco Systems Inc.
- Juniper Networks Inc.
- Arista Networks Inc.
- Huawei Technologies Co. Ltd.
- Dell Technologies Inc.
- Hewlett Packard Enterprise Co. (HPE)
- Extreme Networks Inc.
- NVIDIA Corporation (NVIDIA Networking)
- Broadcom Inc.
- VMware Inc.
- Lenovo Group Ltd.
- NEC Corporation
- Pluribus Networks
- Edgecore Networks Corporation
- Super Micro Computer Inc. (Supermicro)
- Quanta Cloud Technology (QCT)
- Fortinet Inc.
- Cumulus Networks (NVIDIA)
- Chelsio Communications Inc.
- H3C Holding Limited
- Inspur Group Co. Ltd.

Market Opportunities and Future Outlook
AI-driven data center build-outs are pushing operators toward new fabric designs and higher-speed Ethernet generations, creating whitespace across switching platforms, optics, and operations software. Hyperscalers are publicly describing architecture shifts that raise requirements for port density, topology-aware control planes, and automated operations. Amazon Web Services described quasi-random wiring (RNG) as the default architecture for most new AWS data centers (April 2026), and Google Cloud introduced the Virgo Network, a flat two-layer megascale fabric (April 2026). Meta also presented its Matryoshka production-scale data center network design system at USENIX NSDI 26 (May 2026), pointing to co-design across topology, routing, and operations for large AI clusters.
Network hardware and optics roadmaps are also opening upgrade pathways within existing spine-leaf environments. The market is moving from 400G toward 800G and into 1.6T-class switching, with early volume ramps for co-packaged optics in 2026. This targets rack power and thermal ceilings where pluggable optics become limiting. With Ethernet extending deeper into AI back-end and scale-up use cases, opportunities center on (i) rack-scale Ethernet systems that combine switching, telemetry, and security policy, (ii) optical interconnect and cabling refresh cycles tied to 800G deployments, and (iii) software layers (SDN overlays, intent-based networking, and AIOps) that reduce operational load as fabrics become flatter and more interconnected across hybrid-cloud and edge footprints.
Recent Industry Developments in Data Center Networks Market
- June 2026: Arista Networks launched the 7060XE7 Series, a 1.6T networking platform portfolio for rack-scale AI infrastructure, built around Broadcom Tomahawk 6 silicon and offered with air, liquid, and hybrid cooling options. The launch tightens the competitive cycle around 1.6T Ethernet switching and shifts buyer evaluation toward thermals, power delivery, and deployability in dense AI racks.
- October 2025: Arista Networks introduced its R4 Series platforms for AI and data center deployments, including 7800R4 modular systems and 7020R4 Ethernet switches, with configurations scaling up to 576 ports of 800GbE. This expanded the addressable design space for 800G leaf-spine fabrics and provided operators with higher port density without expanding rack footprint.
- February 2025: Cisco announced N9300 Series Smart Switches that integrate AMD Pensando DPUs and Cisco Hypershield to embed networking and security services directly into the data center fabric. The approach supports converged architectures where segmentation and zero-trust enforcement are applied closer to workloads, reducing dependence on standalone security appliances and simplifying policy deployment at scale.


Data Center Networks Market Report Scope and Research Methodology
Market Definition and Coverage
This market covers the revenue earned from networking hardware and related software used inside data centers to move traffic reliably and at high speeds. It includes switches, routers, and storage area networking (SAN) equipment when they are purchased for data center connectivity.
Scope exclusions: We exclude general telecom carrier networks and end-user LAN and Wi-Fi spend that is not purchased for data center networking use.
Segments Covered in This Report
- By Product
- Ethernet Switches
- Routers
- Storage-Area-Network (SAN) Equipment
- Optical Interconnect and Cabling
- Network Security Appliances
- By Network Architecture
- Spine–Leaf
- 3-Tier (Core/Agg/Access)
- Mesh / Hyper-scale Custom
- Software-Defined Networking (SDN) Overlay
- By Deployment Model
- Colocation Facilities
- Hyper-scale/Self-built Facilities
- On-Premises Enterprise /Edge / Micro-Data-Centers
- By End-User Industry
- IT and Telecom
- BFSI
- Healthcare
- Retail and E-commerce
- Government and Defense
- Energy and Utilities
- Other End User
- Geography
- North America
- United States
- Canada
- Mexico
- Europe
- Germany
- United Kingdom
- Rest of Europe
- Asia-Pacific
- China
- India
- Rest of Asia-Pacific
- South America
- Middle East and Africa
- North America
Data Sources, Market Sizing, and Validation
Desk Research
Desk work starts with building a clean fact base on data center buildouts and network equipment demand. We review public sources such as the US Census Bureau and the US International Trade Commission for trade flows, International Telecommunication Union releases for traffic and connectivity indicators, and standards bodies such as IEEE and IETF publications to ground technical adoption cycles. For deployment and supply signals, we also use sources such as SEC filings, annual reports, investor presentations, reputable press releases, and product documentation from suppliers and operators.
To avoid over relying on any single public series, we cross-check volumes and price direction using patent databases and import and export shipment-level databases. We then map findings into the market categories used in the model. When the same metric is reported differently across sources, we prefer the more directly measurable series and use the rest as reasonableness checks. These desk research sources are illustrative only, and many other public and paid references were also used for data collection, validation, and clarification.
Primary Interviews and Surveys
Primary work is used to confirm what is actually being bought for data center networks, and how budgets move across refresh cycles and new capacity adds. We speak with network equipment suppliers, distributors and integrators, colocation operators, cloud and enterprise data center teams, and channel experts across APAC, EMEA, and the Americas, so assumptions from desk research can be checked and adjusted.
Distribution of primary research fieldwork respondents
| Company type | Respondent position | Region |
|---|---|---|
| Top tier: 35% | CXOs: 13% | APAC: 46% |
| Mid tier: 49% | Functional/Unit leaders: 34% | EMEA: 35% |
| Smaller Players: 16% | Managers: 53% | Americas: 19% |
Market-Sizing & Forecasting
Sizing uses a top-down build where data center capacity additions and workload growth signals are translated into networking equipment demand, then converted to value using realistic price bands by product class. The model is anchored on market fingerprints such as data center capacity growth, interconnect and east-west traffic intensity, typical switch and router refresh cycles, higher-speed port adoption, and the mix shift between enterprise, colocation, and hyperscale builds. Because the same data center can be upgraded without adding new floor space, upgrade intensity is treated as a separate driver in the demand pool.
Once the top-down totals are formed, we corroborate them with selective bottom-up approximations, including supplier and channel checks on unit shipments and sampled average selling price ranges across key switch, router, and SAN categories. Where coverage is thinner for smaller markets or niche architectures, we handle gaps through proxy ratios tied to data center build indicators, then review them with interview feedback. Forecasting is done using scenario analysis supported by regression-style relationships between capacity adds, traffic growth, and speed mix. The final path is aligned to what practitioners expect for procurement cycles and upgrade timing.
Data Validation & Update Cycle
Outputs are validated by comparing results with independent signals such as reported capex direction from operators, trade and shipment movement, and the implied equipment intensity per unit of capacity added. If a segment shows a jump that cannot be explained by capacity, refresh, or speed-mix changes, we recheck the underlying assumptions and re-contact experts before sign-off. Reviews are completed in more than one analyst pass so calculation logic, currency handling, and year mapping stay consistent.
The report is refreshed annually, and interim updates are made when material events change demand or pricing patterns. Before delivery, we do a final freshness check across key variables so clients receive an updated view that matches the latest available evidence.
Mordor Intelligence's Data Center Networks Market Size Versus Other Published Estimates
Published market sizes for data center networks often vary because each publisher draws the line differently on what counts as data center networking, which year is treated as the base, and how price declines or speed upgrades are modeled. Differences also show up when one estimate relies more on vendor commentary, while another relies more on infrastructure build indicators.
Key gap drivers in this market usually come down to whether SAN is included alongside Ethernet switching and routing, how software overlays are treated, and whether services are counted inside the market value. Currency conversion timing also matters because equipment is sold globally and pricing shifts quickly, and older pages can miss newer high-speed adoption waves that lift value even when unit counts do not rise as much.
Benchmark comparison
| Source | Market Size | Gaps in Research Methodology |
|---|---|---|
| Mordor Intelligence | USD 30.78 B (2025) | |
| Global Consultancy A | USD 43.54 B (2025) | This figure appears to use a broader equipment bundle for data center networking, which can pull in adjacent connectivity products and software that are not always purchased as core DC network gear. It also references a different base-year setup (2024 anchored) that can change the 2025 roll-forward. |
| Trade Journal B | USD 45.80 B (2025) | This estimate is likely built as a wider technology market view, and it may include a larger set of network technologies and value pools. It can also reflect a different cut of services and regional conversions, which can lift the 2025 value versus a narrower equipment-first scope. |
The table shows a clear spread in 2025 values. In Mordor Intelligence's model, SAN, switches, routers, and other data center network products are counted as the core value pool, with architecture and deployment splits used mainly to allocate demand rather than to expand scope. When the scope stays tied to what data centers buy for internal networking, and inputs like refresh cycles and speed mix are checked with real procurement feedback, the result is easier to trace and repeat year to year.


Key Questions Answered in the Report
What is the current value of the global data center networks market?
The market is valued at USD 36.17 billion in 2026.
How fast is the market expected to grow?
It is forecast to post a 17.52% CAGR and reach USD 95.34 billion by 2032.
Which product category leads revenue share?
Ethernet switches hold 43.82% of 2025 revenue.
Which network architecture is most widely adopted?
Spine-leaf designs captured 48.25% share in 2025.
Why are 400G and 800G optics important?
They cut cost per transmitted bit and enable million-GPU AI clusters.
Which region is the fastest growing?
Asia-Pacific is expanding the quickest due to large-scale cloud and edge investments.
Page last updated on:
- United States Data Center Networking Market
- India Data Center Networking Market
- Hong Kong Data Center Networking Market
- Canada Data Center Networking Market
- Germany Data Center Networking Market
- Mexico Data Center Networking Market
- Italy Data Center Networking Market
- Middle East Data Center Networking Market
- Data Center Server Market Servers across all regions, split by tier, facility size and facility type.
- Data Center Cooling Market Global cooling demand, split by cooling technology, cooling component and facility type.
- Data Center Construction Market Global construction demand, split by tier, facility size and facility type.
- Data Center Switch Market Switches across the global market, covering switch type, bandwidth class and switching technology.
- North America Data Center Server Market North America's servers, split by data-center tier, form factor and application / workload.





