
Europe Data Center Server Market Size and Share
Market Overview
| Study Period | 2020 - 2031 |
|---|---|
| Forecast Data Period | 2026 - 2031 |
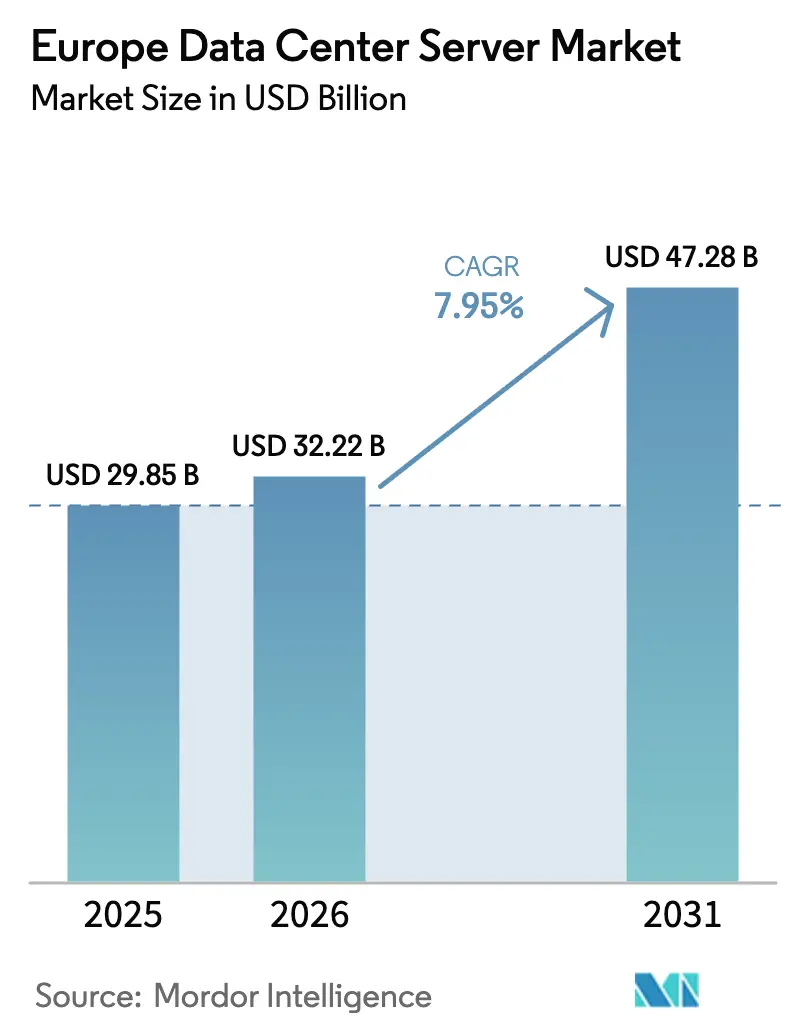
| Base Year Market Size (2025) | USD 29.85 Billion |
| Market Size (2026) | USD 32.22 Billion |
| Market Size (2031) | USD 47.28 Billion |
| Growth Rate (2026 - 2031) | 7.95 % |
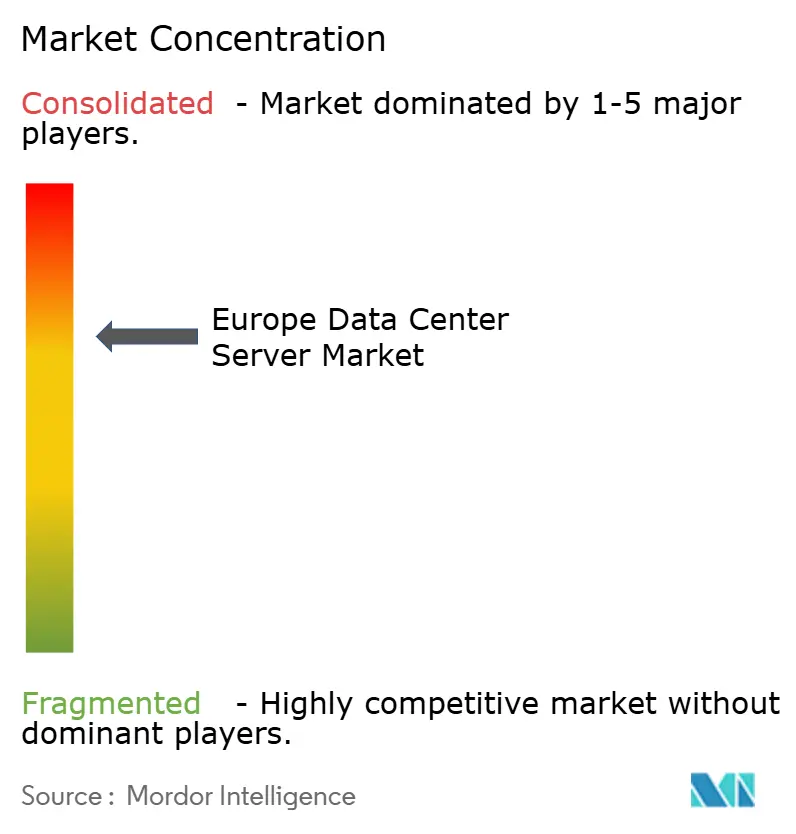
| Market Concentration | Medium |
Major Players *Disclaimer: Major Players sorted in no particular order Image © Mordor Intelligence. Reuse requires attribution under CC BY 4.0. | |
Europe Data Center Server Market Analysis by Mordor Intelligence
The Europe data center server market size is expected to grow from USD 29.85 billion in 2025 to USD 32.22 billion in 2026 and is forecast to reach USD 47.28 billion by 2031 at 7.95% CAGR over 2026-2031. Demand is accelerating as hyperscalers, telecom operators, and enterprises deploy AI-optimized infrastructure, refresh legacy estates, and comply with new EU sustainability mandates. GPU-dense designs, liquid cooling, and edge nodes are reshaping procurement patterns, while the EU Data Act and national sovereignty programs promote in-region compute. Supply-chain tightness for advanced GPUs has lifted lead times well beyond 52 weeks, forcing hybrid sourcing strategies. Meanwhile, rising power costs and land scarcity in FLAPD hubs (Frankfurt, London, Amsterdam, Paris, Dublin) channel new-build activity toward Central & Eastern Europe and Nordic sites.
Key Report Takeaways
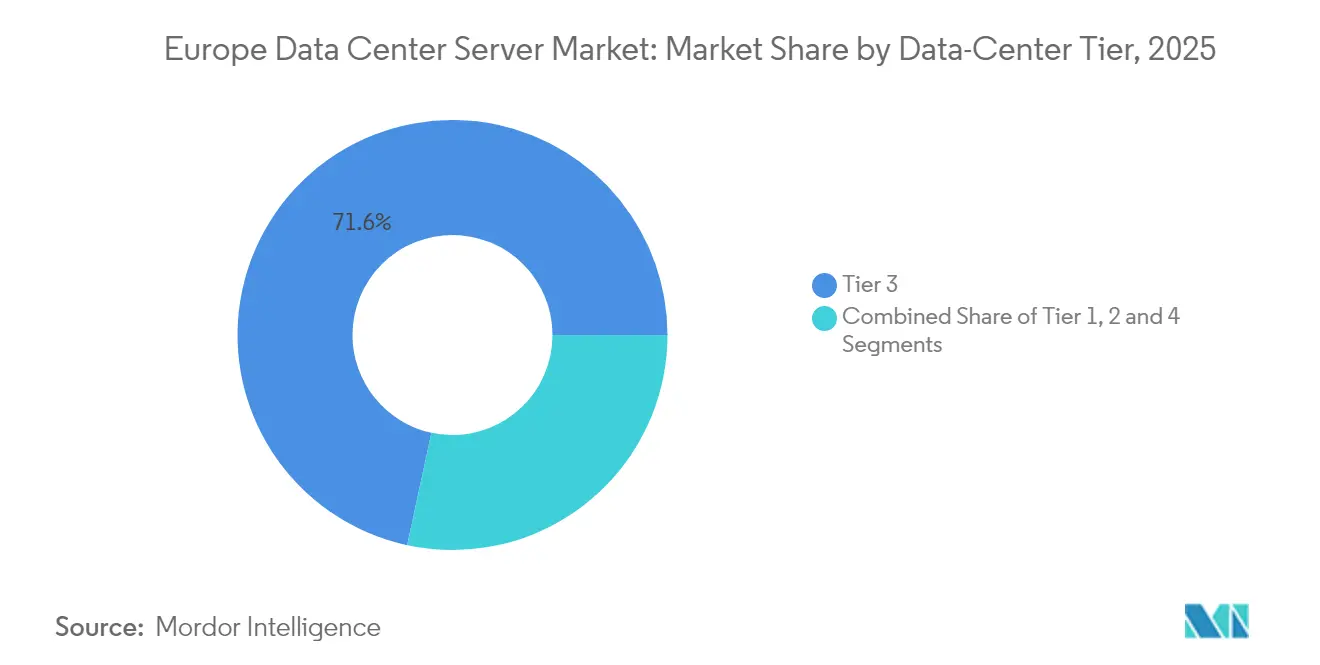
- By data-center tier, Tier 3 led with 71.62% of Europe data center server market share in 2025; Tier 4 is forecast to expand at a 9.98% CAGR to 2031.
- By form factor, half-height blades held 63.85% revenue share in 2025; quarter/micro blades record the highest projected CAGR at 8.35% through 2031.
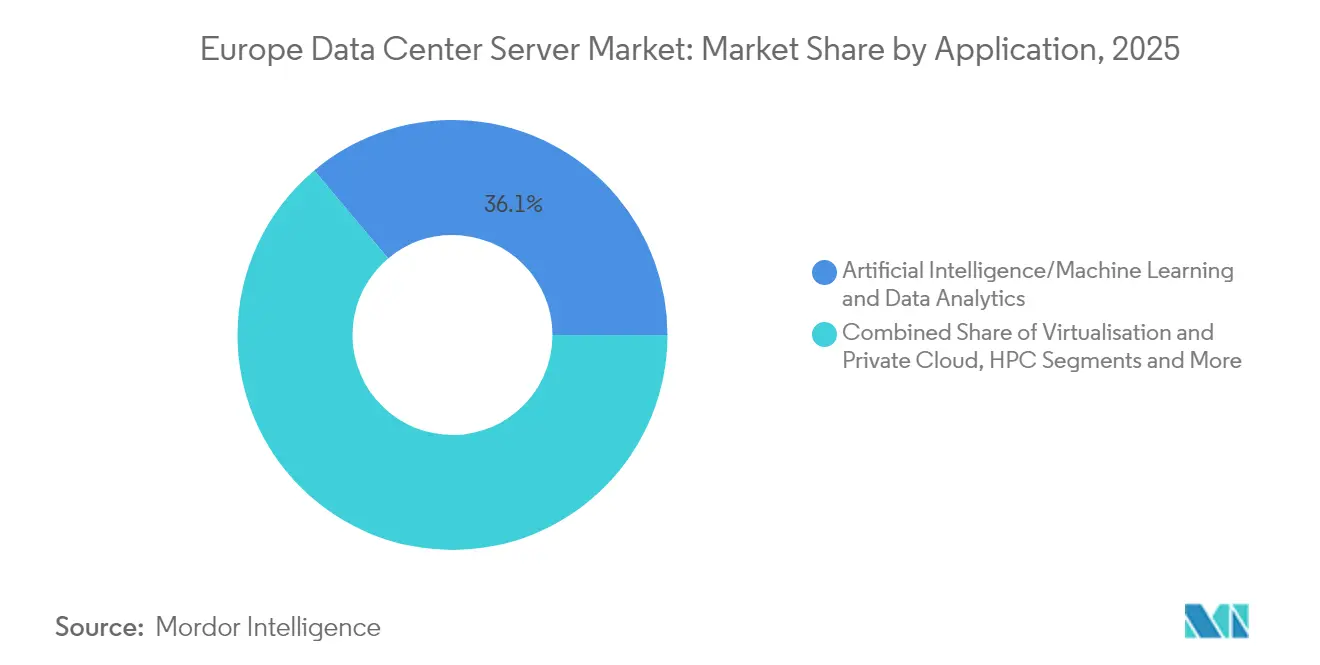
- By application, AI/ML workloads accounted for 36.12% share of the Europe data center server market size in 2025, while virtualization/private cloud advances at an 8.06% CAGR to 2031.
- By data-center type, colocation facilities captured 53.12% revenue share in 2025; hyperscaler/cloud providers are growing fastest at 8.72% CAGR.
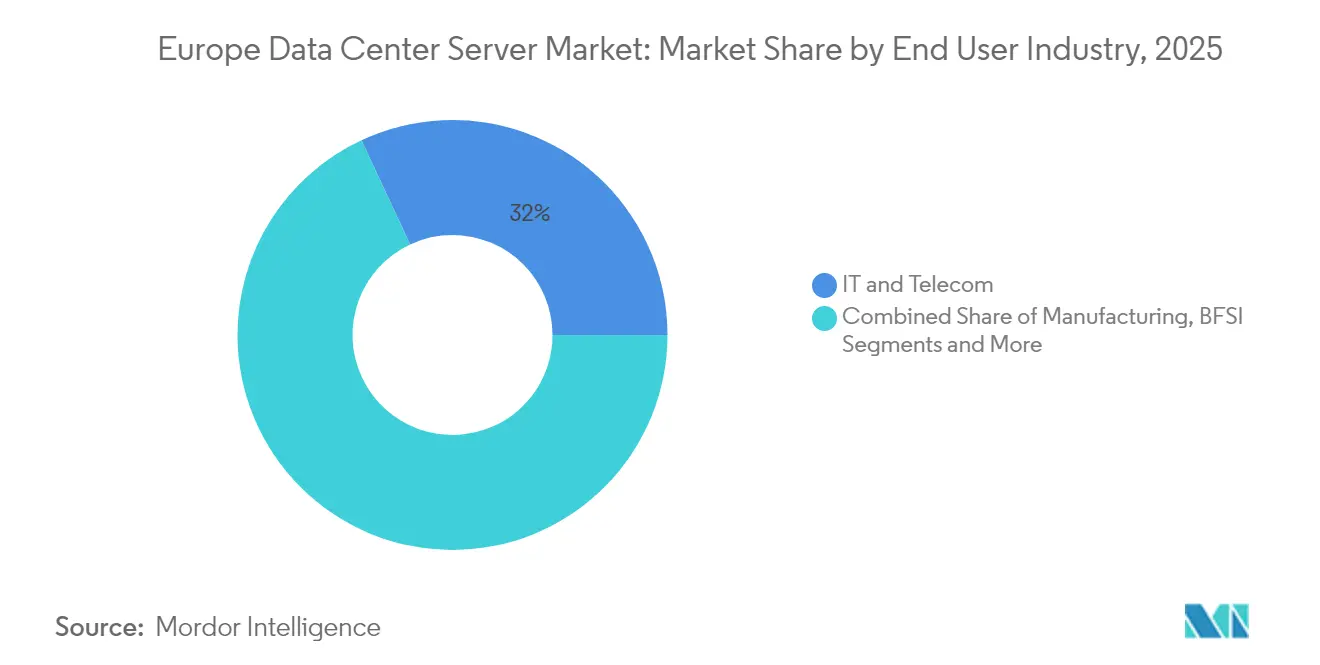
- By end-use industry, IT & telecom commanded 31.96% share in 2025; manufacturing and Industry 4.0 register the quickest growth at 9.14% CAGR.
- By Country, Germany held 24.78% of Europe data center server market size in 2025; Poland is the fastest-growing market at a 10.22% CAGR.
Note: Market size and forecast figures in this report are generated using Mordor Intelligence’s proprietary estimation framework, updated with the latest available data and insights as of 2026.
Europe Data Center Server Market Trends and Insights
Drivers Impact Analysis*
| Driver | (~)% Impact on CAGR Forecast | Geographic Relevance | Impact Timeline |
|---|---|---|---|
| Adoption of cloud computing and X-as-a-Service | +2.1% | Global, with FLAPD markets leading | Medium term (2-4 years) |
| Rapid commercial roll-out of 5G and edge nodes | +1.8% | Germany, Netherlands, Nordic region | Short term (≤ 2 years) |
| Hyperscale refresh cycle toward GPU/AI servers | +2.5% | France, Germany, UK core markets | Short term (≤ 2 years) |
| EU Green Deal incentives for liquid-cooled racks | +1.2% | EU-wide, Nordic emphasis | Long term (≥ 4 years) |
| Sovereign AI / EU Data Act pushing in-region compute | +1.9% | France, Germany, Netherlands | Medium term (2-4 years) |
| Rise of modular, prefabricated micro-data-centers | +0.9% | Edge markets, secondary cities | Long term (≥ 4 years) |
| Source: Mordor Intelligence | |||
Cloud computing & X-as-a-Service adoption
Hyperscalers are building region-specific availability zones, driving sustained demand for rack-scale servers. Microsoft confirmed three new data centers in Northern France, while AWS formed a standalone European Sovereign Cloud entity to satisfy residency rules aws.amazon.com. Dutch operators estimate that data centers now add 7.6% to the national GDP due to such activity. [1]European Commission, “EU Edge Observatory,” europeancommission.europa.eu Enterprise case studies, such as Uniper’s migration of 10,000 employees to Azure, resulting in 50% fewer IT incidents, illustrate tangible operational gains.
5G rollout & edge nodes
Operators deploy micro-data-centers at base-station sites to meet sub-20 ms latency targets under the EU Edge Observatory program. Ericsson’s private 5G network at Calpak’s Greek solar-heater plant shows manufacturing use cases, while German Edge Cloud powers Rittal’s Industry 4.0 factory with 250+ networked machines.
Hyperscale refresh toward GPU/AI servers
Dell logged USD 12.1 billion in AI-optimized server orders during Q1 2025, reflecting corporate urgency to train generative models.[2]Dell Technologies, “Q1 FY 2026 Results,” dell.comHPE secured a USD 1 billion contract to build Elon Musk’s X platform AI cluster, underscoring single-deal scale. NVIDIA is shipping Blackwell systems that will deliver 3,000 exaflops across four EU countries, Europe’s largest coordinated AI build-out.
EU Green Deal incentives for liquid cooling
Operators can claim energy-efficiency tax breaks when PUE improves, catalyzing the adoption of immersion systems. GlobalConnect’s submerged solution cuts power use by 90% and shrinks footprint 80% globalconnect.dk. OVHcloud reports a 1.28 PUE with hybrid water-immersion loops, well below the 1.55 regional average.
Restraints Impact Analysis*
| Restraint | (~)% Impact on CAGR Forecast | Geographic Relevance | Impact Timeline |
|---|---|---|---|
| Escalating CapEx for new facilities | -1.8% | High-cost markets: London, Frankfurt, Amsterdam | Short term (≤ 2 years) |
| Volatile electricity & carbon prices | -1.4% | Germany, UK, industrial regions | Medium term (2-4 years) |
| Supply-chain squeeze on advanced GPUs/CPUs | -2.1% | Global impact, acute in AI-focused deployments | Short term (≤ 2 years) |
| Stricter waste-heat reuse & PUE regulations | -0.7% | EU-wide, Nordic region leading compliance | Long term (≥ 4 years) |
| Source: Mordor Intelligence | |||
Escalating CapEx for new facilities
Land costs for 50-acre plots in tier-1 hubs climbed 23% in 2025, while power-allocation queues exceed 36 months.[3]Cushman & Wakefield, “2025 Global Data Center Construction Costs,” cushmanwakefield.comVantage Data Centers tapped a EUR 720 million (USD 829.16 million) securitization to fund four German builds, showcasing creative financing. Labor scarcity also inflates budgets, prompting developers to pivot toward Poland and Spain where costs remain 15-20% lower.
Supply-chain squeeze on advanced GPUs/CPUs
NVIDIA H100/H200 substrates are concentrated in Taiwan and Japan, elevating geopolitical risk. High-bandwidth memory demand could reach USD 21 billion in 2025, crowding out legacy component lines. A grey market has emerged, with secondary prices exceeding MSRP by 70%, pushing enterprises to dual-source and lock in multi-year supply agreements.
*Our forecasts treat driver/restraint impacts as directional, not additive. The impact forecasts reflect baseline growth, mix effects, and variable interactions.
Segment Analysis
By Data-Center Tier: Tier 3 Dominance Drives Reliability Standards
Tier 3 facilities accounted for 71.62% of Europe data center server market share in 2025, a testament to their cost-to-resilience balance. Financial institutions accelerated upgrades after recent outages, adopting Tier 3 for transaction-critical workloads. DZ BANK deployed Hitachi Vantara EverFlex to secure always-on storage, reinforcing this preference. The Europe data center server market size for Tier 4 is projected to expand 9.98% annually as AI and sovereign-cloud operators demand fault-tolerant uptime. Government supercomputer projects, such as Serbia’s Eviden contract, validate the rising appeal of Tier 4.
Edge rollouts sustain limited use of Tier 1/2 suites for development environments where proximity matters more than redundancy. However, stricter EU directives on incident reporting could gradually shift even peripheral sites toward Tier 3 certification, underpinning a structural uplift in specification requirements across the Europe data center server market.



By Form Factor: Half-Height Blades Lead Dense Computing Evolution
Half-height blades retained 63.85% revenue in 2025, anchoring legacy virtualization estates. Lenovo’s ThinkSystem V4 line, built on Intel Xeon 6, refreshes this mainstream segment. Europe data center server market size for quarter-height blades is rising fastest at 8.35% CAGR as operators outfit micro-edge nodes inside retail outlets and cell towers.
Full-height blades remain vital for GPU clusters; Cisco’s UCS C845A packs eight NVIDIA GPUs within 4 RU, meeting tight rack-power budgets. Modular reference architectures such as NVIDIA MGX allow operators to drop new accelerator cards without replacing rails, extending asset life and lowering TCO.
By Application/Workload: AI/ML Transforms Server Requirements
AI/ML workloads captured 36.12% Europe data center server market share in 2025, surpassing HPC for the first time. Enterprises train large language models on clusters built around AMD EPYC and NVIDIA H100; CHARM Therapeutics moved its 128-GPU estate from the UK to Iceland to blend green energy with performance. Storage-intensive analytics also expands as NVMe and E3.S drives push I/O latency below 50 µs.
Virtualization/private cloud registers an 8.06% CAGR through 2031 as banks and insurers phase out on-prem mainframes. HPE’s Blue Lion supercomputer at Leibniz Center, cooled 100% by direct liquid, delivers 30× speed-ups, proving advanced cooling’s role in AI and HPC consolidation.
By Data-Center Type: Colocation Facilities Bridge Enterprise and Hyperscale Demands
Colocation providers captured 53.12% of the European data center server market size in 2025 by offering compliance-ready environments without capital strain. Equinix’s acquisition of BT’s Irish facilities reflects a pivot toward green-energy geographies. Hyperscalers show a 8.72% CAGR as Microsoft, Google, and Meta pre-provision capacity for AI.
Hybrid tenancy is emerging: enterprises offload steady workloads to colos while bursting AI jobs to the cloud. Vantage Data Centers’ EUR1.4 billion expansion demonstrates large-scale build-to-suit campuses for this trend.
By End-use Industry: IT & Telecom Lead Digital Infrastructure Investment
IT & telecom owned 31.96% revenue in 2025, driven by 5G core upgrades and OTT growth. Deutsche Bank cut server count by 25% using Google Distributed Cloud on its Autobahn FX platform. Manufacturing is the fastest-growing vertical at 9.14% CAGR, as edge analytics optimizes production lines. Rittal’s Haiger plant, managed by German Edge Cloud, illustrates real-time quality control at scale.
Healthcare continues its cautious cloud migration; the NHS shutters legacy rooms yet retains on-prem servers for GDPR-classed datasets. Energy utilities such as Vattenfall run Databricks Intelligence to model renewables dispatch, highlighting diverse demand drivers.
Geography Analysis
Germany retained leadership with a 24.78% share of Europe data center server market in 2025. Frankfurt’s DE-CIX internet exchange and ample corporate tenants sustain high rack absorption. Revenues may reach USD 25.3 billion by 2029 as new Rhein-Main campuses secure 600 MW of incoming grid power. Land scarcity and 18-month power-hook-up queues, however, nudge operators toward Berlin and NRW.
Poland is emerging fastest, tracking a 10.22% CAGR as Warsaw becomes a cloud on-ramp hub. Google, Microsoft, and Oracle have all commissioned 50 MW-plus availability zones, leveraging attractive electricity tariffs and proximity to Western Europe. The government’s PLN 11 billion digital-decade plan allocates incentives for regional colos, accelerating rack-supply pipelines.
Regulatory Landscape
EU policy is tightening requirements for energy performance and sustainability disclosures for data centers, while product-level efficiency rules for enterprise servers remain in force. Under the Energy Efficiency Directive (Directive (EU) 2023/1791), data centers with installed IT power demand of at least 500 kW face mandatory monitoring and reporting, with annual reporting by May 15. Organizations exceeding 10 TJ annual energy consumption also have additional enterprise energy-audit obligations due by October 11, 2026. In parallel, Delegated Regulation (EU) 2024/1364 introduces a common Union rating scheme for data centers to standardize sustainability reporting across colocation, hyperscaler, and enterprise sites.
On the hardware side, Commission Regulation (EU) 2019/424 continues to set mandatory ecodesign requirements for enterprise servers, including minimum efficiency and idle-state consumption. These requirements influence OEM platform choices and refresh cycles. Waste-heat reuse obligations apply to data centers commencing operations on or after July 1, 2026, reinforcing demand for server configurations and rack designs that support higher utilization, liquid cooling, and heat-recovery-ready layouts in major European buildouts.
Competitive Landscape
Competition is intensifying as AI refresh cycles disrupt entrenched positions. Intel responds with Sierra Forest E-cores targeting cloud workloads, but availability only in 2H 2025 stalls momentum. NVIDIA’s near-monopoly on high-end GPUs is both a boon and a bottleneck; allocations favor the top eight OEMs, creating scarcity for mid-tier integrators.
European champions leverage sovereignty narratives. OVHcloud markets in-region AI clusters cooled by proprietary water loops; global players are compelled to match such sustainability metrics. Liquid-cooling vendors like Submer and GRC partner with colos to retrofit existing halls, creating a secondary competitive layer around energy efficiency. Supply-chain resilience becomes a deciding factor; vendors able to secure substrate and HBM allocations lock in orders 12 months ahead, squeezing slower rivals.
Europe Data Center Server Industry Leaders
Dell Technologies
Hewlett Packard Enterprise
Lenovo Group
Cisco Systems
Fujitsu
- *Disclaimer: Major Players sorted in no particular order

Market Opportunities and Future Outlook
Sovereign compute buildouts and EU-level capacity programs create whitespace for in-region, compliance-aligned server deployments, with particular pull from GPU-dense and liquid-cooled configurations that can align with sustainability reporting and energy-performance requirements. The Cloud and AI Development Act (CADA), as discussed in EU policy and legal analyses, targets a material expansion of EU data center capacity over a five to seven year window and references around EUR 200 billion in private investment, linking AI infrastructure growth to grid and permitting constraints. AWS establishing a European Sovereign Cloud entity, along with vendor activity around sovereign AI stacks, supports demand for configurable server platforms that can be localized by country and by regulated industry.
Energy and grid-access constraints in metro hubs also shift opportunity toward designs and delivery models that reduce time-to-power and improve efficiency per rack. Modular builds, rack-scale systems, and liquid cooling engineered for high power densities fit this direction. Tripartite approaches cited in EU regulatory discussions, involving operators, energy stakeholders, and public authorities, outline a pathway for expedited permitting and priority grid connections when projects commit to sustainable designs. That favors vendors and integrators able to provide auditable energy telemetry, support the EU data center rating scheme, and deliver heat-reuse-ready infrastructure. Supply tightness for advanced accelerators keeps procurement anchored in hybrid sourcing, multi-year supply agreements, and turnkey rack solutions, which leaves room for OEMs and channel partners that can secure allocations and deliver validated reference architectures for AI and virtualization refresh cycles across FLAPD as well as emerging Central and Eastern European and Nordic sites.
Recent Industry Developments
- July 2026: EuroHPC JU contract with Dell Technologies and E4 Computer Engineering to procure an AI supercomputer for the IT4LIA AI factory in Bologna, Italy. The deal highlights EU AI hardware procurement for public research infrastructure. The project expands Dell's involvement in European supercomputing deployments and supports Europe-based AI and HPC compute capacity and sovereignty alignment.
- July 2026: Vodafone Spain five-year agreement with Dell to expand data center capacity using Dell APEX Infrastructure. The arrangement points to ongoing demand for scalable, on-demand infrastructure in Southern Europe. It extends Dell's IaaS-style offerings in-region and underscores the value of flexible capacity in regulated European markets.
- July 2026: Launch of sovereign AI cloud platform in the Netherlands via partnerships with Volt and NorthC to begin operations October 2026. The new platform adds European sovereign cloud capacity for AI workloads. It reinforces Dell's position in sovereign cloud enabled data center markets across Europe and supports in-region compliance requirements.


Research Methodology Framework and Report Scope
Market Definition and Coverage
This market covers the revenue generated from servers deployed inside data centers across Europe, counted on a value basis in USD for the year, and focused on demand linked to data center build and refresh cycles.
Scope exclusions: This sizing excludes non-server infrastructure such as storage arrays, networking gear, racks, power, and cooling equipment.
Segmentation Overview
- By Data-Center Tier
- Tier 1 and 2
- Tier 3
- Tier 4
- By Form Factor
- Half-height Blades
- Full-height Blades
- Quarter-height / Micro-blades
- By Application / Workload
- Virtualisation and Private Cloud
- High-Performance Computing (HPC)
- Artificial Intelligence/Machine Learning and Data Analytics
- Storage-centric
- Edge / IoT Gateways
- By Data Center Type
- Hyperscalers/Cloud Service Provider
- Colocation Facilities
- Enterprise and Edge
- By End-use Industry
- BFSI
- IT and Telecom
- Healthcare and Life-Sciences
- Manufacturing and Industry 4.0
- Energy and Utilities
- Government and Defence
- By Geography
- Austria
- Belgium
- Denmark
- France
- Germany
- Ireland
- Italy
- Netherlands
- Norway
- Rest of Europe
Data Sources, Market Sizing, and Validation
Desk Research
Desk research is used to map the market boundary and to anchor the model to observable data signals that explain why servers are being bought in Europe. We typically reference public policy and compliance sources, such as European Commission energy and ecodesign materials for servers, plus official trade statistics that help us sanity check hardware import flows into Europe.
We also pull in data center ecosystem sources, such as European trade associations and national-level digital infrastructure updates, and we review company filings, annual reports, and investor presentations that discuss capacity additions and capex priorities. To tighten the model inputs, we use subscriptions for company financials and intelligence, patent databases, and, where available, shipment-level import and export databases to verify directionally where supply is landing. The sources listed here are illustrative, and we add other public and paid references to fill gaps, validate assumptions, and clarify points that remain unclear.
Primary Interviews and Surveys
Primary work is used to test what desk sources cannot explain well, especially the split between new capacity builds and replacement cycles, and how configurations are changing for AI and high-performance workloads. We spoke with a mix of data center operators, server supply-side participants, and system integration channels across Europe, so assumptions on unit demand, configuration mix, and pricing movement could be adjusted to what is actually being purchased in-country.
Distribution of primary research fieldwork respondents
| Company type | Respondent position |
|---|---|
| Top tier: 26% | CXOs: 16% |
| Mid tier: 58% | Functional/Unit leaders: 39% |
| Smaller Players: 16% | Managers: 45% |
Market-Sizing & Forecasting
The main market build starts with a top-down logic where data center expansion signals are reconstructed into server demand pools, and then translated into revenue using realistic configuration and price bands. In practice, the model is tied to what is happening in Europe across hyperscale rollouts, colocation additions, and enterprise data center refresh activity, which are then converted into annual server purchasing value.
To keep it practical, we rely on a few inputs that are easy to explain and re-check: the pace of data center buildouts by country, the split of deployments by data center type (for example, hyperscaler versus colocation), the form factor mix changes, the application pull from virtualization and private cloud versus high-performance computing, and observed pricing movement as newer configurations gain share. Because any single input can be noisy, results are corroborated with selective bottom-up approximations, such as sampled unit volumes times average selling prices for common configurations, channel checks on procurement timing, and supply-side revenue splits discussed in interviews. Where direct visibility is limited for smaller deployments, gaps are handled using conservative penetration assumptions that are reviewed with local experts and adjusted only when multiple signals point the same way.
For the forecast, scenario analysis is used so the model can reflect both steadier refresh-led years and step changes when large builds or AI-driven upgrades accelerate demand. The scenario weights are guided by what primary respondents expect for ordering lead times, budget releases, and deployment schedules, before final year-by-year values are locked.
Data Validation & Update Cycle
Validation happens through repeated cross-checks against independent demand signals, and then through a review process that looks for unusual jumps by country, application, or data center type. We compare outcomes with adjacent metrics like announced capacity additions, procurement cycle timing, and directional trade movements, and any major variance triggers a re-check of assumptions and follow-up conversations.
Before sign-off, the model is reviewed in multiple steps so arithmetic, logic, and scope treatment remain consistent across the full time series. Reports are refreshed annually, and interim updates are made when material events reshape demand, such as sudden supply constraints or sharp configuration shifts. Right before delivery, a final pass is done so clients receive the most current view available at that time.
Mordor Intelligence's Europe Data Center Server Market Size Compared With Other Published Estimates
Different publications can show different market sizes even when they appear to describe the same topic, because the counted items, the geography cut, and the pricing logic can vary. For servers in data centers, the spread is usually explained by whether the estimate follows hyperscaler build cycles, how it handles configuration mix shifts, and what it does with bundled infrastructure that sits next to servers.
By tracking configuration-level price movement and checking refresh and new-build demand drivers, Mordor Intelligence keeps the Europe total focused on server revenue only, which avoids mixing in storage, networking, or facility equipment that can inflate the final value.
Benchmark comparison
| Source | Market Size | Gaps in Research Methodology |
|---|---|---|
| Mordor Intelligence | USD 29.85 B (2025) | |
| Regional Consultancy A | USD 13.00 B (2024) | This estimate typically reads like an enterprise hardware refresh view, where hyperscaler and large colocation deployment volumes are not fully captured, which can pull down the total. |
| Global Consultancy B | USD 27.58 B (2024) | A narrower configuration scope and simplified pricing progression (with limited uplift for GPU-dense and newer blade configurations) can keep the market value lower even when unit demand is rising. |
Looking across the table, most of the gap comes from what gets counted as a server sale and how fast pricing is allowed to move as the mix shifts toward higher performance builds. When scope, geography coverage, and pricing steps are written out clearly and then re-checked with primary inputs, the final number becomes easier to reproduce and defend year to year.


Key Questions Answered in the Report
What is the current size of the Europe data center server market?
The market is valued at USD 32.22 billion in 2026 and is projected to reach USD 47.28 billion by 2031.
Which country leads server demand in Europe?
Germany leads with 24.78% share in 2025 thanks to Frankfurt’s connectivity and large enterprise base.
How fast is AI driving server upgrades?
AI/ML workloads already hold 36.12% market share and hyperscale GPU refreshes add about +2.5 percentage points to the market’s CAGR.
Why are operators adopting liquid cooling?
EU Green Deal incentives and higher rack densities allow operators to cut power use by up to 90% and achieve PUE below 1.3.
Page last updated on:
- Data Center Server Market
- United States Data Center Server Market
- Brazil Data Center Server Market
- North America Data Center Server Market
- India Data Center Server Market
- South America Data Center Server Market
- China Data Center Server Market
- Switzerland Data Center Server Market
- Sweden Data Center Server Market
- Norway Data Center Server Market
- Data Center Construction Market Global construction demand, split by tier, facility size and facility type.
- Artificial Intelligence (AI) Data Center Market AI facilities worldwide, split by facility type, component and tier.
- Europe Data Center Storage Market Storage demand across Europe, covering storage technology, storage type and end user.
- Europe Data Center Networking Market Networking demand across Europe, covering component, end-user and data-center type.





