
Carbon Credit Market Size and Share
Market Overview
| Study Period | 2021 - 2031 |
|---|---|
| Market Size (2026) | USD 1.26 Trillion |
| Market Size (2031) | USD 5.13 Trillion |
| Growth Rate (2026 - 2031) | 32.32 % |
| Fastest Growing Market | Asia Pacific |
| Largest Market | Europe |
| Market Concentration | Medium |
Major Players *Disclaimer: Major Players sorted in no particular order Image © Mordor Intelligence. Reuse requires attribution under CC BY 4.0. | |
Carbon Credit Market Analysis by Mordor Intelligence
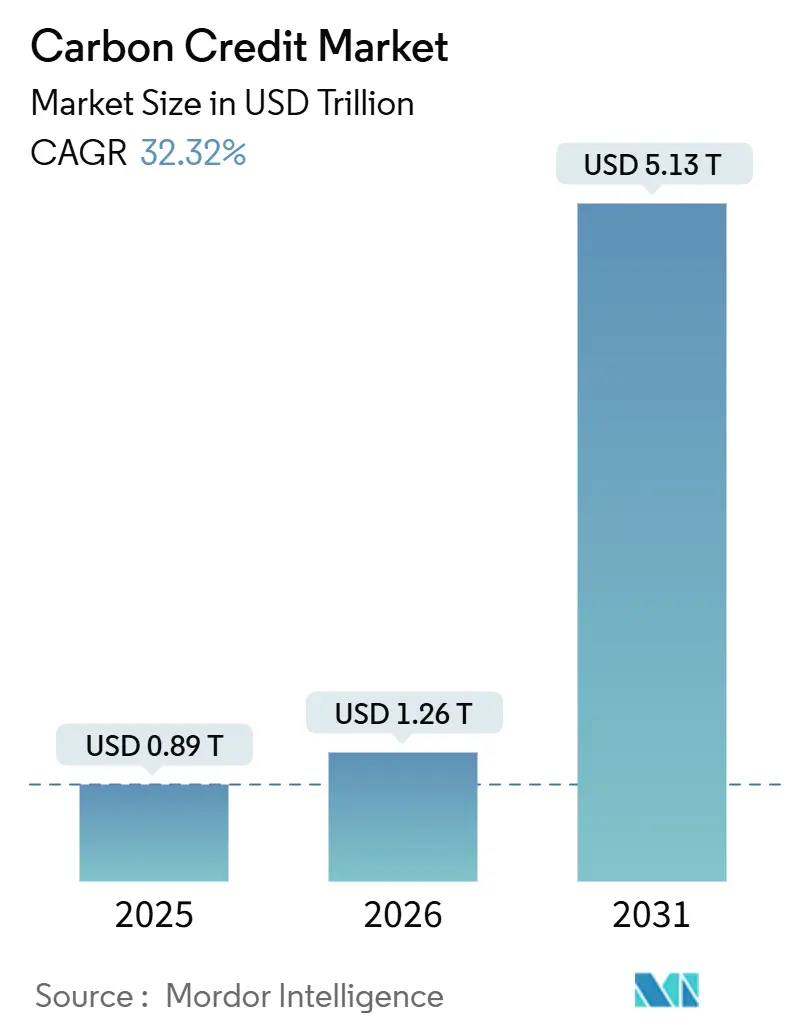
The Carbon Credit Market size is projected to expand from USD 0.89 trillion in 2025 and USD 1.26 trillion in 2026 to USD 5.13 trillion by 2031, registering a CAGR of 32.32% between 2026 to 2031. Surging compliance demand from the EU ETS Phase IV and China’s expanded national system, coupled with a resurgence of voluntary buying tied to Scope 3 disclosure mandates, is driving unprecedented transaction volumes. Record EU Allowance prices, the launch of CORSIA Phase 2, and more than 10,000 corporate net-zero pledges are setting a robust price floor that is reshaping investment flows toward removal-focused and nature-based projects. Digital MRV platforms and blockchain registries are lowering verification costs and shortening issuance cycles, enticing new project developers and institutional investors. Meanwhile, the Carbon Border Adjustment Mechanism is internationalizing EU-style carbon costs, spurring cross-border credit flows and arbitrage opportunities, even as quality bifurcation between high-integrity and legacy offsets widens.
Key Report Takeaways
- By type, compliance schemes dominated with 98.22% of carbon credit market share in 2025; the voluntary segment is projected to post a 42.15% CAGR through 2031.
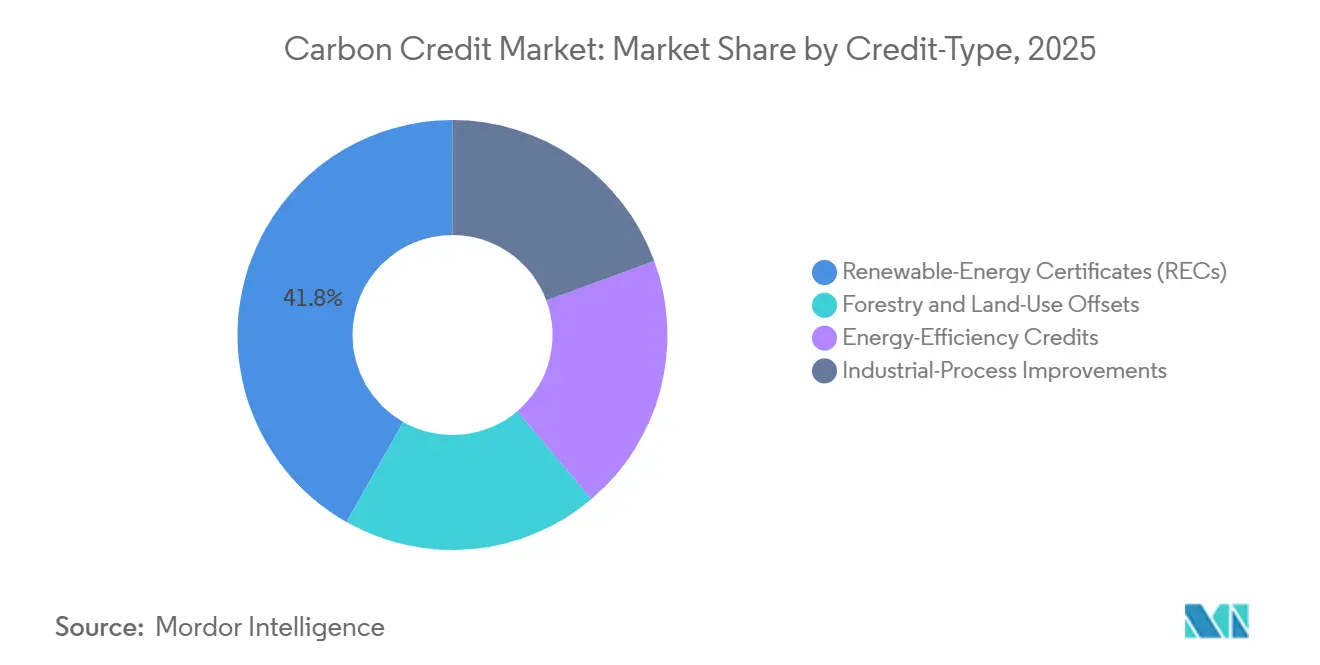
- By credit type, renewable-energy certificates led with 41.8% share in 2025, while forestry and land-use offsets are on track for the fastest 39.2% CAGR to 2031.
- By delivery mode, spot transactions accounted for 59.9% of volume in 2025; futures and forwards are forecast to climb at a 37.4% CAGR through 2031.
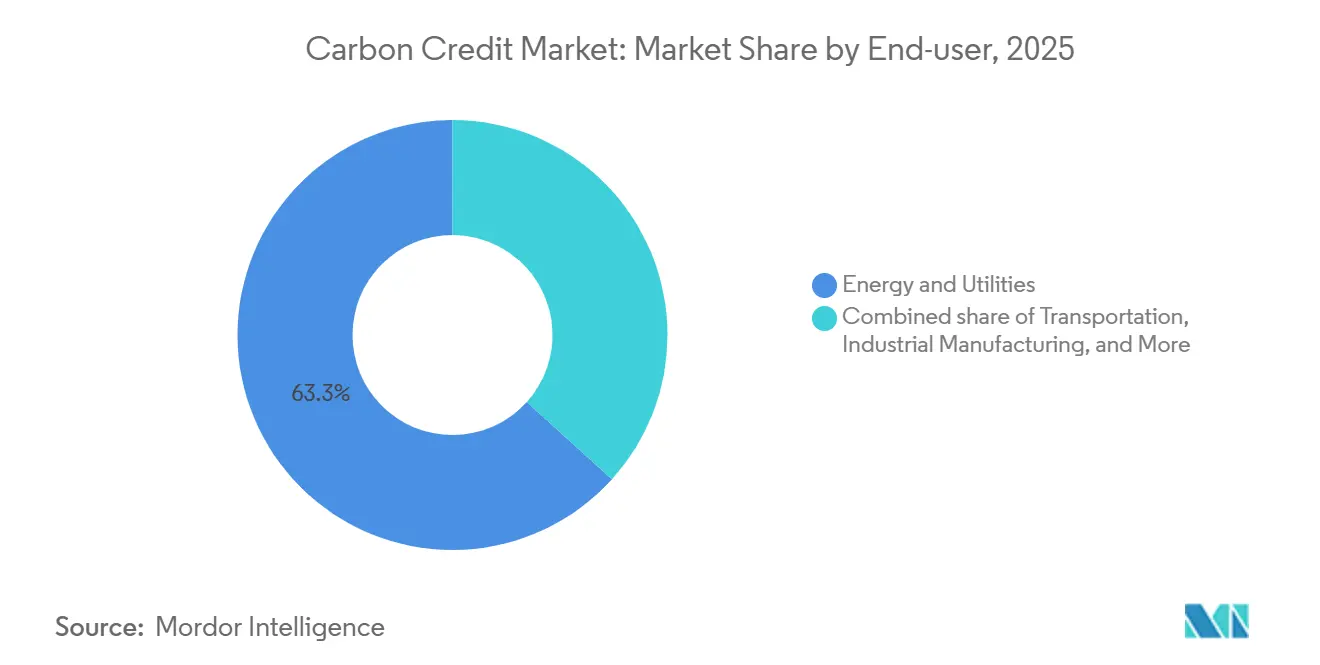
- By end user, energy and utilities held 63.3% share in 2025, whereas transportation exhibits the highest 40.3% CAGR to 2031, underpinned by CORSIA Phase 2 obligations.
- By geography, Europe captured 76.1% market share in 2025; Asia-Pacific is the fastest-growing region with a 38.7% CAGR to 2031.
Note: Market size and forecast figures in this report are generated using Mordor Intelligence’s proprietary estimation framework, updated with the latest available data and insights as of January 2026.
Global Carbon Credit Market Trends and Insights
Drivers Impact Analysis*
| Driver | (~) % Impact on CAGR Forecast | Geographic Relevance | Impact Timeline |
|---|---|---|---|
| Expansion of compliance ETS across emerging economies | +8.20% | Asia-Pacific core (China, India, Indonesia), spill-over to Middle East (UAE, Saudi Arabia) | Medium term (2-4 years) |
| Corporate net-zero commitments accelerating VCM demand | +9.50% | Global, with concentration in North America and Europe | Short term (≤ 2 years) |
| Rise in carbon pricing mechanisms and higher allowance prices | +7.80% | Europe and North America, emerging in Asia-Pacific | Medium term (2-4 years) |
| Digital MRV & blockchain boosting credit transparency | +3.10% | Global, early adoption in North America and Europe | Long term (≥ 4 years) |
| Scope-3 disclosure mandates lifting removal-credit demand | +6.40% | Europe (CSRD), North America (SEC proposed), Asia-Pacific (ISSB adopters) | Short term (≤ 2 years) |
| CORSIA Phase-2 tightening spurring nature-based credits | +4.70% | Global, aviation hubs in Europe, Asia-Pacific, Middle East | Medium term (2-4 years) |
| Source: Mordor Intelligence | |||
Expansion of compliance ETS across emerging economies
In 2025, China incorporated steel, aluminum, and cement into its national emissions trading system, covering 8 billion tCO₂e, which accounts for approximately 60-65% of its domestic emissions. The carbon prices were set at CNY 60-70 per tCO₂, establishing the world’s largest compliance market. India is set to launch a nationwide market in 2026, while Indonesia initiated a coal-power pilot in 2025, indicating a ripple effect across ASEAN. The UAE introduced a voluntary framework, and Saudi Arabia allocated USD 10 billion for offset projects, positioning Gulf countries as both buyers and suppliers in the carbon market. Although liquidity remains lower than the EU ETS, the combined caps of these schemes are projected to surpass 3-4 billion tCO₂e by 2030, broadening the scope of the carbon credit market. Cross-border trades under Article 6 are gaining momentum, with 99 bilateral agreements and over 1,000 pipeline projects recorded by late 2025.(1)United Nations Framework Convention on Climate Change, “Article 6 Activity Database,” unfccc.int
Corporate net-zero commitments accelerating VCM demand
Over 10,000 companies have pledged to achieve net-zero emissions by 2025, with more than 5,000 obtaining validation from the Science Based Targets initiative. This validation requires annual emissions reductions of 4.2%, aligned with a 1.5 °C pathway. The introduction of the Net Zero V2 framework in February 2025 incorporated the concept of “Ongoing Emissions Responsibility,” formally acknowledging ex-post credits within target pathways. This policy shift contributed to an increase in voluntary retirements, reaching 211 million tCO₂e in 2025, a 9% year-on-year growth. Removal credits, including those from direct air capture, biochar, and enhanced weathering, are priced at USD 100-300 per tCO₂, representing a 20-60 times premium over traditional avoidance offsets, reflecting a buyer preference for permanence. Additionally, the Integrity Council labeled 400 million credits by late 2024, which increased CCP-tagged retirements from 3% to 7% of the total volume in 2025, highlighting a shift toward high-integrity credit supply.(2)The Integrity Council for the Voluntary Carbon Market, icvcm.org
Rise in carbon pricing mechanisms and higher allowance prices
EU Allowance prices averaged EUR 84-93 per tCO₂ in 2026 under Phase IV’s 4.3% annual cap decline. (3) European Commission, “EU Emissions Trading System (EU ETS),” europa.eu California’s program recorded auction clearances exceeding USD 35 per tCO₂, while RGGI allowances traded around USD 15. In South Korea, the K-ETS reduced free allocations, pushing prices to KRW 25,000-30,000 (USD 19-23) per tCO₂. Higher compliance prices are raising the baseline for voluntary credits that meet robustness criteria, thereby increasing cross-market arbitrage opportunities. Japan’s Joint Crediting Mechanism, which collaborates with 29 partner nations, facilitates technology transfer and offset generation in Southeast Asia and Africa, demonstrating how national schemes can contribute to additional voluntary supply.
Scope 3 Disclosure Mandates Lifting Removal-Credit Demand
The EU Corporate Sustainability Reporting Directive came into effect in 2024, requiring large companies to measure value-chain emissions, which are often five to ten times greater than their operational emissions. By 2025, IFRS S1 and S2 standards were adopted in over 20 jurisdictions, standardizing disclosure requirements and emphasizing residual emissions in industries such as aviation, cement, and steel. With limited in-house abatement options, companies are increasingly relying on removal credits. For instance, Climeworks’ Mammoth plant scaled up to capture 36,000 tCO₂ annually in 2024, while Svante’s North Star BECCS project captures 140,000 tCO₂ per year. BloombergNEF projects that voluntary carbon credit supply will reach 2.6 billion tCO₂e by 2030, with removal pathways accounting for a growing share, highlighting the sustained increase in demand.
Restraints Impact Analysis*
| Restraint | (~) % Impact on CAGR Forecast | Geographic Relevance | Impact Timeline |
|---|---|---|---|
| Oversupply of low-quality credits eroding buyer confidence | -4.30% | Global voluntary markets | Short term (≤ 2 years) |
| Fragmented global standards and double-counting risks | -3.70% | Cross-border Article 6 trades | Medium term (2-4 years) |
| Geopolitical CBAM tensions limiting flows | -2.80% | EU trade corridors | Medium term (2-4 years) |
| Reversal liability concerns hurting forestry finance | -2.10% | Tropical regions | Long term (≥ 4 years) |
| Source: Mordor Intelligence | |||
Oversupply of Low-Quality Credits Eroding Buyer Confidence
Legacy renewable energy and cookstove credits issued before 2020 entered the market at prices below USD 5 per tCO₂ in 2025, negatively impacting perceptions of additionality. According to BeZero Carbon’s ratings, C-graded units are trading at one-sixth the price of BBB+ projects. Shell reduced its retirements from 14 million tCO₂e in 2024 to 9.75 million in 2025, shifting its focus toward removals. Of the 650 million credits issued in 2024, only 400 million were labeled by the Integrity Council, leaving unlabeled stock struggling to attract buyers. As a result, developers face extended payback periods when carbon credit prices drop below USD 10 per tCO₂, delaying new forestry and renewable energy projects. Market confidence will depend on the rapid expansion of rating systems and third-party audits to distinguish product quality.
Fragmented Global Standards & Double-Counting Risks
By late 2025, the implementation of Article 6 showed limited progress, with only 99 bilateral agreements and 1,041 pipeline projects in place, lacking uniform accounting standards. The absence of consistent corresponding adjustments allows both host and buyer nations to claim the same emission reductions, compromising the system's integrity. Various voluntary standards, including Verra VCS, Gold Standard, and Climate Action Reserve, employ differing methodologies, leading to higher compliance costs for multi-certification and creating confusion among corporate buyers. Additionally, the lack of a universal registry hinders real-time tracking of transactions. However, Verra's partnership with S&P Global, planned for 2025, aims to address this issue by 2026. Until harmonization is achieved, arbitrage in jurisdictions with lenient regulations will suppress high-quality price signals and dampen investor interest.
*Our forecasts treat driver/restraint impacts as directional, not additive. The impact forecasts reflect baseline growth, mix effects, and variable interactions.
Segment Analysis
By Type: Compliance Dominance Masks Voluntary Surge
In 2025, compliance schemes accounted for 98.22% of the total volume, driven primarily by the EU ETS and China’s cap of 8 billion tCO₂e. Exchange liquidity facilitated robust hedging activities, with the Intercontinental Exchange clearing 20.9 million environmental contracts during the year. Meanwhile, the voluntary segment demonstrated a strong growth trajectory, with a CAGR of 42.15%, supported by the Science Based Targets initiative (SBTi) recognizing ex-post credits and increasing pressures related to Scope 3 emissions. This growth is gradually reducing the traditional divide between compliance and voluntary markets.
Price convergence appears likely as airlines procure CORSIA-eligible units and integrate demand for integrity-tagged removals. This trend is encouraging voluntary issuers to adopt compliance-grade monitoring, reporting, and verification (MRV) standards. If achieved, successful convergence could expand the carbon credit market for project developers capable of meeting the requirements of both compliance and voluntary regimes.
By Credit Type: Forestry Offsets Overtake RECs
In 2025, renewable energy certificates accounted for 41.8% of the market share but faced skepticism regarding additionality, which limited prices to below USD 5 per tCO₂. Forestry and land-use credits, projected to grow at a 39.2% CAGR, benefit from biodiversity co-benefits and eligibility under CORSIA, although investors remain concerned about reversal risks. Emerging removal technologies, while more expensive, fulfill permanence criteria valued by global brands, indicating a potential long-term shift toward high-integrity units despite initial supply constraints.
Insurance coverage for 5-10% of forestry issuance in 2025 is expanding, while satellite-based MRV significantly reduces verification costs, attracting institutional capital. With premiums for removals ranging from USD 100 to 300 per tCO₂, the market share of nature-based and engineered removals is expected to increase, influencing price trends across various registries.



By Delivery Type: Derivatives Gain as Hedging Intensifies
Spot deals accounted for 59.9% of transactions in 2025, driven by immediate compliance requirements and corporate retirements. In contrast, futures and forwards are projected to grow at a compound annual growth rate (CAGR) of 37.4% through 2031, as companies prioritize price stability amidst fluctuations in EU Allowance prices, which ranged from EUR 60 to EUR 100 (USD 68.60 to USD 114.33) within a twelve-month period. The introduction of ICE’s CORSIA CP1 contract and EEX Guarantee-of-Origin futures highlights the early stages of derivative market development.
Standardization remains a key challenge in the voluntary market, where diverse project attributes hinder exchange listings. If tokenization initiatives prove successful, the creation of fungible baskets could enhance secondary-market activity and expand the carbon credit market by attracting capital focused on trading opportunities.
By End User: Transportation Emerges as Growth Leader
In 2025, the energy and utilities sector accounted for 63.3% of demand, driven by statutory caps on coal and gas generators. The transportation sector is expected to experience the highest compound annual growth rate (CAGR) of 40.3%, supported by CORSIA Phase 2’s 79.25 million-tonne offset mandate and the International Maritime Organization’s net-zero targets.
The limited availability of Sustainable Aviation Fuel, projected at only 600 million liters in 2025, necessitates a significant reliance on offsets by carriers. As airlines and shipping companies face increasing decarbonization deadlines, removal credits and nature-based units with assured permanence are likely to occupy premium positions in procurement strategies, thereby expanding the carbon credit market.
Geography Analysis
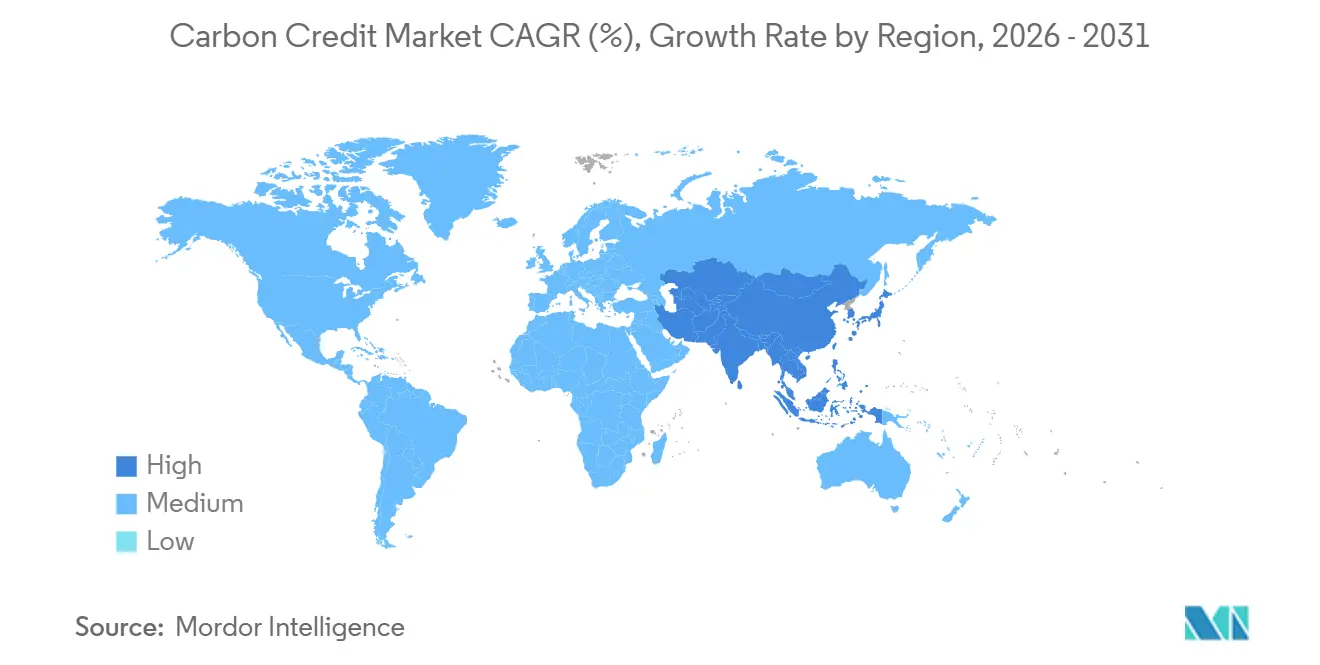
Europe's projected 76.1% market share in 2025 highlights the impact of the EU Emissions Trading System (EU ETS), which enforces a 4.3% annual cap reduction. This system is further supported by the Market Stability Reserve, which has tightened supply. Average EU Allowance prices, ranging from EUR 84 to EUR 93 (USD 96.04 to USD 106.33) per tCO₂ in 2026, have driven record liquidity on ICE and EEX. Additionally, the Carbon Border Adjustment Mechanism has extended internal carbon costs to imports, solidifying the region's price leadership. Voluntary carbon credit retirements reached 50 million tCO₂, primarily from firms based in London, Zurich, and Amsterdam, as they adapt to the Corporate Sustainability Reporting Directive.
The Asia-Pacific region is on track for a 38.7% compound annual growth rate (CAGR) through 2031, driven by China's expanded ETS, which caps 8 billion tCO₂e at prices of CNY 60-70 (USD 8.83-10.30) per tCO₂. India is preparing to launch its national program in 2026. Other developments include South Korea's K-ETS, Indonesia's pilot program, and emerging bilateral Article 6 trades, which are collectively shaping a multi-market ecosystem. Supporting this growth, exchange infrastructure is evolving, with Xpansiv partnering with Macao Exchange in February 2026 to establish regional benchmarks, and AirCarbon Exchange targeting aviation sector buyers.
North America accounted for approximately 500 million tCO₂ of capped emissions in 2025 through programs such as California's cap-and-trade system, the Regional Greenhouse Gas Initiative (RGGI), and Canada's backstop mechanism, with prices ranging from USD 15 to USD 35 per tCO₂. Nodal Exchange achieved record allowance clearances, reflecting increased hedge participation. Meanwhile, Latin America, the Middle East, and Africa remain in the early stages of market development but are critical as offset suppliers. Brazil's planned ETS and Saudi Arabia's USD 10 billion project fund have the potential to scale nature-based credit generation for export to compliance buyers in Europe and Asia.

Competitive Landscape
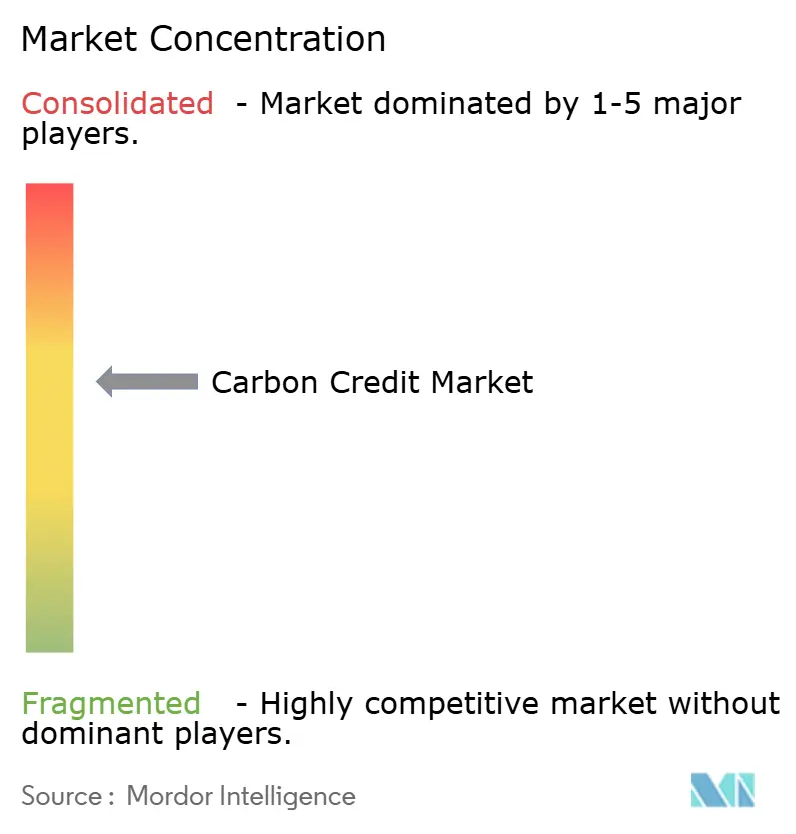
The market is moderately fragmented. Verra and Gold Standard accounted for the majority of voluntary issuances in 2025, while digital platforms such as Climate Impact X and Thallo are utilizing blockchain technology to reduce issuance friction. Exchanges dominate compliance flows, with ICE alone processing over USD 1 trillion in notional environmental value. However, Xpansiv’s planned 2026 Asia-Pacific rollout indicates a potential shift toward regional decentralization. Corporate offtake agreements are increasingly bypassing intermediaries, as demonstrated by Shell’s 9.75 million-tonne retirement in 2025 and Eni’s 80% increase to 6.44 million tCO₂, reflecting varied sourcing strategies and a growing preference for removal credits.
Opportunities exist in high-integrity removal supply, with BloombergNEF reporting less than 1 million tonnes of operational capture capacity today compared to a projected 4.8 billion tonnes by 2050. Vertical integration is gaining momentum, as seen in Carbon Direct’s acquisition of Pachama in November 2025, which aims to integrate MRV, project development, and trading. Similarly, Verra’s partnership with S&P Global seeks to combine registry data with analytics to enhance transparency across the value chain. Companies that successfully integrate MRV, tokenization, and liquidity provisioning are well-positioned to secure premium margins in an ecosystem characterized by information asymmetry.
Carbon Credit Industry Leaders
South Pole
Anew Climate (Bluesource)
Climate Impact X
Shell Environmental Products
Evolution Markets
- *Disclaimer: Major Players sorted in no particular order

Recent Industry Developments
- March 2026: Svante has acquired Carbon Alpha to advance the North Star BECCS project in Canada. This initiative captures 140,000 tCO2 annually from a pulp mill and stores it permanently underground. It is among the largest operational bioenergy carbon capture facilities worldwide, demonstrating the commercial feasibility of removal credits on a large scale.
- January 2025: Indonesia launched IDXCarbon with an opening price of USD 8 per ton and 1.735 million tCO₂e listed from energy projects.
- December 2024: Verra collaborates with Argentina’s Carbon Roundtable, a coalition comprising over 45 entities involved in the country's carbon markets. The roundtable aims to strengthen Argentina's position as a prominent participant in global carbon markets.
- May 2024: Google, Meta, Microsoft, and Salesforce have established the Symbiosis Coalition, aiming to achieve 20 million tCO₂e in nature-based removals by 2030.


Global Carbon Credit Market Report Scope
A carbon credit is a tradable certificate that represents the removal or avoidance of one metric ton of carbon dioxide or equivalent greenhouse gases from the atmosphere. It enables organizations to offset their emissions by funding initiatives such as reforestation or renewable energy projects, supporting a market-driven approach to mitigating climate change.
The global carbon credit market report is segmented by type, credit type, delivery type, end-user, and geography. By type, the market is segmented into the compliance carbon market and the voluntary carbon market. By credit type, the market is segmented into renewable-energy certificates, forestry and land-use offsets, energy-efficiency credits, and industrial-process improvements. By delivery type, the market is segmented into spot and futures/forwards. By end-user, the market is segmented into energy and utilities, transportation, industrial manufacturing, agriculture, and forestry. The report also covers the market size and forecasts for the global carbon credit market in 18 countries across major regions. For each segment, the market sizing and forecasts have been done on the basis of value (USD).
| Compliance Carbon Market |
| Voluntary Carbon Market |
| Renewable-Energy Certificates (RECs) |
| Forestry and Land-Use Offsets |
| Energy-Efficiency Credits |
| Industrial-Process Improvements |
| Spot (Physical) |
| Futures / Forwards |
| Energy and Utilities |
| Transportation |
| Industrial Manufacturing |
| Agriculture and Forestry |
| North America | United States |
| Canada | |
| Mexico | |
| Europe | Germany |
| United Kingdom | |
| France | |
| Italy | |
| NORDIC Countries | |
| Russia | |
| Rest of Europe | |
| Asia-Pacific | China |
| India | |
| Japan | |
| South Korea | |
| ASEAN Countries | |
| Rest of Asia-Pacific | |
| South America | Brazil |
| Argentina | |
| Rest of South America | |
| Middle East and Africa | Saudi Arabia |
| United Arab Emirates | |
| South Africa | |
| Egypt | |
| Rest of Middle East and Africa |
| By Type | Compliance Carbon Market | |
| Voluntary Carbon Market | ||
| By Credit-Type | Renewable-Energy Certificates (RECs) | |
| Forestry and Land-Use Offsets | ||
| Energy-Efficiency Credits | ||
| Industrial-Process Improvements | ||
| By Delivery Type | Spot (Physical) | |
| Futures / Forwards | ||
| By End-user | Energy and Utilities | |
| Transportation | ||
| Industrial Manufacturing | ||
| Agriculture and Forestry | ||
| By Geography | North America | United States |
| Canada | ||
| Mexico | ||
| Europe | Germany | |
| United Kingdom | ||
| France | ||
| Italy | ||
| NORDIC Countries | ||
| Russia | ||
| Rest of Europe | ||
| Asia-Pacific | China | |
| India | ||
| Japan | ||
| South Korea | ||
| ASEAN Countries | ||
| Rest of Asia-Pacific | ||
| South America | Brazil | |
| Argentina | ||
| Rest of South America | ||
| Middle East and Africa | Saudi Arabia | |
| United Arab Emirates | ||
| South Africa | ||
| Egypt | ||
| Rest of Middle East and Africa | ||


Key Questions Answered in the Report
How large will the carbon credit market be by 2031?
The carbon credit market size is forecast to reach USD 5.13 trillion by 2031, expanding at a 32.32% CAGR from 2026.
Which segment is growing fastest?
The voluntary carbon segment leads growth with a projected 42.15% CAGR through 2031 as corporate buyers accelerate net-zero strategies.
Why are removal credits priced higher than avoidance credits?
Removal options such as direct air capture offer permanence, commanding USD 100-300 per tCO₂ versus USD 10-50 for most nature-based avoidance units.
What drives rapid growth in Asia-Pacific?
China’s expanded ETS, India’s upcoming market, and new ASEAN pilots are lifting regional demand, producing a 38.7% CAGR outlook.
How does CBAM affect global trade?
The Carbon Border Adjustment Mechanism applies EU-level carbon costs to imports, limiting the fungibility of cheaper foreign credits and shifting supply chains toward low-carbon production.
Page last updated on:





