Carbon Credit Trading Platform Market Size and Share
Market Overview
| Study Period | 2021 - 2031 |
|---|---|
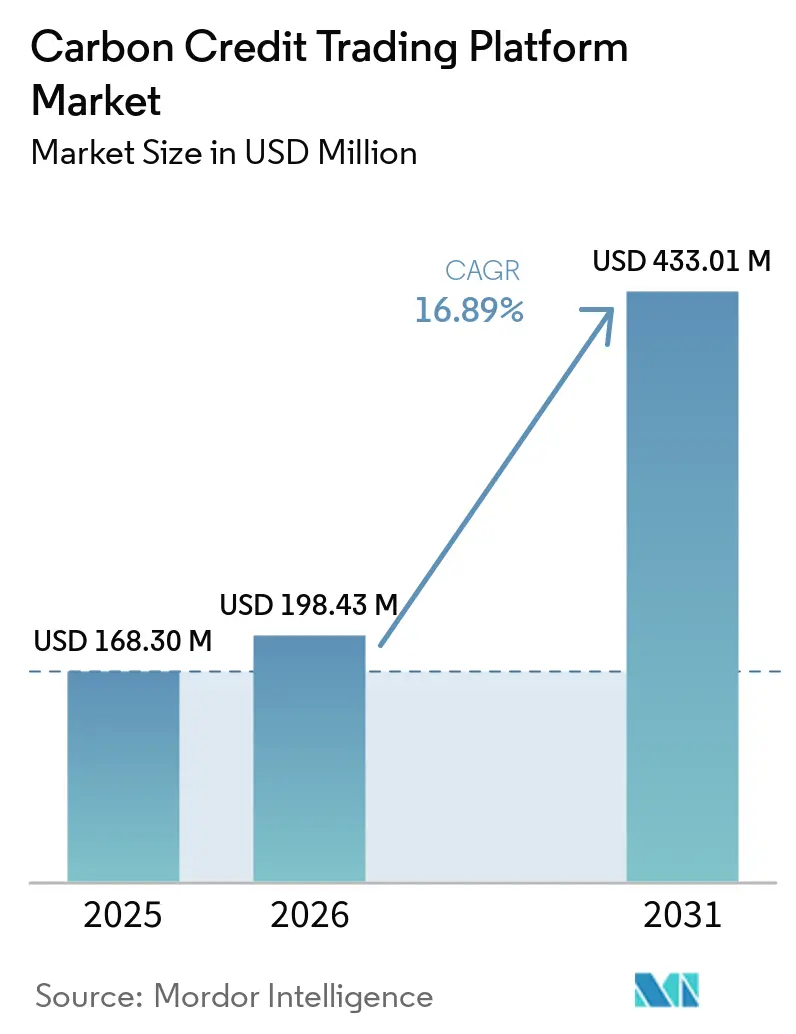
| Market Size (2026) | USD 198.43 Million |
| Market Size (2031) | USD 433.01 Million |
| Growth Rate (2026 - 2031) | 16.89% CAGR |
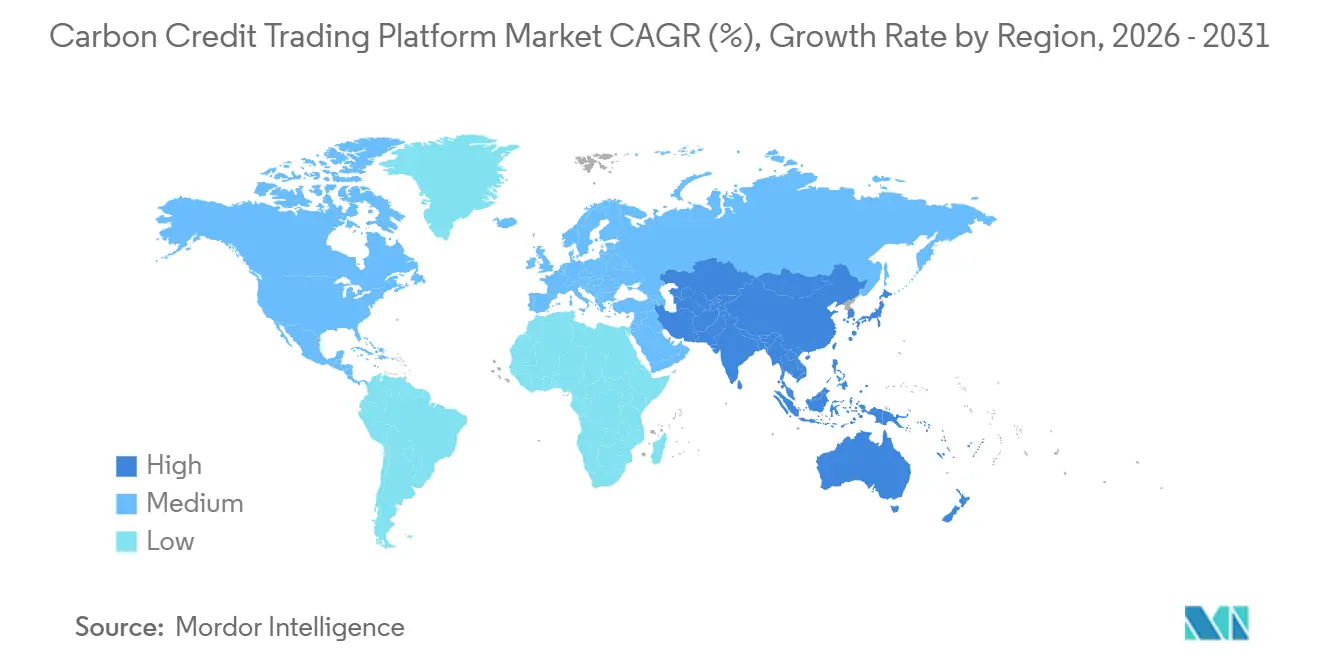
| Fastest Growing Market | Asia-Pacific |
| Largest Market | North America |
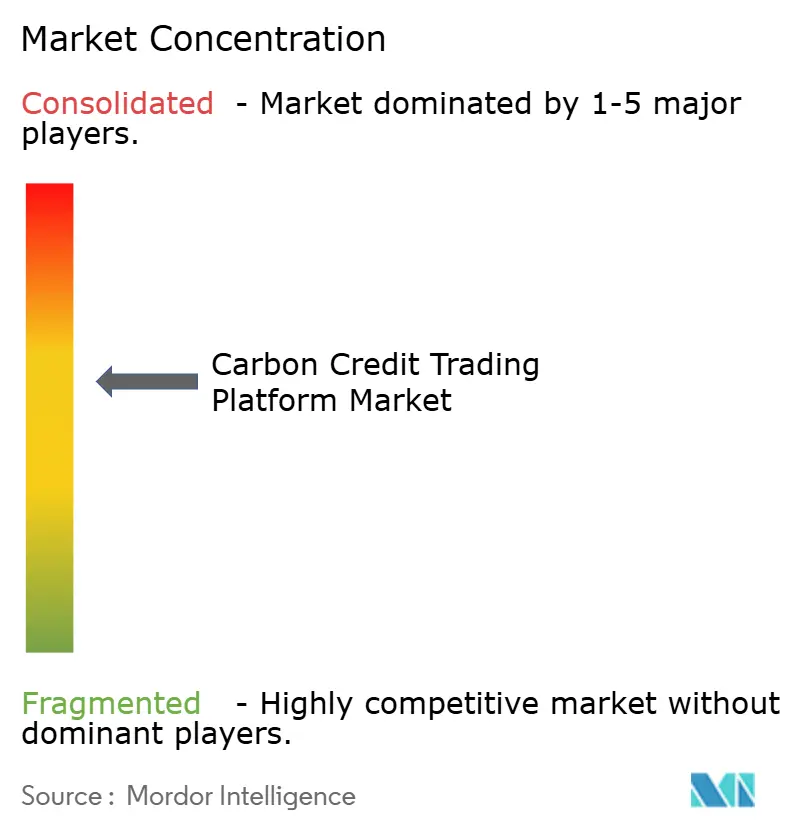
| Market Concentration | Medium |
Major Players *Disclaimer: Major Players sorted in no particular order Image © Mordor Intelligence. Reuse requires attribution under CC BY 4.0. | |
Carbon Credit Trading Platform Market Analysis by Mordor Intelligence
The Carbon Credit Trading Platform Market size is expected to grow from USD 168.30 million in 2025 to USD 198.43 million in 2026 and is forecast to reach USD 433.01 million by 2031 at 16.89% CAGR over 2026-2031. Rapid scale-up follows the operationalization of Article 6, the first transfer of an Internationally Transferred Mitigation Outcome between Switzerland and Thailand, and China’s decision to widen its emissions trading scheme to heavy industry. Mandatory carbon pricing in the EU, California, and South Korea anchors compliance demand, while CORSIA has opened a sizable offset channel for airlines. Platforms now integrate satellite-based monitoring and blockchain tokenization to cut verification time and lower trading costs, positioning them as infrastructure providers for both sovereign and corporate decarbonization strategies. A premium for high-quality removal credits, intensified by rating-agency downgrades of legacy projects, is reshaping liquidity pools and requires sophisticated product design.
Key Report Takeaways
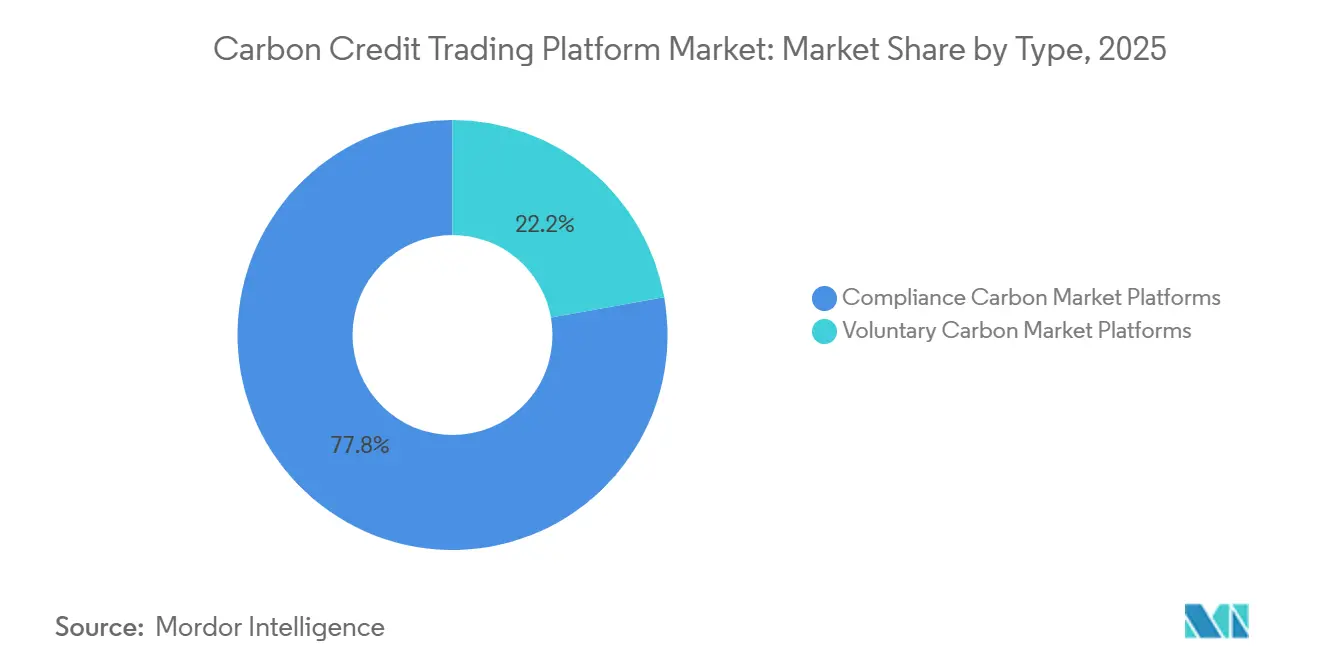
- By type, compliance exchanges held 77.8% of the carbon credit trading platform market share in 2025. Voluntary platforms are expected to expand at a 20.8% CAGR through 2031, the highest rate among all trading models.
- By application, Renewable-energy projects accounted for 72.6% of the carbon credit trading platform market size in 2025. CCS-linked credits are projected to post a 24.2% CAGR between 2026 and 2031, the quickest growth across all project types.
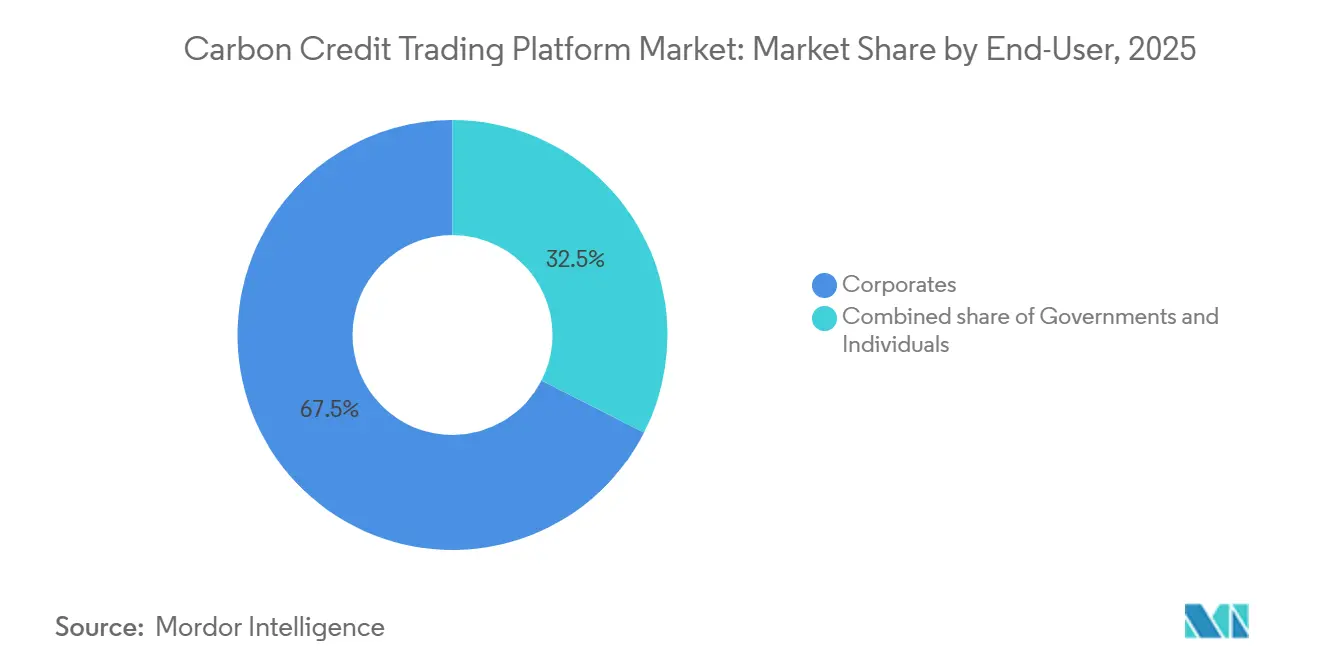
- By end-user, Corporate users represented 67.5% of aggregate transaction value in 2025, whereas government purchasing is predicted to advance at a 17.9% CAGR.
- By geography, North America commanded 36.2% of the carbon credit trading platform market in 2025; Asia-Pacific is expected to record a 22.3% CAGR to 2031.
Note: Market size and forecast figures in this report are generated using Mordor Intelligence’s proprietary estimation framework, updated with the latest available data and insights as of January 2026.
Global Carbon Credit Trading Platform Market Trends and Insights
Drivers Impact Analysis*
| Driver | (~) % Impact on CAGR Forecast | Geographic Relevance | Impact Timeline |
|---|---|---|---|
| Escalating Corporate Net-Zero Commitments | +3.8% | Global, with concentration in North America and Europe | Medium term (2-4 years) |
| Expanding Compliance Carbon Pricing Schemes | +4.2% | Asia-Pacific core, spillover to Middle East and Africa | Long term (≥ 4 years) |
| Increased Investor Demand for ESG Products | +2.1% | North America and Europe, emerging in Asia-Pacific | Short term (≤ 2 years) |
| Technological Advancements in Digital MRV & Blockchain | + 2.9% | Global, early adoption in North America and Europe | Medium term (2-4 years) |
| Integration of Carbon Credits into Consumer Loyalty Platforms | +1.2% | North America and Europe, pilot programs in Asia-Pacific | Long term (≥ 4 years) |
| Tokenization of Nature-Based Assets Enabling Micro-Transactions | +1.6% | Global, with higher traction in blockchain-friendly jurisdictions | Medium term (2-4 years) |
| Source: Mordor Intelligence | |||
Escalating Corporate Net-Zero Commitments
Microsoft doubled its 2024 offtake by contracting 45 million tCO₂e in 2025 across 21 suppliers, including a 2.85 million-ton soil-carbon deal with Indigo Ag priced at USD 60–80 per ton over 12 years [1]Microsoft Sustainability Team, “2025 Carbon Removal Portfolio,” microsoft.com. Similar multi-year structures adopted by Salesforce and other Fortune 500 firms create a predictable order flow that platforms can bundle into standardized futures, differentiating high-integrity removals from avoidance credits. Science-Based Targets Initiative guidance now accepts only removals for neutralization, forcing platforms to embed granular credit tagging and automated retirement. Long-dated contracts also improve project bankability, crowding capital into engineered solutions such as direct air capture. This steady procurement pipeline lifts visibility for the carbon credit trading platform market.
Expanding Compliance Carbon Pricing Schemes
China will add steel, cement, and aluminum to its ETS by 2027, bringing 1,500 entities and 3 billion tCO₂e under absolute caps. Japan’s GX-ETS went live in 2026, South Korea began K-ETS Phase 4, and India’s pilot scheme is underway, forming a pan-Asian pricing corridor that platforms must stitch together. ASEAN members signed a Common Carbon Framework to harmonize accounting, while Indonesia considers a bilateral linkage with China’s ETS. These developments lift compliance liquidity, narrow regional arbitrage, and stimulate cross-listed products. Standard-setting bodies such as the Integrity Council for the Voluntary Carbon Market are quickly becoming prerequisites for listing, raising quality and integration requirements.
Increased Investor Demand for ESG Products
High-rated afforestation and reforestation credits traded at a USD 25–35 premium over baseline offsets in 2025. EU CBAM liabilities forecast for Chinese and Indian steel exporters have encouraged upstream suppliers to buy offsets to protect margins. Platforms that curate CORSIA-eligible or ICVCM-approved indices have attracted institutional inflows, but block trades above 100,000 tons still face thin liquidity. The phase-out of Chinese I-RECs further tightened supply, drawing speculative capital that treats carbon as an inflation hedge. Investor appetite is therefore a double-edged sword, boosting demand yet amplifying volatility.
Technological Advancements in Digital MRV & Blockchain
Satellite-enabled soil-carbon algorithms now reach 85–93% accuracy and cut field visits 90%, shaving verification costs by up to 70% [2]EOS Data Analytics, “Soil Carbon Monitoring Accuracy,” eos.com. Verra’s 2026 registry overhaul with S&P Global links live remote-sensing feeds, issuing credits in near real-time. Blockchain tokenization using ERC-721 and ERC-1155 standards lowers double-counting risks, and Ethereum’s move to proof-of-stake cuts on-chain emissions by 99.975%. The oracle gap reconciling off-chain MRV with on-chain state remains a barrier for institutional block trades, but automated retirement and programmable compliance still reduce transaction costs for retail and midsize buyers. Collectively, these innovations underpin scalability for the carbon credit trading platform market.
Restraints Impact Analysis*
| Restraint | (~) % Impact on CAGR Forecast | Geographic Relevance | Impact Timeline |
|---|---|---|---|
| High Price Volatility of Carbon Credits | -2.4% | Global, particularly acute in voluntary markets | Short term (≤ 2 years) |
| Lack of Global Standardization & Fragmented Regulations | -1.8% | Global, with divergence between North America, Europe, and Asia-Pacific | Long term (≥ 4 years) |
| Rising Scrutiny of Additionality & Permanence by Rating Agencies | -1.5% | Global, concentrated in voluntary markets | Medium term (2-4 years) |
| Limited On-Chain Liquidity for Large Block Trades | -0.9% | Global, affecting blockchain-native platforms | Medium term (2-4 years) |
| Source: Mordor Intelligence | |||
High Price Volatility of Carbon Credits
Spot avoidance offsets crashed below USD 5 per ton in 2024 after REDD+ integrity probes, then rebounded in 2025 as differentiated pricing emerged [3]Leslie Hook, “Voluntary Carbon Prices Slump,” ft.com. CORSIA-eligible supply remains tight, keeping prices above USD 15, while EU ETS allowances swung between EUR 70 and EUR 115 in 2025. Platforms struggle to seed deep futures markets because standardized contracts are still nascent and market-maker incentives are low. Buyers with multi-year neutrality goals therefore face hedging gaps, dampening near-term adoption and tempering growth in the carbon credit trading platform market.
Rising Scrutiny of Additionality & Permanence
BeZero, Sylvera, and Calyx Global downgraded many forestry and renewable projects in 2024–25 for over-crediting and permanence risk. Wildfires in California and Australia forced buffer pool drawdowns, revealing insufficiency of 10–20% reversal reserves. Only 15% of projects met ICVCM Core Carbon Principles by early 2026, choking high-integrity supply and widening bid-ask spreads [4]Integrity Council for the Voluntary Carbon Market, “Core Carbon Principles Approved Projects,” icvcm.org. Platforms respond with stricter listing filters, but reduced inventory constrains short-term throughput.
*Our forecasts treat driver/restraint impacts as directional, not additive. The impact forecasts reflect baseline growth, mix effects, and variable interactions.
Segment Analysis
By Type: Compliance Schemes Anchor Revenue, Voluntary Surges on Removal Demand
Compliance venues generated 77.8% of the carbon credit trading platform market share in 2025, buoyed by the EU ETS, China’s national ETS, and North American cap-and-trade programs. The EU’s Market Stability Reserve withdrew 275 million allowances in 2024, while maritime inclusion from 2026 adds another 90 million tCO₂e obligation. California, RGGI, and South Korea collectively cap over 2 billion tons, underpinning recurring auction settlement traffic. Voluntary carbon market platforms are projected to experience significant growth through 2031, driven by corporate buyers' increasing focus on high-integrity carbon removal solutions. Article 6 bilateral linkages and selective CORSIA eligibility blur lines between regimes, demanding unified settlement rails. Tokenized voluntary credits provide new liquidity, though oracle and regulatory hurdles dampen capital markets participation.


By Application: CCS Projects Outpace Renewable Energy Growth
Renewables still dominated with 72.6% of traded volume in 2025, but scrutiny over policy additionality tempers growth. CCS-linked credits are rising at a 24.2% CAGR, spurred by the U.S. 45Q credit and Denmark’s Ørsted Kalundborg capture facility that delivers 430,000 tCO₂e annually. Large-scale direct air capture plants such as STRATOS secured forward offtakes at USD 200–300 per ton, signaling price discovery for engineered removals. Platforms must integrate stackable incentives (e.g., 45Q plus LCFS) and dynamic MRV that credits actual captured volumes, reshaping supply composition within the carbon credit trading platform market size.
By End-User: Government Procurement Accelerates
Corporates comprised 67.5% of demand in 2025, guided by SBTi rules that insist on removals for neutralization. Governments, however, are the fastest-growing buyers at 17.9% CAGR as national schemes mature and Article 6 transfers proliferate. Singapore’s tax allows 5% offset usage, ASEAN aims for mutual recognition, and Japan’s new GX-ETS widens compliance reach. Individual participation remains small but is scaling through loyalty integrations that tokenize sub-ton credits for retail redemption. Together, these dynamics diversify client segments and expand addressable revenue for the carbon credit trading platform industry.
Geography Analysis
North America controlled 36.2% of 2025 revenue, led by California’s Cap-and-Trade and a Washington-Quebec draft linkage designed to narrow allowance price gaps. Canada’s federal backstop hits CAD 170 (USD 125) in 2030, catalyzing forestry offsets, while Mexico reviews its USD 3 tax to align with USMCA.
Asia-Pacific is the fastest-growing region, forecast at 22.3% CAGR to 2031. China’s ETS will cover heavy industry by 2027 and could trade up to 11 billion tCO₂e by 2030. Southeast Asia recorded 284 projects issuing 171.5 million tCO₂e by April 2025, 73% from nature-based solutions. Japan, South Korea, and India add momentum, while EU CBAM pressures exporters to adopt internal pricing, funneling credits onto regional platforms.
Europe remains the regulatory bellwether. EU ETS auctions generated EUR 38.8 billion (USD 45.15 billion) in 2024, and maritime emissions add fresh demand from 2026. The U.K. negotiates potential relinking, Brazil’s voluntary REDD+ projects feed global supply, and Gulf states explore sector-specific schemes, signaling expanding geographic diversity for the carbon credit trading platform market.

Competitive Landscape
The Carbon Credit Trading Platform Market is moderately concentrated. Multicommodity giants CME, ICE, and EEX leverage clearing networks to list standardized futures, while specialists Xpansiv CBL, AirCarbon Exchange, and Climate Impact X emphasize registry APIs and digital MRV. CBL cleared 200 million environmental instruments in 2024. AirCarbon, licensed in Abu Dhabi, focuses on CORSIA-ready products for airlines. Climate Impact X ties satellite data to forestry issuances, shrinking verification windows.
Blockchain-native Toucan and Flowcarbon tokenize legacy credits but lack deep pools for institutional-scale blocks. Verra’s S&P Global registry upgrade supplies live MRV endpoints that exchanges can embed for dynamic issuance. White-space opportunities include permanence insurance, ICVCM index products, and Article 6 settlement rails. Vertical integrators like South Pole move upstream into origination and registry management, capturing additional value as the carbon credit trading platform market matures.
Carbon Credit Trading Platform Industry Leaders
AirCarbon Exchange (ACX)
Intercontinental Exchange (ICE)
European Energy Exchange (EEX)
CME Group Inc.
Xpansiv
- *Disclaimer: Major Players sorted in no particular order

Recent Industry Developments
- July 2025: JPMorgan’s blockchain unit began tokenizing carbon credits alongside S&P Global Commodity Insights, EcoRegistry, and the International Carbon Registry to trace asset ownership from issuance through retirement.
- July 2025: The United Kingdom, Kenya, and Singapore formed a coalition aimed at harmonizing voluntary-market rules to rebuild investor confidence ahead of COP30.
- May 2025: Zimbabwe launched a blockchain-enabled carbon credit registry to bolster transparency after previous market disruptions.
- February 2025: Above Food Ingredients announced a USD 180 million deal to acquire Palm Global Technologies, blending AI, blockchain, and carbon-credit securitization for agricultural applications.


Global Carbon Credit Trading Platform Market Report Scope
A Carbon Credit Trading Platform is a digital marketplace enabling the buying and selling of carbon credits, each representing one ton of carbon emissions reduced or removed. These platforms help organizations meet regulatory requirements or voluntary sustainability goals. Supported by frameworks such as the United Nations Framework Convention on Climate Change and systems like the European Union Emissions Trading System, they promote cost-effective emission reductions, encourage investment in green projects, and contribute to global climate mitigation efforts.
The carbon credit trading platform market is segmented by type, application, end-user, and geography. By type, the market is segmented into voluntary and compliance markets. By application, the market is segmented into renewable energy, reforestation/afforestation, carbon capture and storage, and other applications. By end-user, the market is segmented into corporates, governments, and individuals. By geography, the market is segmented into North America, Europe, Asia-Pacific, South America, and the Middle East and Africa. The report also covers market sizes and forecasts for the global carbon credit trading platform market across major countries in these regions. For each segment, market sizing and forecasts have been provided on the basis of value (USD).
| Voluntary Carbon Market Platforms |
| Compliance Carbon Market Platforms |
| Renewable Energy |
| Reforestation/Afforestation |
| Carbon Capture and Storage |
| Other Applications |
| Corporates |
| Governments |
| Individuals |
| North America | United States |
| Canada | |
| Mexico | |
| Europe | Germany |
| United Kingdom | |
| France | |
| Italy | |
| NORDIC Countries | |
| Russia | |
| Rest of Europe | |
| Asia-Pacific | China |
| India | |
| Japan | |
| South Korea | |
| ASEAN Countries | |
| Rest of Asia-Pacific | |
| South America | Brazil |
| Argentina | |
| Rest of South America | |
| Middle East and Africa | Saudi Arabia |
| United Arab Emirates | |
| South Africa | |
| Egypt | |
| Rest of Middle East and Africa |
| By Type | Voluntary Carbon Market Platforms | |
| Compliance Carbon Market Platforms | ||
| By Application | Renewable Energy | |
| Reforestation/Afforestation | ||
| Carbon Capture and Storage | ||
| Other Applications | ||
| By End-User | Corporates | |
| Governments | ||
| Individuals | ||
| By Geography | North America | United States |
| Canada | ||
| Mexico | ||
| Europe | Germany | |
| United Kingdom | ||
| France | ||
| Italy | ||
| NORDIC Countries | ||
| Russia | ||
| Rest of Europe | ||
| Asia-Pacific | China | |
| India | ||
| Japan | ||
| South Korea | ||
| ASEAN Countries | ||
| Rest of Asia-Pacific | ||
| South America | Brazil | |
| Argentina | ||
| Rest of South America | ||
| Middle East and Africa | Saudi Arabia | |
| United Arab Emirates | ||
| South Africa | ||
| Egypt | ||
| Rest of Middle East and Africa | ||


Key Questions Answered in the Report
How fast is the carbon credit trading platform market expected to grow through 2031?
The Carbon Credit Trading Platform Market size is expected to grow from USD 168.30 million in 2025 to USD 198.43 million in 2026 and is forecast to reach USD 433.01 million by 2031 at 16.89% CAGR over 2026-2031.
Which segment currently dominates traded volume?
Compliance schemes, led by the EU ETS and China’s ETS, captured 77.8% of market share in 2025.
What drives the surge in corporate demand for credits?
Science Based Targets initiative rules favor removal credits, pushing firms like Microsoft to sign long-term offtake agreements that secure high-integrity supply.
Why are CCS credits gaining prominence?
U.S. 45Q incentives and large projects such as Ørsted’s Kalundborg plant and the STRATOS DAC facility have improved economics, lifting CCS credit issuance at a 24.2% CAGR.
How is technology lowering transaction costs?
Satellite-based MRV and blockchain tokenization cut verification expenses by up to 70% and automate retirement, shrinking settlement cycles from months to days.
Page last updated on:


