Coal Bed Methane (CBM) Market Size and Share
Market Overview
| Study Period | 2020 - 2030 |
|---|---|
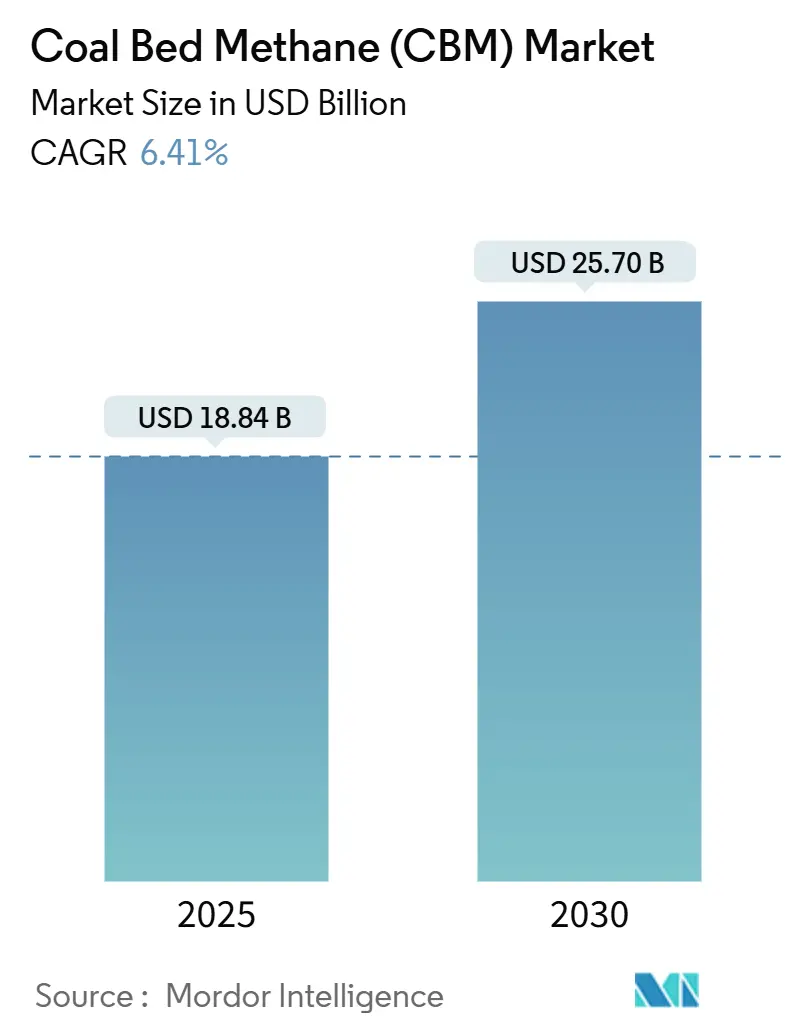
| Market Size (2025) | USD 18.84 Billion |
| Market Size (2030) | USD 25.70 Billion |
| Growth Rate (2025 - 2030) | 6.41% CAGR |
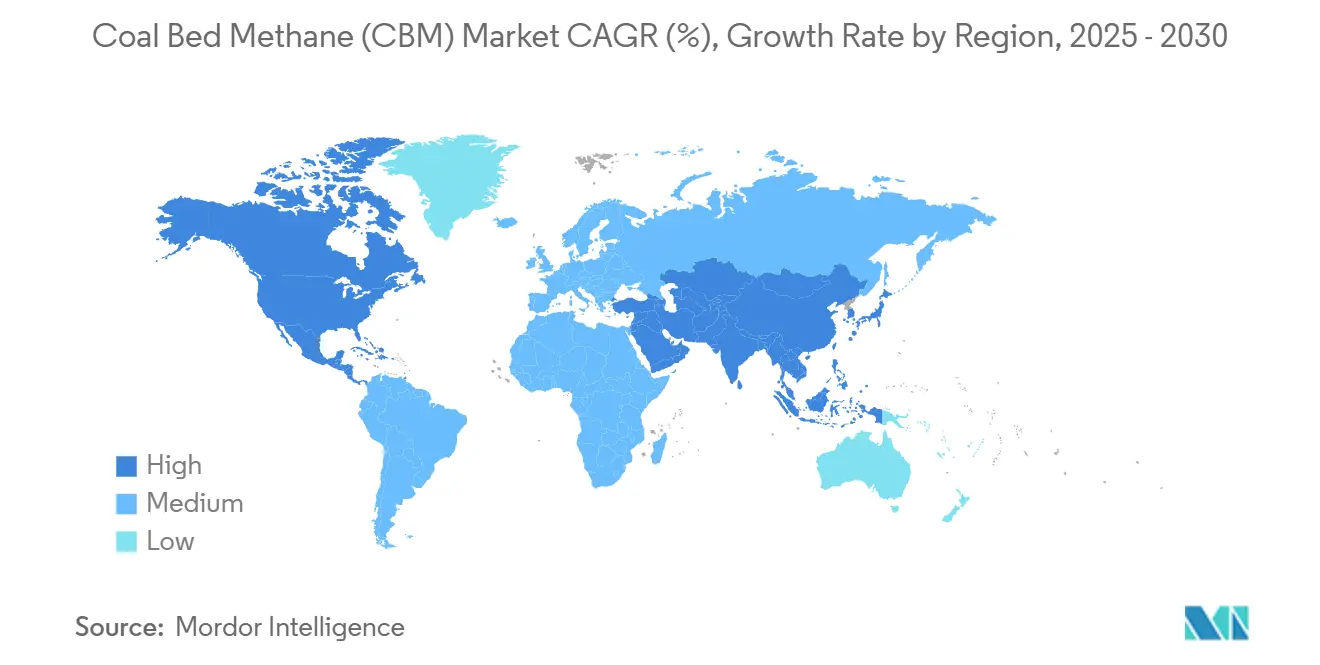
| Fastest Growing Market | Asia Pacific |
| Largest Market | North America |
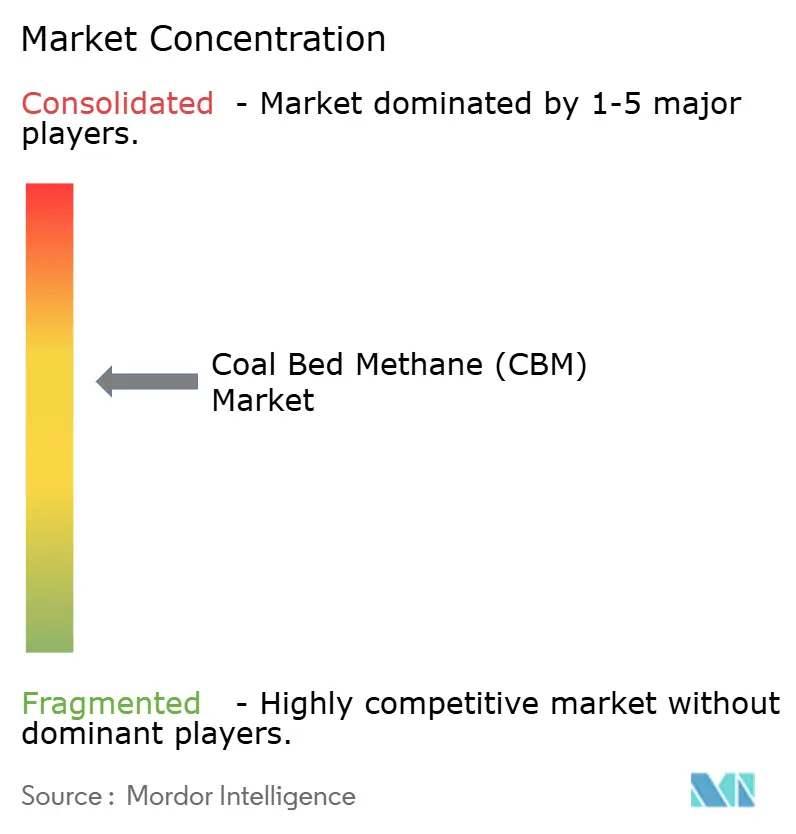
| Market Concentration | Medium |
Major Players *Disclaimer: Major Players sorted in no particular order Image © Mordor Intelligence. Reuse requires attribution under CC BY 4.0. | |
Coal Bed Methane (CBM) Market Analysis by Mordor Intelligence
The Coal Bed Methane Market size is estimated at USD 18.84 billion in 2025, and is expected to reach USD 25.70 billion by 2030, at a CAGR of 6.41% during the forecast period (2025-2030).
Demand is buoyed by rapid uptake of gas-fired generation assets, the sector’s role as a transitional fuel under tightening carbon caps, and widening deployment of advanced horizontal wells that boost recovery factors. The coal bed methane market also benefits from policy incentives that monetize methane capture, while emerging projects that reform CBM into low-carbon hydrogen broaden downstream optionality. Chinese producers set the growth pace, with Shanxi delivering 3.53 billion cubic meters in Q1 2025, a 14.5% year-over-year rise.(1)Source: Azernews Staff, “China's Coal Hub Shanxi Sees Record Coalbed Methane Output in Q1,” Azernews, azernews.az North America retains scale advantages through mature infrastructure, yet Asia-Pacific delivers the fastest volume gains at a 7.7% CAGR thanks to prolific discoveries and supportive policy frameworks.(2)Source: Natural Gas World Desk, “CNOOC Says Finds Large Coal Seam Gas Field in North China,” Natural Gas World, naturalgasworld.com
Key Report Takeaways
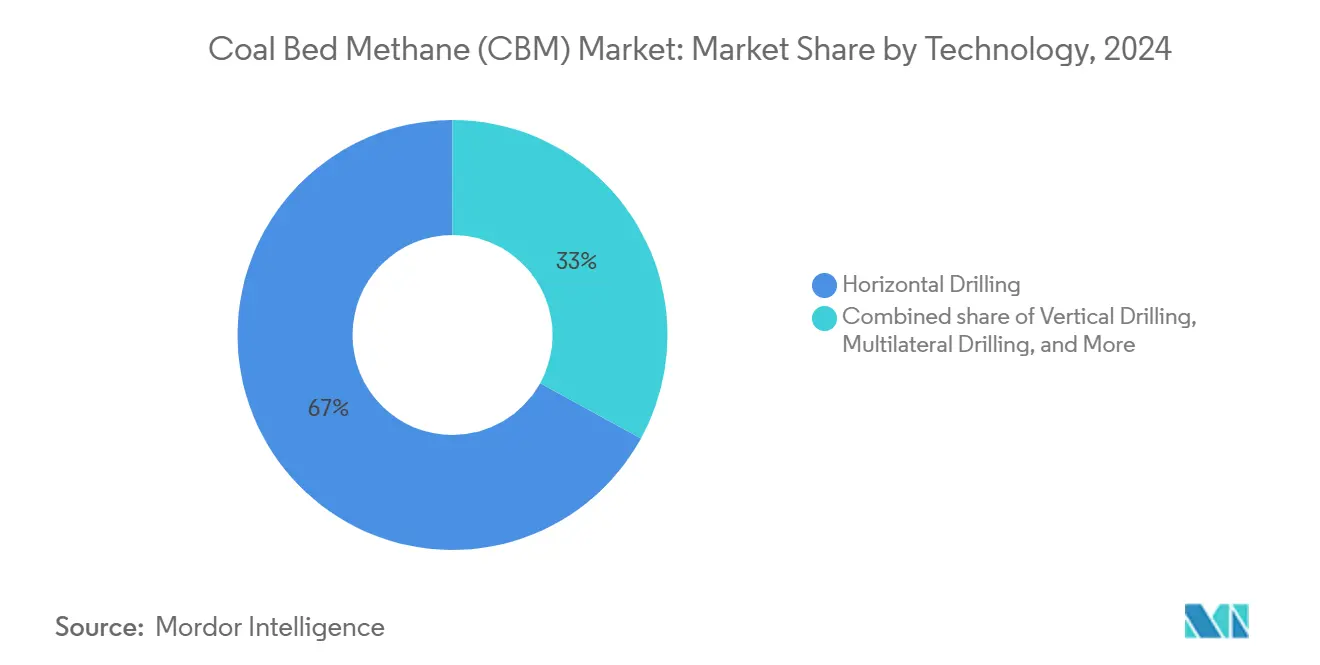
- By technology, horizontal drilling led the coal bed methane market with 67% of the market share in 2024, while multilateral and extended-reach schemes are projected to post the fastest 7.5% CAGR through 2030.
- By application, power generation accounted for a 41.3% share of the coal bed methane market size in 2024, while transportation fuel demand is expected to grow at an 8.2% CAGR through 2030.
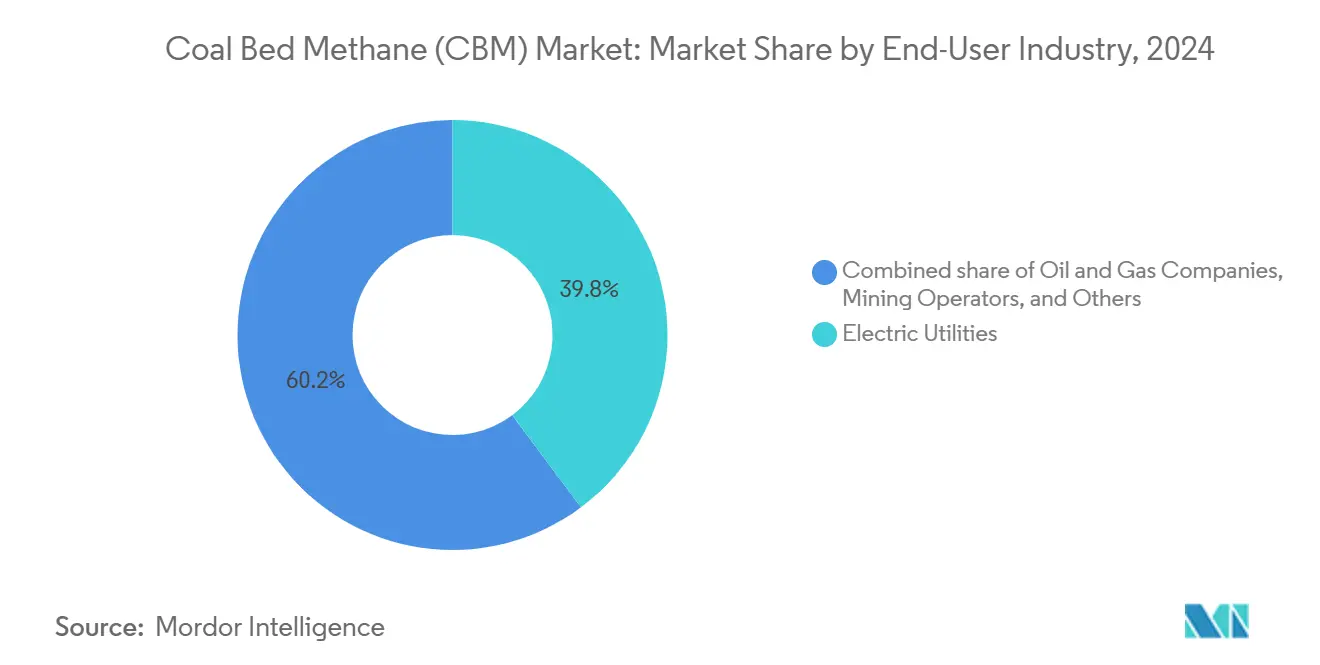
- By end-user, electric utilities captured 39.8% of the coal bed methane market size in 2024, and oil & gas companies are projected to expand at a 7.1% CAGR through 2030.
- By geography, North America commanded 40.5% of the coal bed methane market share in 2024. Asia-Pacific is expected to log the highest 7.7% CAGR during the forecast horizon.
Global Coal Bed Methane (CBM) Market Trends and Insights
Drivers Impact Analysis*
| Driver | (~) % Impact on CAGR Forecast | Geographic Relevance | Impact Timeline | |
|---|---|---|---|---|
| Surging gas-fired power capacity additions | 1.80% | North America, Asia-Pacific | Medium term (2-4 years) | |
| Stringent CO₂ regulations favoring low-carbon fuels | 1.50% | EU, North America | Long term (≥ 4 years) | |
| Technological advances in horizontal & multilateral drilling | 1.20% | North America, China | Short term (≤ 2 years) | |
| Methane-to-hydrogen project pipeline expansion | 0.90% | North America, Europe | Long term (≥ 4 years) | |
| Commercializing stranded coal assets via CBM extraction | 0.70% | Asia-Pacific | Medium term (2-4 years) | |
| Carbon-credit revenue from methane capture | 0.60% | EU, California | Medium term (2-4 years) | |
| Source: Mordor Intelligence | ||||
Surging Gas-Fired Power Capacity Additions
Developers have 18.7 GW of combined-cycle capacity slated for commissioning by 2028, with 4.3 GW already under construction.(3)Source: U.S. Energy Information Administration Analysts, “Electric Generators Plan More Natural Gas-Fired Capacity After Few Additions in 2024,” eia.gov New builds like the Intermountain Power Project will co-fire hydrogen, reflecting a wider pivot toward cleaner combustion mixes. Nigeria’s 1,350 MW Gwagwalada station exemplifies CBM’s penetration in emerging markets. Secure, competitively priced supplies from the coal bed methane market help utilities hedge fuel volatility as they decommission coal assets. The Philippines is poised to double its gas-fired generation share to nearly 35% by 2050,(4)Zero Carbon Analytics Team, “Increasing Gas Imports Will Raise Electricity Prices in the Philippines,” zerocarbon-analytics.org underscoring the global expansion of gas plants that underpin CBM demand.
Stringent CO₂ Regulations Favoring Low-Carbon Fuels
The EU Methane Regulation 2024/1787 imposes rigorous leak detection and flaring bans from January 2025, prompting coal operators to capture and market CBM rather than vent it. California’s Mine Methane Capture protocol allows verified projects to monetize offsets. A U.S. waste-emissions charge that rises from USD 900 per metric ton in 2024 to USD 1,500 by 2026 further incentivizes capture. Canada’s Clean Electricity Regulations cap plant emissions at 65 t CO₂/GWh from 2035, favoring CBM over coal for baseload supply. Together, these measures expand the coal bed methane market as emitters seek compliant, low-carbon gas streams.
Technological Advances in Horizontal & Multilateral Drilling
Record-length wells now exceed 3,700 m laterally, delivering superior seam contact that lifts deliverability. Rotary steerable assemblies and real-time telemetry suppress torque and drag complications, trimming spud-to-TD cycle times. Chevron and Halliburton’s closed-loop fracturing platform automates stage sequencing for optimized fracture geometry. Tree-like well architectures deployed in the Qinshui Basin stabilize fragile coal roofs while tapping multiple seams. Large-diameter, precise directional drilling increases the average gas concentration to 80.2% and enhances safety through predictive analytics, underscoring the technology’s pivotal role in scaling the coal bed methane market.
Methane-to-Hydrogen Project Pipeline Expansion
Hycamite launched Europe’s largest methane-splitting plant in 2024, validating commercial turquoise hydrogen production with solid-carbon co-products. The USD 5 billion Lake Charles Methanol II venture will annually convert CBM and other gases into 3.6 million tons of blue methanol while sequestering 1 million tons of CO₂. Expanded U.S. Section 45V and 45Q credits reduced levelized hydrogen costs, enabling coal bed methane market participants to diversify their revenue. Methane pyrolysis yields hydrogen at $3.14/kg, well below green alternatives, thereby strengthening long-run CBM monetization pathways.
Restraints Impact Analysis*
| Restraint | (~) % Impact on CAGR Forecast | Geographic Relevance | Impact Timeline |
|---|---|---|---|
| Produced-water treatment & disposal costs | -1.1% | Global, with acute challenges in water-scarce regions | Short term (≤ 2 years) |
| Price volatility of natural gas | -0.8% | Global, with regional variations in pricing mechanisms | Medium term (2-4 years) |
| Emergence of renewable-synthetic methane alternatives | -0.6% | EU & North America core, expanding to Asia-Pacific | Long term (≥ 4 years) |
| Land-use conflicts in ecologically sensitive basins | -0.4% | North America & Australia, with emerging concerns in Asia-Pacific | Medium term (2-4 years) |
| Source: Mordor Intelligence | |||
Produced-Water Treatment & Disposal Costs
CBM wells coproduce significant brines requiring multi-stage conditioning before discharge or reuse. Membrane filtration for irrigation-grade water costs approximately AU $ 1.24 per cubic meter when amortizing AU $800 million in treatment assets. In the Permian, produced-water volumes have increased sixfold since 2010, straining injection capacity and driving up disposal tariffs. Fouling remains the Achilles heel of membrane systems, elevating chemical consumption and operational downtime. Veolia’s crystallizer solution recycles 98% of fluids, but it incurs notable capital and energy costs. Regulatory gray zones, highlighted by New Mexico’s Strategic Water Supply study on off-field reuse, cloud the economics of scaling advanced treatment.
Price Volatility of Natural Gas
Steam methane reforming costs fluctuate between USD 1.1 and 2.6/kg H₂ as feedstock prices fluctuate. Philippine generation tariffs could rise to 24% by 2029, amid increased reliance on LNG imports. U.S. associated-gas growth, projected at 15% by 2050, exerts downward price pressure that can compress CBM profit margins. India is expected to face a 60% demand growth by 2030, with only half of this demand met domestically, leaving CBM operators exposed to import-linked benchmarks. Coal-bed methane projects typically require gas prices above USD 3-4/MMBtu to remain economically viable, heightening their sensitivity to cyclical downturns.
*Our forecasts treat driver/restraint impacts as directional, not additive. The impact forecasts reflect baseline growth, mix effects, and variable interactions.
Segment Analysis
By Technology: Horizontal Drilling Raises Recovery Efficiency
Horizontal wells claimed 67% of the coal bed methane market share in 2024 and are forecast to log a 7.5% CAGR to 2030 as operators prioritize seam-perpendicular trajectories that maximize cleat exposure. The coal bed methane market size derived from horizontal completions is projected to reach USD 17.2 billion by 2030, reflecting superior drainage radius and reduced water coning. Multilateral configurations extend bore reach without requiring additional surface pads, thereby reducing land disturbance. Underbalanced drilling preserves fragile coal permeability but remains a niche approach. Vertical wells retain utility in shallow, high-permeability basins where capital discipline outweighs incremental flow gains. The technology mix underscores how recoverability advances underpin future growth of the coal bed methane market.
Extended-reach laterals regularly surpass 3,700 m after breakthroughs in rotary steerable systems and friction reducers that lift average penetration rates from 24.4 m/d to 64.9 m/d.(5)Source: Petroleum Drilling Techniques Authors, “Key Technologies for Drilling and Completing Horizontal Wells with Ultra-Long Sections,” syzt.com.cn Tree-like well designs, built around main bores with laterals and sub-laterals, cut rig time and improve inflow profiles in complex multilayer seams. Large-diameter directional drilling further enhances productivity by sustaining high gas concentrations, limiting dilution by formation water. These innovations drive the coal-bed methane market toward greater economies of scale.


By Application: Power Generation Dominance Faces Transport Upside
Power plants accounted for 41.3% of the coal bed methane market size in 2024, supported by 18.7 GW of upcoming combined-cycle capacity that addresses base-load and mid-merit demand. Co-firing initiatives with up to 30% hydrogen enhance environmental credentials without requiring costly boiler overhauls, further solidifying CBM’s role in utility portfolios. Nigeria’s Gwagwalada project alone increases regional gas demand by 11%, highlighting the emerging economies’ reliance on CBM as coal exits power generation stacks.
Transportation, however, is forecast to rise at an 8.2% CAGR to 2030 as LNG truck fleets expand. China recorded 71,600 heavy-duty LNG truck sales in early 2024, a 144% increase driven by fuel cost advantages and tightening emission rules.(6)Source: Mysteel Market Intelligence, “Surging Heavy-Duty LNG Truck Sales Boost LNG Consumption in China,” mysteel.net CNX Resources’ ZeroHP CNG concept harnesses reservoir pressure to eliminate mechanical compressors, trimming lifecycle costs and greenhouse gases by 80 million t CO₂e annually. Downstream, small-scale liquefaction via Clean mLNG technologies broadens distribution to remote fleets, catalyzing additional penetration of the coal bed methane market.
By End-User Industry: Utilities Hold Scale, Oil & Gas Firms Accelerate
Electric utilities controlled 39.8% of the coal bed methane market size in 2024, underpinning power contracts that hedge exposure to volatile LNG hubs. Yet integrated oil & gas companies are poised for a 7.1% CAGR as they blend CBM with conventional portfolios to meet shareholder decarbonization goals. CNOOC’s 100 billion m³ discovery in north China marks a pivot toward unconventional gas with plans for more than 100 appraisal wells. Mining groups exploit CBM for both ventilation and revenue, converting safety liabilities into a sellable commodity. Fertilizer and chemical makers round out demand via secure feedstock arrangements.
Arch Resources and CONSOL Energy’s merger into Core Natural Resources illustrates consolidation aimed at marrying coal assets with CBM monetization. Such combinations enhance bargaining power for pipeline access and service procurement, thereby influencing competitive dynamics within the coalbed methane market.
Geography Analysis
North America retained a 40.5% stake in the coalbed methane market in 2024, thanks to mature takeaway pipelines like the 2 Bcf/d Mountain Valley route, which links Marcellus gas to southeastern utilities. Regulatory familiarity, readyfield services, and proximity to data-center loads fortify regional demand. Nonetheless, shale gas oversupply tempers new CBM drilling unless paired with tax-advantaged carbon capture or hydrogen production. Canada’s forthcoming 65 t CO₂/GWh limit tightens coal retirements and tilts generation toward CBM-fired units.
Asia-Pacific is projected to deliver the swiftest expansion at a 7.7% CAGR, propelled by China’s Q1 2025 record output and CNOOC’s massive reserve adds. India’s ONGC launched commercial output at Jharia in December 2024, aiming for 0.4 million m³/d by 2027. Indonesia holds 453 Tcf of in-place gas but awaits regulatory certainty to unlock volume. Australia’s CBM-based LNG supply chain remains robust, while Mongolia approved 45 wells at Gurvantes XXXV, opening a fresh frontier.
Europe’s priorities revolve around compliance with the Methane Regulation, including mandatory leak detection and venture curbs starting 2025. Operators weigh high monitoring costs against limited seam thickness, moderating growth. In South America, the Middle East & Africa, early opportunities, such as Botswana’s Serowe resource upgrade to 454 Bcf, draw interest from independents seeking a first-mover advantage. These frontier basins represent an optional long-dated upside for the coalbed-bed methane market.

Competitive Landscape
The coal bed methane market exhibits moderate concentration with regionally dominant players but no single entity exceeding half of global production. Chinese state-backed firms leverage preferential financing and access to acreage to accelerate projects, while North American independents focus on drilling efficiency and water recycling innovations. Operators compete on horizontal drilling know-how, produced-water management, and downstream integration into hydrogen or LNG value chains.
Arch Resources and CONSOL Energy’s union targets USD 110–140 million in annual synergies through shared rail, processing, and CBM development. CNX Resources’ alliance with NuBlu Energy utilizes Clean mLNG micro-liquefaction to penetrate the transport fuels market, illustrating technology-led differentiation. BKV Corporation’s USD 500 million carbon-capture venture with Copenhagen Infrastructure Partners reflects strategic moves to monetize Section 45Q incentives while lowering scope-1 emissions. Collectively, these maneuvers shape a competitive arena where project economics hinge on cost-effective drilling and the valuation of carbon credits.
Coal Bed Methane (CBM) Industry Leaders
China United Coalbed Methane Co. Ltd.
PetroChina (CBM Division)
Santos Ltd.
ConocoPhillips
Arrow Energy Pty Ltd.
- *Disclaimer: Major Players sorted in no particular order

Recent Industry Developments
- March 2025: CNOOC confirmed a north-China CBM discovery exceeding 100 billion m³ in proven reserves with over 100 exploration wells planned.
- January 2025: ONGC commenced commercial CBM output at Jharia with an initial 5,000–10,000 m³/d and expansion to 400,000 m³/d by 2027.
- December 2024: TMK Energy secured environmental clearance for 45 new wells at Gurvantes XXXV in Mongolia.
- August 2024: Arch Resources and CONSOL Energy agreed to merge, forming Core Natural Resources, targeting USD 140 million annual synergies.


Global Coal Bed Methane (CBM) Market Report Scope
| Horizontal Drilling |
| Vertical Drilling |
| Multilateral Drilling |
| Underbalanced Drilling |
| Power Generation |
| Industrial Fuel |
| Residential and Commercial Heating |
| Transportation (CNG/LNG) |
| Oil and Gas Companies |
| Electric Utilities |
| Mining Operators |
| Others (Chemicals, Fertilizers) |
| North America | United States |
| Canada | |
| Mexico | |
| Europe | Russia |
| United Kingdom | |
| Germany | |
| Poland | |
| Rest of Europe | |
| Asia-Pacific | China |
| India | |
| Australia | |
| Indonesia | |
| Rest of Asia-Pacific | |
| South America | Brazil |
| Argentina | |
| Colombia | |
| Rest of South America | |
| Middle East and Africa | United Arab Emirates |
| Saudi Arabia | |
| Oman | |
| South Africa | |
| Rest of Middle East and Africa |
| By Technology | Horizontal Drilling | |
| Vertical Drilling | ||
| Multilateral Drilling | ||
| Underbalanced Drilling | ||
| By Application | Power Generation | |
| Industrial Fuel | ||
| Residential and Commercial Heating | ||
| Transportation (CNG/LNG) | ||
| By End-User Industry | Oil and Gas Companies | |
| Electric Utilities | ||
| Mining Operators | ||
| Others (Chemicals, Fertilizers) | ||
| By Geography | North America | United States |
| Canada | ||
| Mexico | ||
| Europe | Russia | |
| United Kingdom | ||
| Germany | ||
| Poland | ||
| Rest of Europe | ||
| Asia-Pacific | China | |
| India | ||
| Australia | ||
| Indonesia | ||
| Rest of Asia-Pacific | ||
| South America | Brazil | |
| Argentina | ||
| Colombia | ||
| Rest of South America | ||
| Middle East and Africa | United Arab Emirates | |
| Saudi Arabia | ||
| Oman | ||
| South Africa | ||
| Rest of Middle East and Africa | ||


Key Questions Answered in the Report
What is the current global value of coal bed methane?
The coal bed methane (CBM) market will reach USD 18.84 billion in 2025.
How fast is demand projected to rise over the next five years?
Aggregate demand is forecast to expand at a 6.41% CAGR, pushing value to USD 25.70 billion by 2030.
Which region is adding the most new supply?
Asia-Pacific leads growth with a 7.7% CAGR, driven by record Chinese output and new Indian wells.
Which extraction technology offers the greatest recovery gains?
Horizontal drilling delivers the highest recovery efficiency and already accounts for 67% of global output.
How do recent methane regulations influence CBM project economics?
Tight EU and North American rules turn captured mine gas into a saleable asset, adding carbon-credit revenue while avoiding venting penalties.
What is the single largest cost challenge for producers?
Treating and disposing large volumes of produced water remains the top cost headwind, trimming forecast CAGR by about 1.1 percentage points.
Page last updated on:


