Capacitor Bank Market Size and Share
Market Overview
| Study Period | 2021 - 2031 |
|---|---|
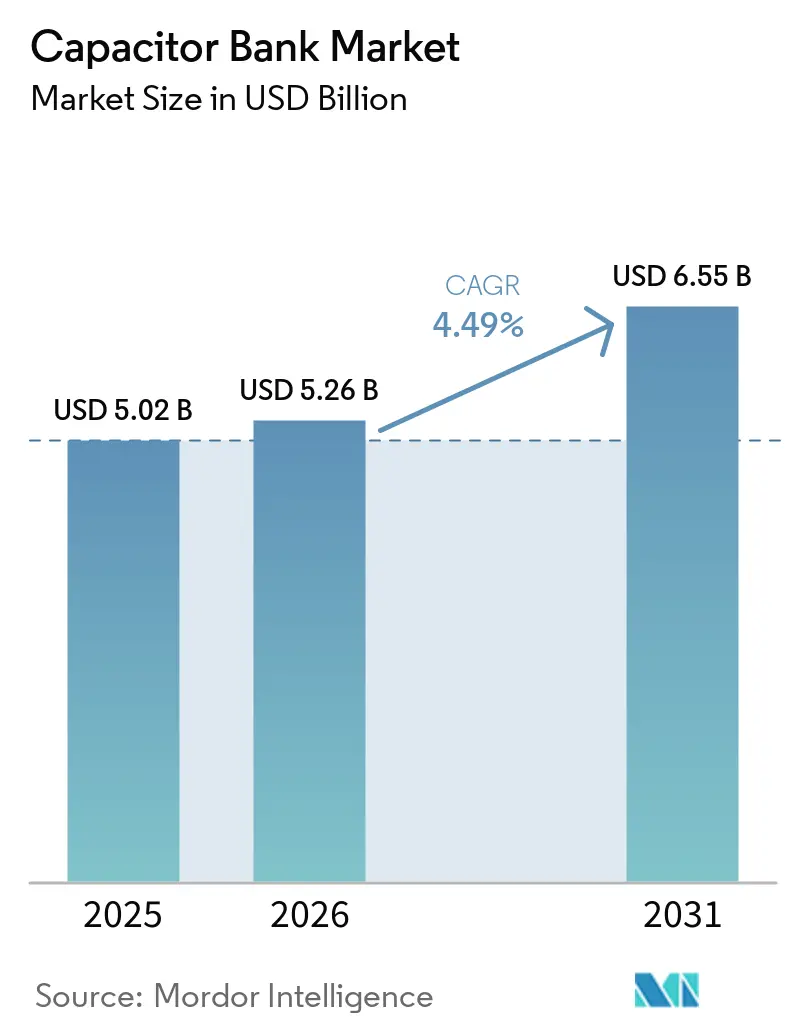
| Market Size (2026) | USD 5.26 Billion |
| Market Size (2031) | USD 6.55 Billion |
| Growth Rate (2026 - 2031) | 4.49% CAGR |
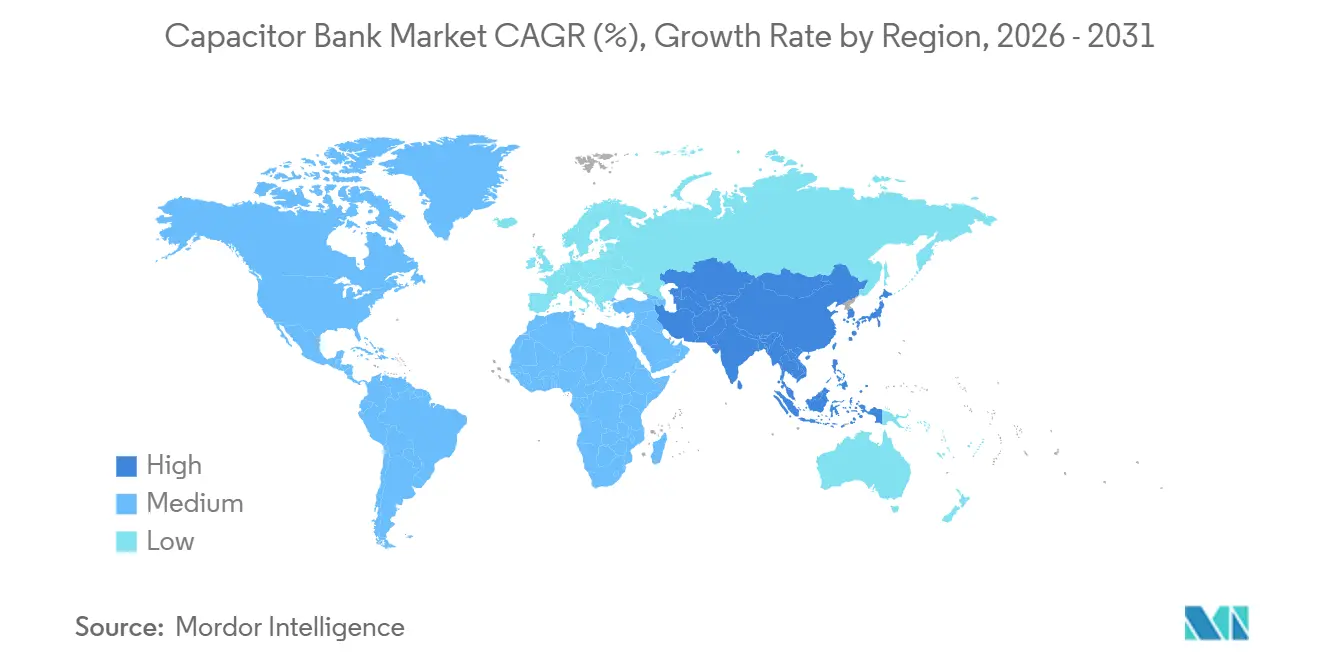
| Fastest Growing Market | Asia Pacific |
| Largest Market | Asia Pacific |
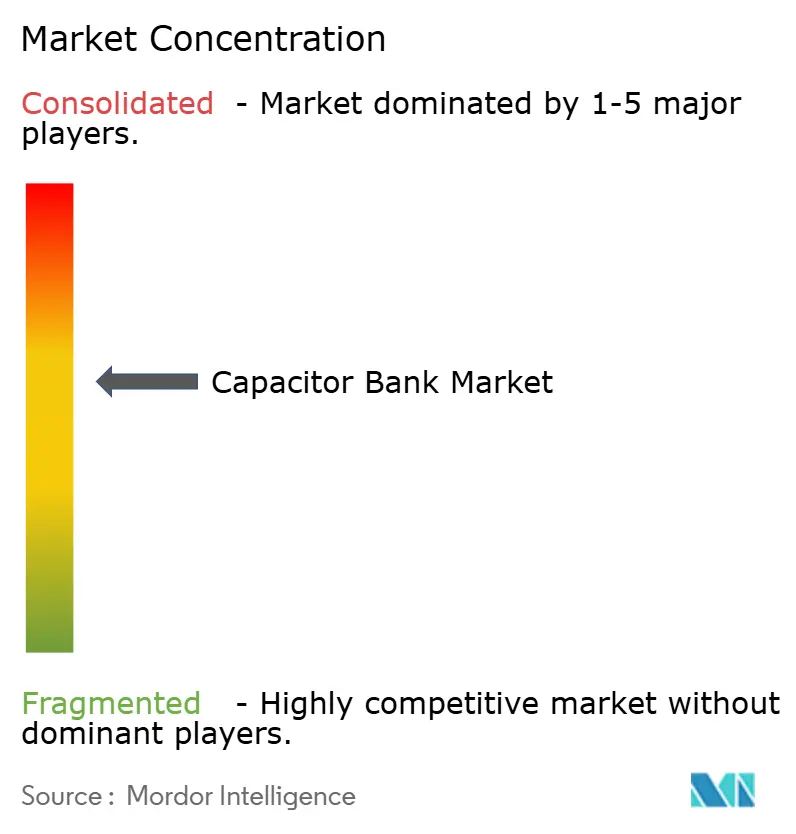
| Market Concentration | Medium |
Major Players *Disclaimer: Major Players sorted in no particular order Image © Mordor Intelligence. Reuse requires attribution under CC BY 4.0. | |
Capacitor Bank Market Analysis by Mordor Intelligence
The Capacitor Bank Market size is expected to increase from USD 5.02 billion in 2025 to USD 5.26 billion in 2026 and reach USD 6.55 billion by 2031, growing at a CAGR of 4.49% over 2026-2031. Rising penetration of inverter-based renewable generation, expanding electric-vehicle charging infrastructure, and escalating power-quality penalties are reshaping procurement priorities in every region. Utilities are shifting from passive, fixed-step equipment toward digitally monitored capacitor banks that communicate with supervisory control and data-acquisition (SCADA) platforms, while industrial customers favor metal-enclosed assemblies that fit within constrained plant footprints. Medium-voltage installations currently anchor nearly half of revenue because most distribution substations and wind-farm collector systems operate in the 10 kV–69 kV band, yet high-growth pockets are emerging in renewable-integration sites where dynamic var support is essential. Competitive differentiation hinges on compliance with IEC 60871 and IEEE 18, delivery speed for project-specific ratings, and the ability to integrate predictive switching algorithms that limit contact wear and extend service life.
Key Report Takeaways
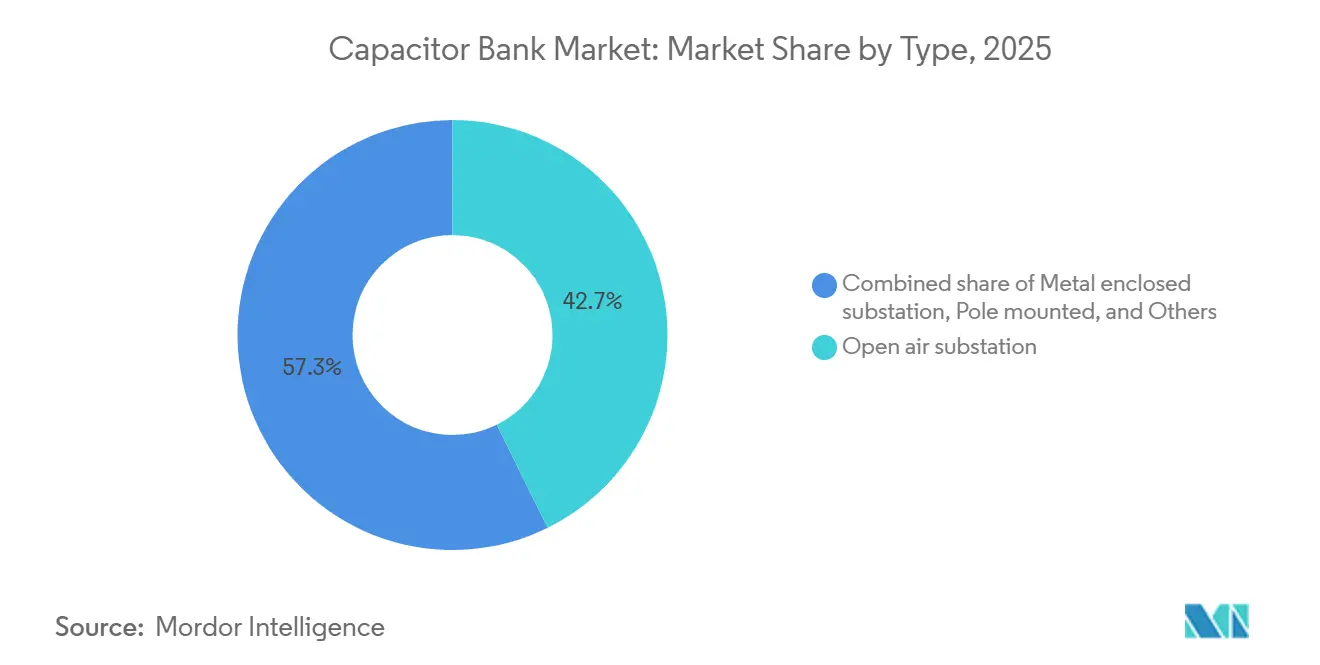
- By Type, open-air substation configurations captured 42.7% of the capacitor bank market share in 2025, while metal-enclosed designs are advancing at a 5.7% CAGR through 2031.
- By Voltage Class, medium-voltage installations led with 47.9% of the capacitor bank market share in 2025, and advancing at a 4.8% CAGR through 2031.
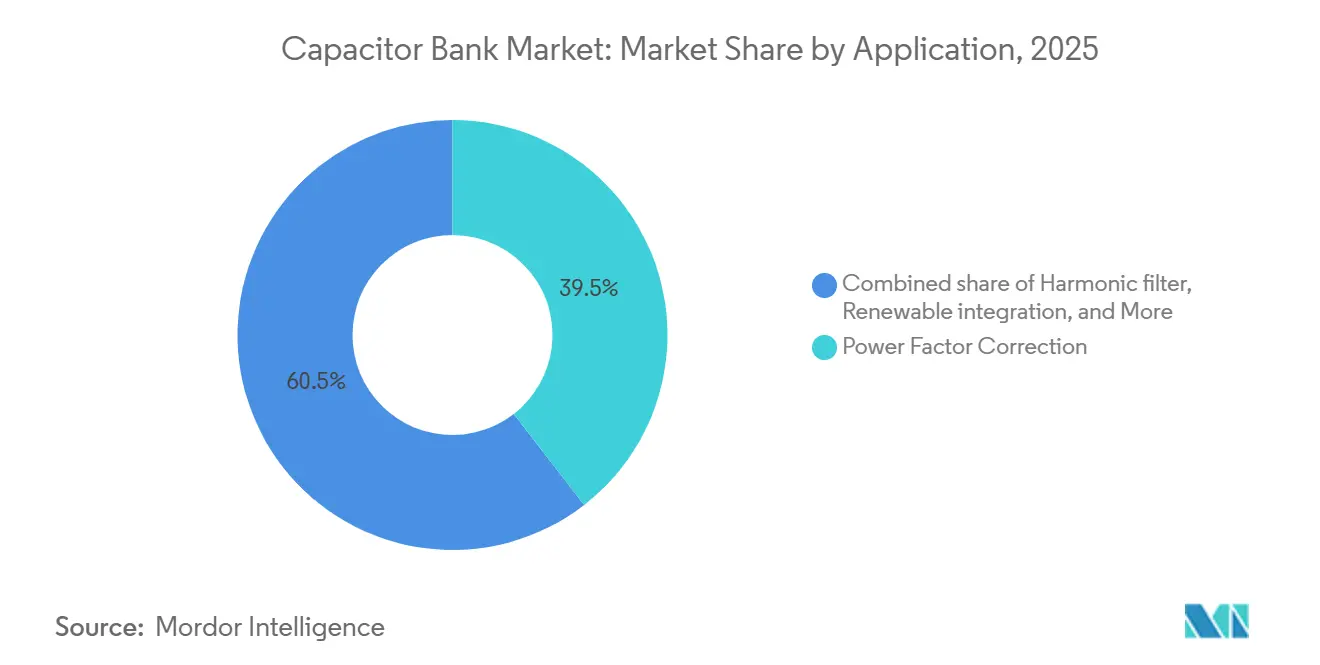
- By Application, power factor correction led with 39.5% of the capacitor bank market share in 2025; renewable integration is projected to expand at a 6.6% CAGR to 2031.
- By End-User, industrial facilities accounted for 49.8% share of the capacitor bank market size in 2025 and are set to grow at a 5.0% CAGR through 2031.
- By Geography, Asia-Pacific commanded 45.2% share of the capacitor bank market size in 2025 and is progressing at a 5.2% CAGR to 2031.
Note: Market size and forecast figures in this report are generated using Mordor Intelligence’s proprietary estimation framework, updated with the latest available data and insights as of January 2026.
Global Capacitor Bank Market Trends and Insights
Drivers Impact Analysis*
| Driver | (~) % Impact on CAGR Forecast | Geographic Relevance | Impact Timeline |
|---|---|---|---|
| Grid-modernization & DER build-out | +1.2% | Global, concentrated in North America, Europe, China | Medium term (2-4 years) |
| Surge in EV charging infrastructure | +0.8% | North America, Europe, China, urban ASEAN | Medium term (2-4 years) |
| Electrification of heat-intensive industries | +0.7% | APAC, Germany, Nordics | Long term (≥ 4 years) |
| Rising power-quality penalties from utilities | +0.6% | Europe, regulated North America | Short term (≤ 2 years) |
| Breakthroughs in dry-type polypropylene film | +0.5% | China, Germany, Japan, India | Medium term (2-4 years) |
| AI-enabled predictive switching of capacitor banks | +0.4% | North America, Europe, China | Long term (≥ 4 years) |
| Source: Mordor Intelligence | |||
Grid-modernization & DER build-out
Utilities worldwide are hardening grids to accommodate bidirectional flows from rooftop solar, community batteries, and utility-scale renewables. MISO’s 2025 plan alone earmarks USD 12.3 billion for 432 projects that include 97 MVAr of new or relocated capacitor capacity across Minnesota and Iowa substations.[1]Midcontinent Independent System Operator, “MTEP25 Transmission Expansion Plan,” misoenergy.org Southern California Edison is embedding automated capacitor-bank controllers across its distribution feeders to manage midday voltage climb caused by distributed photovoltaics.[2]Southern California Edison, “2025 Grid Modernization Filing,” sce.com Eversource Energy has budgeted USD 16.2 billion through 2028, with a portion dedicated to var-dispatch upgrades that allow second-level switching in response to behind-the-meter storage injections.[3]Eversource Energy, “Capital Investment Plan 2025–2028,” eversource.com These programs convert the capacitor bank market from a replacement cycle to an expansion cycle because each new feeder section now needs local var support. Suppliers offering turnkey enclosures with SCADA interfaces and health-monitoring diagnostics are positioned to win multiyear framework agreements with transmission system operators.
Surge in EV Charging Infrastructure
Fast chargers impose lagging power factors as low as 0.85, forcing utilities to mandate on-site compensation when connected load exceeds 1 MW. IEEE field tests show a 350 kW charger can draw 100 kVAr, equivalent to the reactive demand of 20 homes.[4]IEEE, “Reactive Power Compensation in Wind Farms,” ieee.org CAISO’s 2025-2026 study specifies series-capacitor insertion on two 70 kV corridors to counteract Bay-Area charging-related voltage sag. Property developers, therefore, purchase low-voltage capacitor cabinets that commission in weeks without utility studies, a niche where Schneider Electric and Eaton compete on delivery speed. As vehicle adoption accelerates, a dual-channel opportunity emerges: utilities procure medium-voltage banks for feeder stiffening, while charging-network operators buy modular units for depot installations.
Electrification of Heat-Intensive Industries
Steel mills, cement kilns, and petrochemical crackers are electrifying furnaces to curb carbon emissions. A 100-ton arc furnace swings reactive demand by ±30 MVAr within milliseconds, pushing flicker beyond IEC 61000 limits unless a detuned capacitor-filter bank responds instantly. Toshiba’s JPY 55 billion expansion doubles capacity for engineered capacitor assemblies incorporating 5.67% reactors that shift resonant frequency above the fifth harmonic. China’s Jiayuguan NingSheng hybrid storage plant pairs 25 MW of supercapacitors with traditional banks to segregate steady-state and transient duties. Over the long term, demand migrates toward integrated power-quality skids bundling capacitors with active filters, enlarging ticket size per project even as pure-capacitor volumes flatten.
Rising Power-Quality Penalties from Utilities
Ofgem’s RIIO-3 regime doubles transmission network use-of-system charges from April 2026, penalizing industrial customers operating below 0.95 power factor. Netflix documented USD 2 million in annual savings after installing low-voltage automatic banks that correct data-center power factor to 0.98. Comparable tariffs are spreading to regulated U.S. markets where investor-owned utilities seek compensation for reactive supply, accelerating payback to under three years in many plants. The short-term uplift is strongest in Europe and North America, but Asian regulators are drafting similar rules as renewable penetration climbs.
Restraints Impact Analysis*
| Restraint | (~) % Impact on CAGR Forecast | Geographic Relevance | Impact Timeline |
|---|---|---|---|
| MLCC supply-chain volatility spilling into film capacitors | -0.6% | Global, acute in Asia-Pacific | Short term (≤ 2 years) |
| Slow utility cap-ex cycles in price-controlled regions | -0.5% | Europe, North America, South America | Medium term (2-4 years) |
| Fire-event recalls in oil-impregnated banks | -0.3% | North America, Europe | Short term (≤ 2 years) |
| Increasing competition from STATCOMs & SVCs | -0.7% | Global, especially renewables and transmission | Long term (≥ 4 years) |
| Source: Mordor Intelligence | |||
MLCC supply-chain volatility spilling into film capacitors
AI-server demand pulled multilayer ceramic capacitor (MLCC) production toward high-capacitance grades, reducing metallization capacity for film devices. Supplyframe recorded 52-week MLCC lead times in early 2024, and TTI reported film-capacitor lead times stretching to 19 weeks in late 2025, up 46% from pre-pandemic norms. Smaller capacitor-bank assemblers without strategic sourcing contracts face component shortages that delay project commissioning. Mitigation hinges on dual-sourcing and long-term volume agreements, advantages enjoyed by Tier 1 vendors but not readily available to regional specialists.
Slow Utility Cap-Ex Cycles in Price-Controlled Regions
Multi-year rate cases lock in budgets, limiting discretionary spending on reactive-power assets. Ofgem’s RIIO-3 funnel prioritizes offshore links over substation upgrades, crowding out capacitor replacements until equipment fails in service. In South America, Transener operates under tariffs frozen since 2016, deferring noncritical banks indefinitely. Vendors, therefore, emphasize refurbishment kits, element swaps, and controller retrofits that prolong life without triggering full procurement cycles.
*Our forecasts treat driver/restraint impacts as directional, not additive. The impact forecasts reflect baseline growth, mix effects, and variable interactions.
Segment Analysis
By Type: Metal-Enclosed Designs Gain Urban Traction
Metal-enclosed assemblies accounted for a growing slice of the capacitor bank market in 2025 and are projected to grow at a 5.7% CAGR as urban utilities prioritize compact, fire-rated gear. Open-air yards still represent 42.7% of installations because rural substations have ample land, but their growth lags under tightening environmental constraints. Pole-mounted units remain popular in rural feeders where linemen can service equipment without pad construction. Other mobile or containerized banks address temporary grid reinforcement at construction sites and mines, creating a niche for plug-and-play cabinets that deploy within days.
Urban densification in California, Germany, and Singapore accelerates demand for indoor-rated designs that co-locate with switchgear. The Plainfield substation in California added two 5 MVAr metal-enclosed banks in March 2026 to meet wildfire regulations, illustrating how the capital premium is offset by avoided containment berms. Suppliers differentiate through stainless-steel housings, arc-fault venting, and integrated relay panels. Although type choice often aligns with voltage, hybrid yards that mix open-air reactors with enclosed capacitor steps are emerging as a cost-optimized middle ground.


By Voltage Class: Medium-Voltage Anchors Distribution Grids
Medium-voltage banks (10 kV–69 kV) generated 47.9% of revenue in 2025 and are forecast to expand at 4.8% CAGR, reflecting their role in feeder voltage regulation and wind-farm collector systems. Low-voltage units (< 10 kV) dominate building-level corrections in data centers and hospitals, where facility managers rather than utility engineers drive purchase decisions. High-voltage banks (> 69 kV) grow slowly as STATCOMs and series capacitors gain favor in transmission corridors, yet they persist in remote substations lacking the maintenance bandwidth for power electronics.
The capacitor bank market size for medium-voltage equipment is projected to rise steadily because each new DER-rich feeder requires multi-step banks to stabilize voltage. Conversely, high-voltage banks defend pockets where STATCOM economics falter, such as sparsely populated deserts or mountain passes. Vendors offering seismic-rated designs and cybersecurity-hardened controllers capture share as utilities layer new specifications onto legacy IEC 60871 compliance.
By Application: Renewable Integration Outpaces Legacy Uses
Power-factor-correction held 39.5% of 2025 revenue, yet renewable integration is the fastest-growing application at 6.6% CAGR as grid codes mandate reactive capability for solar and wind plants. Harmonic-filter banks grow in tandem with variable-frequency-drive adoption in manufacturing and HVAC. Voltage-regulation overlaps both categories because every shunt capacitor inherently boosts voltage by reducing line current.
Capacitor banks now compete with STATCOMs in renewable parks above 200 MW, but cost-sensitive developers continue to select switched banks where transient performance is not mandatory. The capacitor bank market size for renewable-integration solutions is set to widen as countries accelerate decarbonization. Detuned-reactor filters rated at 5.67% or 7% shield capacitors from fifth and seventh harmonics, extending service life and reducing overcurrent tripping incidents in industrial drives.
By End-User: Industrial Segment Trails Utility Demand
Utilities represented 49.8% of 2025 revenue because they own most distribution and transmission infrastructure, yet industrial buyers expand faster, driven by the electrification of furnaces and tightening tariff structures. Commercial facilities buy smaller, packaged banks that fit mechanical rooms, while residential demand remains negligible outside demonstration pilots.
Industrial procurement emphasizes turnkey skids that bundle capacitors, detuned reactors, and automatic controllers under a single contract, shortening commissioning time. Utilities, conversely, issue IEC-based tenders that reward proven field reliability and long component lifecycles. This divergence is fragmenting sales channels: OEMs partner with electrical distributors for industrial projects but pursue direct-to-utility contracts for grid installations.
Geography Analysis
Asia-Pacific generated 45.2% of 2025 revenue and will sustain a 5.2% CAGR through 2031 as China extends its ultra-high-voltage network and India builds renewable corridors. China’s Jiayuguan NingSheng hybrid storage project, commissioned in December 2025, illustrates the hybridization trend in which capacitor banks manage steady-state vars while supercapacitors address transients. India’s Power Grid contract with Hitachi Energy for 30 units of 765 kV transformers underscores continued grid expansion that necessitates substantial shunt capacitance.
North America grows more slowly because the installed base is mature, and regulated utilities follow lengthy approval cycles. MISO’s USD 12.3 billion 2025 expansion plan still contains dozens of medium-voltage banks, and PG&E’s Plainfield project adds 10 MVAr of enclosed capacity to meet wildfire-hardening rules. Data-center buildouts in Texas and Virginia create demand for low-voltage automatic banks, but STATCOM substitution limits upside in transmission corridors.
Europe favors dynamic compensators for offshore wind integration, yet urban utilities in Germany and the Nordics still procure medium-voltage banks for space-constrained substations. Ofgem’s doubled network charges push U.K. industrial customers to install on-site banks and avoid penalties. L&T’s involvement in North Sea HVDC hubs signals future orders for converter-station shunt capacitors.
South America and the Middle East remain niche, driven by renewable auctions in Brazil and storage tenders in Saudi Arabia. Tariff-constrained utilities defer replacements, so vendors focus on industrial electrification projects and battery-storage partnerships that bundle var support into EPC packages.

Competitive Landscape
Market concentration is moderate: ABB, Siemens Energy, Schneider Electric, Eaton, and Hitachi Energy control a significant share of global revenue, but none exceeds a 20% individual share. The capacitor bank market rewards IEC 60871 and IEEE 18 compliance, country-specific type testing, and fast customization for project-specific var ratings. Eaton’s August 2025 acquisition of Resilient Power Systems adds solid-state transformer technology, enabling hybrid enclosures that compress capacitor and electronic stages in a single cabinet. ABB’s 2024 purchase of Gamesa Electric’s power-electronics unit for USD 185 million lets the company bundle STATCOMs with traditional banks, offering turnkey FACTS packages to utilities unwilling to re-engineer protection schemes.
Siemens Energy’s collaboration with TenneT on supercapacitor-based STATCOMs protects its share in German transmission projects, while Schneider Electric gains traction with SF6-free ring-main units that integrate capacitor controllers for Indian utilities. Regional specialists such as Arteche and Nissin Electric focus on fast-delivery medium-voltage orders where local after-sales service trumps global brand presence. Cybersecurity, seismic certification, and dry-type fire safety are emerging tender differentiators, raising entry barriers for low-cost assemblers.
Capacitor Bank Industry Leaders
Siemens Energy AG
ABB Ltd
Schneider Electric SE
Eaton Corporation plc
General Electric Co.
- *Disclaimer: Major Players sorted in no particular order

Recent Industry Developments
- March 2026: Pacific Gas & Electric received a Notice of Determination for its Plainfield substation project, which includes two 5 MVAr metal-enclosed capacitor banks to meet wildfire regulations.
- January 2026: China’s Jiayuguan NingSheng 500 MW/1 GWh hybrid storage project reached commercial operation, pairing 25 MW of supercapacitors with shunt banks
- December 2025: Siemens Energy commissioned a supercapacitor-based STATCOM at TenneT’s Mehrum substation, the first of 30 planned units.
- April 2025: PG&E secured approval for Plainfield substation, specifying two 5 MVAr banks.


Global Capacitor Bank Market Report Scope
A capacitor bank consists of multiple identical capacitors connected in series or parallel to store electrical energy and provide reactive power compensation. It is primarily used in industrial, utility, and high-voltage power systems to manage inductive loads, improve power factor, enhance voltage stability, reduce electricity costs, and optimize power efficiency.
The Capacitor Bank Market is segmented into type, voltage class, application, end-user, and geography. By type, the market is segmented into open-air substations, metal-enclosed substations, pole-mounted systems, and other types. By voltage class, the market is segmented into low-voltage below 10 kV, medium-voltage 10 to 69 kV, and high-voltage above 69 kV. By application, the market is segmented into power factor correction, harmonic filter, voltage regulation, renewable integration, industrial applications, data centers, and other applications. By end-user, the market is segmented into utilities, commercial, industrial, and residential sectors. The report also covers the market size and forecasts for the capacitor bank market across major regions, including North America, Europe, Asia-Pacific, South America, and the Middle East and Africa. For each segment, the market sizing and forecasts have been done on the basis of value (USD).
| Open air substation |
| Metal enclosed substation |
| Pole mounted |
| Others |
| Low-Voltage (Below 10 kV) |
| Medium-Voltage (10 to 69 kV) |
| High-Voltage (Above 69 kV) |
| Power factor correction |
| Harmonic filter |
| Voltage regulation |
| Renewable integration |
| Industrial application |
| Data centers |
| Others |
| Utilities |
| Commercial |
| Industrial |
| Residential |
| North America | United States |
| Canada | |
| Mexico | |
| Europe | Germany |
| United Kingdom | |
| France | |
| Italy | |
| NORDIC Countries | |
| Russia | |
| Rest of Europe | |
| Asia-Pacific | China |
| India | |
| Japan | |
| South Korea | |
| ASEAN Countries | |
| Rest of Asia-Pacific | |
| South America | Brazil |
| Argentina | |
| Rest of South America | |
| Middle East and Africa | Saudi Arabia |
| United Arab Emirates | |
| South Africa | |
| Egypt | |
| Rest of Middle East and Africa |
| By Type | Open air substation | |
| Metal enclosed substation | ||
| Pole mounted | ||
| Others | ||
| By Voltage Class | Low-Voltage (Below 10 kV) | |
| Medium-Voltage (10 to 69 kV) | ||
| High-Voltage (Above 69 kV) | ||
| By Application | Power factor correction | |
| Harmonic filter | ||
| Voltage regulation | ||
| Renewable integration | ||
| Industrial application | ||
| Data centers | ||
| Others | ||
| By End-User | Utilities | |
| Commercial | ||
| Industrial | ||
| Residential | ||
| Geography | North America | United States |
| Canada | ||
| Mexico | ||
| Europe | Germany | |
| United Kingdom | ||
| France | ||
| Italy | ||
| NORDIC Countries | ||
| Russia | ||
| Rest of Europe | ||
| Asia-Pacific | China | |
| India | ||
| Japan | ||
| South Korea | ||
| ASEAN Countries | ||
| Rest of Asia-Pacific | ||
| South America | Brazil | |
| Argentina | ||
| Rest of South America | ||
| Middle East and Africa | Saudi Arabia | |
| United Arab Emirates | ||
| South Africa | ||
| Egypt | ||
| Rest of Middle East and Africa | ||


Key Questions Answered in the Report
How large will global demand for capacitor banks be by 2031?
The capacitor bank market size is forecast to reach USD 6.55 billion by 2031, up from USD 5.26 billion in 2026.
Which voltage class dominates new capacitor-bank installations?
Medium-voltage units (10 kV-69 kV) led with 47.9% market share in 2025 because they serve most distribution substations and wind-farm collector systems.
Why are metal-enclosed capacitor banks gaining popularity?
Fire-safety regulations and limited urban land push utilities toward compact, indoor-rated metal-enclosed designs that are growing at a 5.7% CAGR.
What is driving capacitor-bank adoption in renewable plants?
Grid codes require solar and wind facilities to provide reactive support; capacitor banks meet these rules at up to 40% lower capital cost than STATCOMs in remote locations.
How are utilities addressing maintenance costs for capacitor banks?
AI-enabled predictive switching reduces switching events by 35%, extending contact life and lowering maintenance spending by about 20% over ten years.
Which regions will deliver the fastest growth?
Asia-Pacific is projected to expand at a 5.2% CAGR to 2031, buoyed by China's ultra-high-voltage projects and Indias transmission corridors.
Page last updated on:


