
Market Overview
| Study Period | 2021 - 2031 |
|---|---|
| Forecast Data Period | 2026 - 2031 |
| Historical Data Period | 2021 - 2024 |
| Growth Rate | 5.02 % |
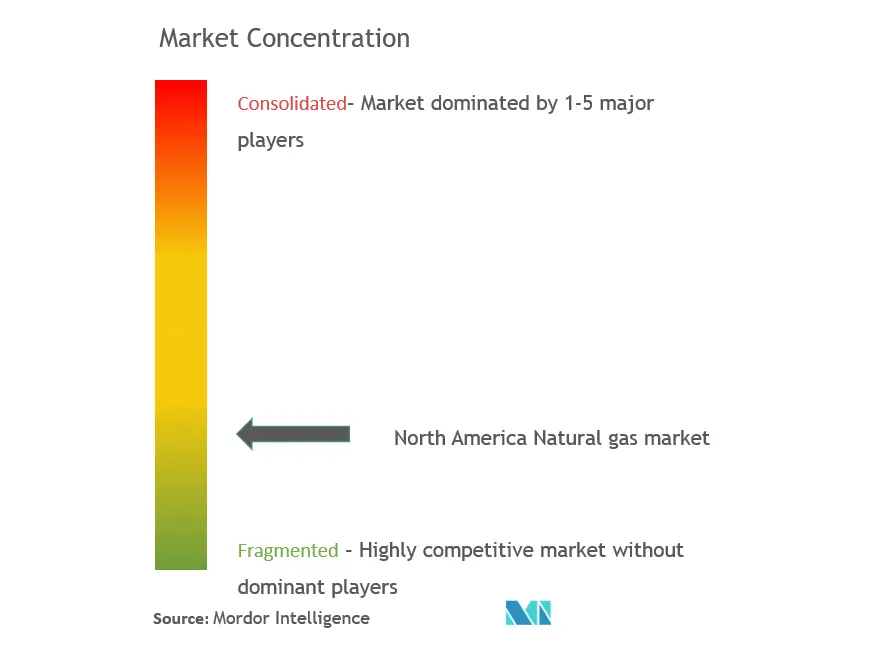
| Market Concentration | Medium |
Major Players *Disclaimer: Major Players sorted in no particular order Image © Mordor Intelligence. Reuse requires attribution under CC BY 4.0. | |
North America Natural Gas Market Analysis by Mordor Intelligence
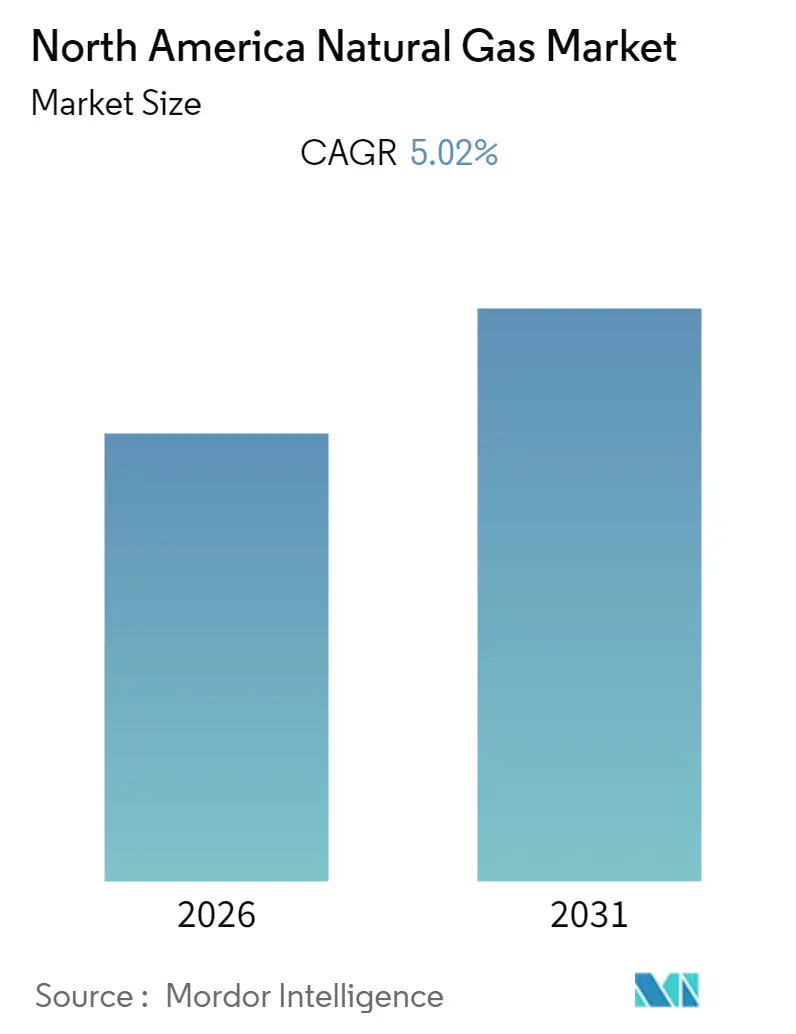
The North America Natural Gas Market size is expected to register a CAGR of 5.02% during the forecast period (2026-2031).
Power generation is the fastest growing segment in the North America Natural gas market. Globally, Natural gas in power generation increased by 2.6% in 2021, although its share decreased from 23.7% in 2020 to 22.9% in 2021.
Moreover, increasing exploration and production of natural gas reserves are mainly driven due to the rise in the industrial demand from the refining, petrochemical, particular chemical, and fertilizer industries are expected to drive the demand for natural gas during the forecast period.
United states is the fastest growing country in the North America Natural gas market during the forecast period.
Note: Market size and forecast figures in this report are generated using Mordor Intelligence’s proprietary estimation framework, updated with the latest available data and insights as of 2026.
Market Trends and Insights
Power generation to Dominate the Market
- Natural gas in power generation increased by 2.6% in 2021, although its share decreased from 23.7% in 2020 to 22.9% in 2021 globally.
- Further, renewable energy continued to grow strongly and is now 13% of total power generation. Clean energy generation increased by almost 17% in 2021, accounting for over half of the increase in global power generation over the past two years.
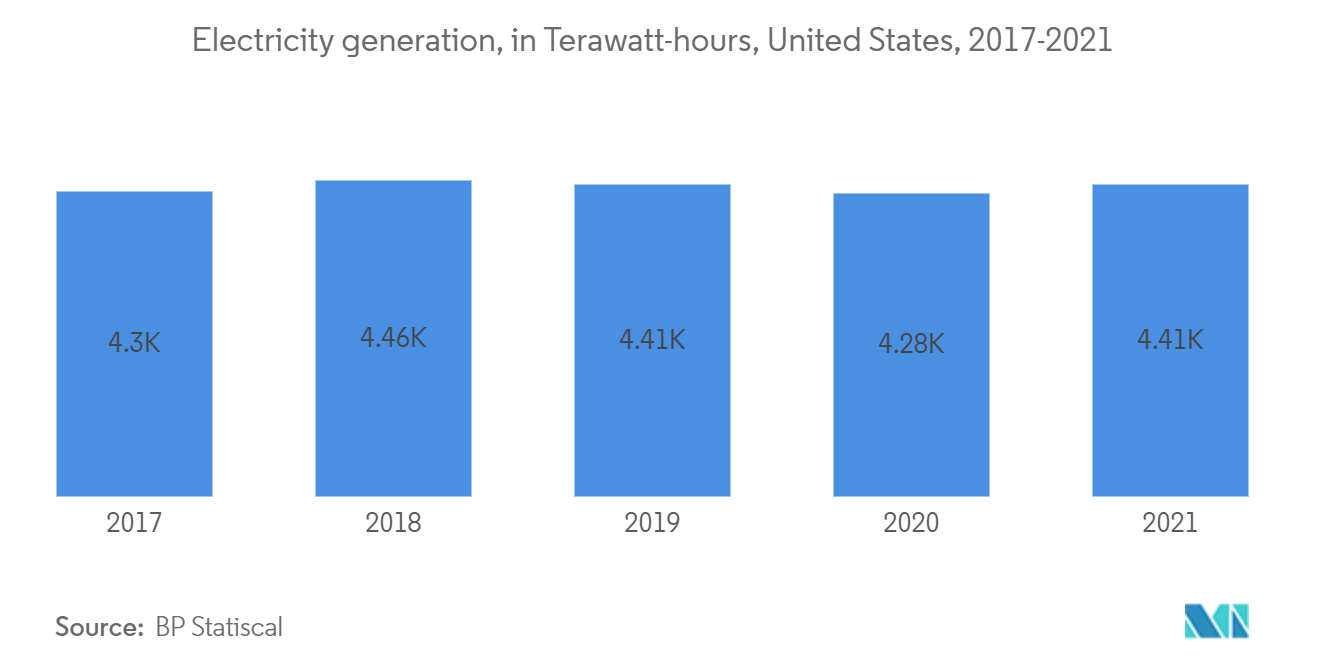
- Moreover, the total electricity generation in North America is 5383.5 terawatt hours in 2021 compared to 5259.7 terra watts in 2020.
- Hence, owing to the above points, the Power generation segment will likely see significant market growth during the forecast period.
United States Expected to see Significant the Market Growth
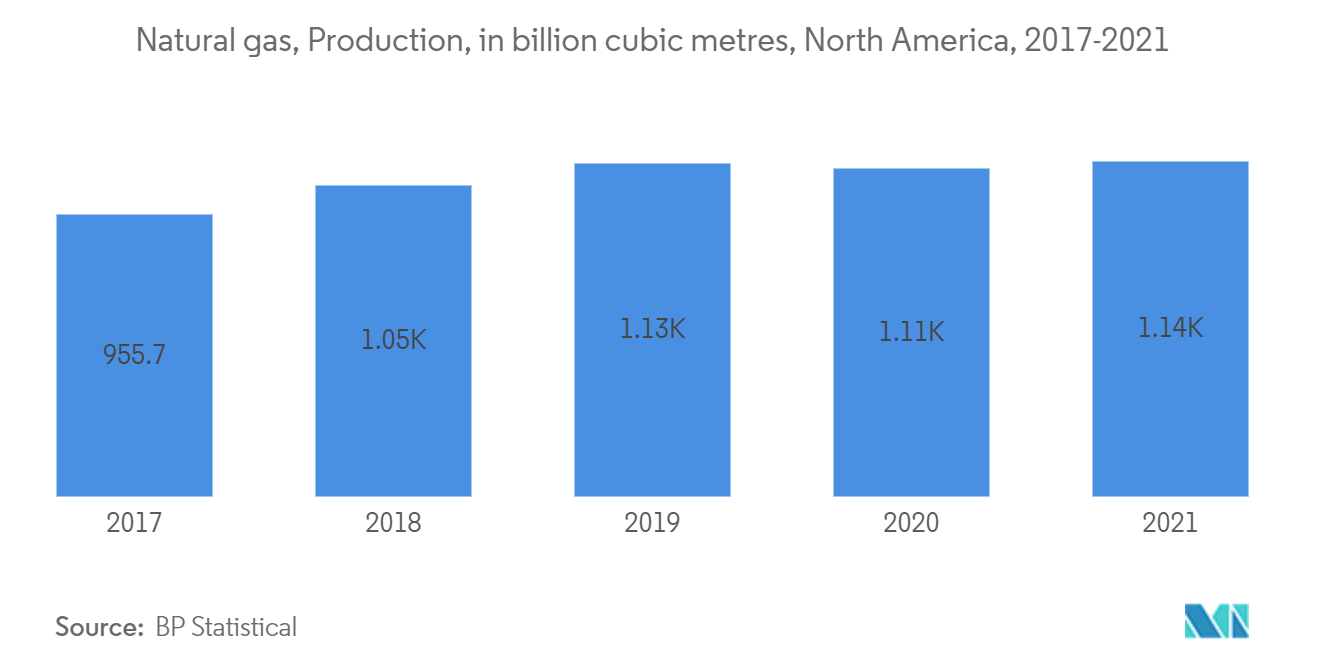
The United States is a major crude oil and natural gas producer in the world, and the country is expected to cover around 60% of the world oil demand in the coming years if the shale oil and gas production follows the same trend as it was witnessed before 2020.
Further, the LNG sector in the United States has historically received significant investments to transform the country into a central exporting hub. As of June 2020, Most of the proposed liquefaction capacity additions are in North America (599.6 MTPA), with 350.5 MTPA located in the United States, 221.8 MTPA in Canada, and 27.4 MTPA in Mexico. The only LNG export project in North America and globally to reach FID in 2020 was the Costa Azul export plant in Mexico, developed by Sempra Energy. During the forecast period, around six LNG liquefaction terminals are expected to reach the FID stage, leading to a positive market outlook in the United States.
As of 2021, approximately all offshore oil and natural gas leasing and development activity occurred in the central and western Gulf of Mexico. Thousands of platforms operate in waters up to 6,000 feet deep. A few platforms operate in depths of 10,000 feet or more.
5 of the 34 natural gas producing states accounted for about 69% of total U.S. dry natural gas production in 2020, and private players are investing in other regions to increase gas production.
Hence, owing to the above points, the United States is expected to see significant market growth in the Natural gas market during the forecast period.
Regulatory Landscape
In the United States, the Federal Energy Regulatory Commission (FERC) remains the key federal body shaping interstate natural gas pipeline operations and gas infrastructure permitting under the Natural Gas Act. In May 2026, FERC advanced permitting and process changes through a proposed update to its blanket certificate program (Docket No. RM25-12-001) that raises automatic authorization cost limits and prior-notice thresholds. It also issued a final rule on May 28, 2026 (91 FR 31651) that updates business practice standards for interstate pipelines, effective July 27, 2026, with compliance by January 1, 2027.
In Canada, Natural Resources Canada (NRCan) and related federal frameworks influence upstream and energy efficiency requirements relevant to gas production, processing, and end-use equipment. NRCan initiated public comment on June 20, 2026 for Energy Efficiency Regulations (Amendment 19), and its 2026-2028 forward regulatory planning flagged additional regulatory activity, including workstreams tied to offshore oil and gas regulatory modernization (FORRI Phase 4) starting in 2026-2027. Cross-border trade and system integration between the United States and Canada continue to be a policy anchor for North American gas flows and reliability discussions, particularly around infrastructure coordination.
Value Chain Analysis
The North America natural gas value chain spans upstream resource development (including unconventional shales), field gathering and processing, long-haul transmission, storage, and downstream consumption across power generation, industrial fuel, households, and LNG export. Integrated producers and marketers link upstream basins to demand centers and export outlets, with LNG liquefaction and international trading increasingly functioning as a downstream extension of domestic production portfolios.
Midstream pipelines and related commercial practices are central to moving gas from producing regions to power markets and LNG terminals. FERC oversight covers interstate pipelines and approvals for certain gas facilities under the Natural Gas Act framework. The value chain is also being shaped by large-load electricity growth, including data center-driven demand, which tightens the coupling between gas supply, pipeline capacity, and electric reliability planning. This elevates the role of permitting processes and standardized operational practices across transmission networks.
Competitive Landscape
The Natural gas market is moderately consolidated. Some of the key players in this market are Eni SpA, BP PLC, Total Energies SE, Royal Dutch Shell PLC, and Exxon Mobil Corporation.
North America Natural Gas Industry Leaders
-
Eni SpA
-
BP PLC
-
Total Energies SE
-
Royal Dutch Shell PLC
-
Exxon Mobil Corporation.
- *Disclaimer: Major Players sorted in no particular order
North America Natural Gas Market Companies Covered in this Report
- Royal Dutch Shell
- Exxon Mobil Corporation
- BP PLC
- Equinor ASA
- Marathon Petroleum Corp
- Chevron Corp
- ENI SPA
- Total SA
Market Opportunities and Future Outlook
North America continues to show practical room for growth around integrated gas-to-LNG pathways, where unconventional supply is connected through liquefaction, shipping, and global trading. Activity that supports this theme includes TotalEnergies moves to deepen US gas value chain integration through acquisitions in the Anadarko Basin, and BP focus on natural gas development across Lower 48 positions such as Haynesville and the Permian. Both approaches align upstream development with downstream outlets that include LNG and domestic power demand.
Infrastructure and policy mechanics also create room for incremental transport and commercialization solutions, especially where permitting and operational standardization reduce friction when networks expand or get upgraded. FERC actions in 2026 to streamline elements of pipeline permitting and to update interstate pipeline business practice standards provide near-term levers for project execution, along with more standardized scheduling and transactional processes. On the demand side, increasing electricity load additions, including hyperscale data center development noted by industry and policy observers, connect directly to gas-fired generation and raise the need for dependable gas deliverability into key power regions.
Recent Industry Developments in North America Natural Gas Market
- May 2026: Cheniere Energy Partners entered into a lump sum EPC contract with Bechtel Energy for the Sabine Pass LNG Expansion Project (Train 7; ~6 mtpa peak). The development expands LNG export capacity. It reinforces the Gulf Coast as a key export hub by accelerating the project timeline and signaling capital commitment.
- May 2026: Bechtel Energy (as contractor) / Sabine Pass expansion Bechtel Energy has been greenlit for Sabine Pass liquefaction expansion in Southwest Louisiana. The project advances LNG liquefaction capacity expansion. This strengthens critical LNG export infrastructure along the U.S. Gulf Coast.
- May 2026: Natural Gas Pipeline Company of America LLC issued a non-binding SOI for the Texas Louisiana Expansion project (80,000 Dth/day; in-service targeted for July 1, 2026). The pipeline capacity addition supports higher northbound gas flow to LNG and domestic markets. It aligns with LNG export growth by easing supply constraints along the corridor.
North America Natural Gas Market Report Scope and Research Methodology
Market Definition and Coverage
This market is sized as the value of natural gas supplied in North America, covering volumes delivered for end use and their realized pricing across the region, and then consolidated into a single USD value for the base year and forecast years.
The scope excludes crude oil, refined products, and electricity revenues. It also excludes midstream service-only revenues when they are not part of the natural gas sales value.
Segments Covered in This Report
- Source
- Conventional Gas
- Unconventional gas
- Application
- Automotive
- Power generation
- Household
- Industrial Fuel
- Countries
- Canada
- USA
- Mexico
Data Sources, Market Sizing, and Validation
Desk Research
Desk work starts by mapping supply, demand, and trade so the model is anchored to observable gas flows before any pricing assumptions are applied. We rely on public energy statistics and regulatory disclosures that track production, consumption, imports, exports, storage, and major infrastructure movements in a consistent way.
Common source types include datasets and releases from the U.S. Energy Information Administration (EIA), Statistics Canada, Mexico energy statistics and regulator disclosures where available, and trade series such as UN Comtrade for cross-border movements. We also use International Energy Agency (IEA) context to frame demand drivers.
We review company filings, investor presentations, and pipeline and LNG terminal websites for capacity additions, outages, and contract announcements. Reputable press is used to cross-check timelines and reconcile unit pricing assumptions where needed. Paid subscriptions that cover company financials and intelligence, shipment-level import and export records, and related news and financials are used as additional cross-checks. The sources named above are illustrative, and other public documents were also used to collect, validate, and clarify data points.
Primary Interviews and Surveys
Primary work is used to stress-test the desk model, particularly where pricing, utilization, and demand allocation can differ across sub-regions and seasons. We interview and survey a mix of producers, midstream operators, utilities, and large industrial users, plus subject experts, across the United States, Canada, and Mexico. This input helps reflect how gas is contracted, delivered, and priced in practice.
Distribution of primary research fieldwork respondents
| Company type | Respondent position |
|---|---|
| Top tier: 26% | CXOs: 17% |
| Mid tier: 53% | Functional/Unit leaders: 39% |
| Smaller Players: 21% | Managers: 44% |
Market-Sizing & Forecasting
The core sizing uses a top-down build where production, trade, and storage balance data are reconstructed into a regional supply available for consumption, then allocated by end use using reported consumption series and sector indicators. To keep outputs realistic, totals are checked with selective bottom-up approximations, including sampled delivered price (ASP) by hub-linked formulas multiplied by sector volumes, plus direction checks using supplier and utility revenue patterns.
Inputs that matter in this market include marketed production and dry gas production trends, LNG export and pipeline export volumes, underground storage injections and withdrawals, hub and citygate price benchmarks, power generation gas burn, and industrial demand signals tied to petrochemicals and manufacturing activity. Where a data series is missing for a country or a short period, gaps are bridged using closely related public proxies, such as nearby pipeline flow series, storage behavior, or sector consumption ratios, and then confirmed again through interviews.
Forecasting is handled through scenario analysis supported by regression checks that link consumption and pricing to weather-normalized demand, macro output, and export capacity utilization. The base case stays consistent with policy and infrastructure that are already commissioned or clearly under construction. The final forecast is adjusted when primary feedback indicates a different pace for capacity ramp-ups or changes in demand elasticity.
Data Validation & Update Cycle
Validation is done in layers so one weak data point does not drive the final number. We check internal consistency first, such as whether implied supply equals demand plus net storage changes, and whether pricing assumptions align with observed hub-to-citygate spreads.
Next, results are compared with independent signals, including publicly reported consumption by sector, trade volumes at key border points, and announced LNG commissioning schedules. If a variance is large, the model is re-opened, assumptions are traced back to their source, and expert contacts are used again for clarification. Reports are refreshed annually, with interim updates when material events occur, and a final pre-delivery review is completed so clients receive the latest updated view.
Mordor Intelligence's North America Natural Gas Market Size Versus Other Published Estimates
Published values for this market often differ because natural gas can be counted as a commodity value (volume times price) or as a wider industry value that includes adjacent services and infrastructure revenues. Variation also comes from country groupings, how trade is treated, and whether an estimate is anchored to delivered consumption or upstream production.
Pipeline transportation fees and LNG liquefaction service revenues fall outside Mordor Intelligence's scope here, so sizing stays tied to natural gas sales value across the United States, Canada, and Mexico using production and trade balances plus hub and citygate pricing checks. Differences also show up when a source uses a single blended price for the region, assumes an aggressive export ramp without validating terminal utilization, or applies a different currency timing for converting local series into USD.
Benchmark comparison
| Source | Market Size | Gaps in Research Methodology |
|---|---|---|
| Mordor Intelligence | USD 0.00 B (2024) | |
| Regional Consultancy A | USD 435.26 B (2024) | Often treated as a broad industry value with blended pricing and may include parts of midstream and LNG service economics, which can inflate the commodity-only sales value. |
| Trade Journal B | USD 155.00 B (2024) | Commonly narrowed to the United States only and may rely on a simplified price and consumption assumption without fully reconciling cross-border trade and storage balancing. |
The spread mainly comes from whether the number represents gas commodity sales across North America or a narrower country-only view that also uses simplified pricing. When volumes and prices are cross-checked against trade and storage behavior, the final total remains traceable to repeatable inputs and is simpler to re-run as new capacity comes online.
Key Questions Answered in the Report
What is the current North America Natural Gas Market size?
The North America Natural Gas Market is projected to register a CAGR of 5.02% during the forecast period (2026-2031)
Who are the key players in North America Natural Gas Market?
Eni SpA, BP PLC, Total Energies SE, Royal Dutch Shell PLC and Exxon Mobil Corporation. are the major companies operating in the North America Natural Gas Market.
What years does this North America Natural Gas Market cover?
The report covers the North America Natural Gas Market historical market size for years: 2020, 2021, 2022, 2023 and 2024. The report also forecasts the North America Natural Gas Market size for years: 2026, 2027, 2028, 2029, 2030 and 2031.