Carbon Accounting Market Size and Share
Market Overview
| Study Period | 2021 - 2031 |
|---|---|
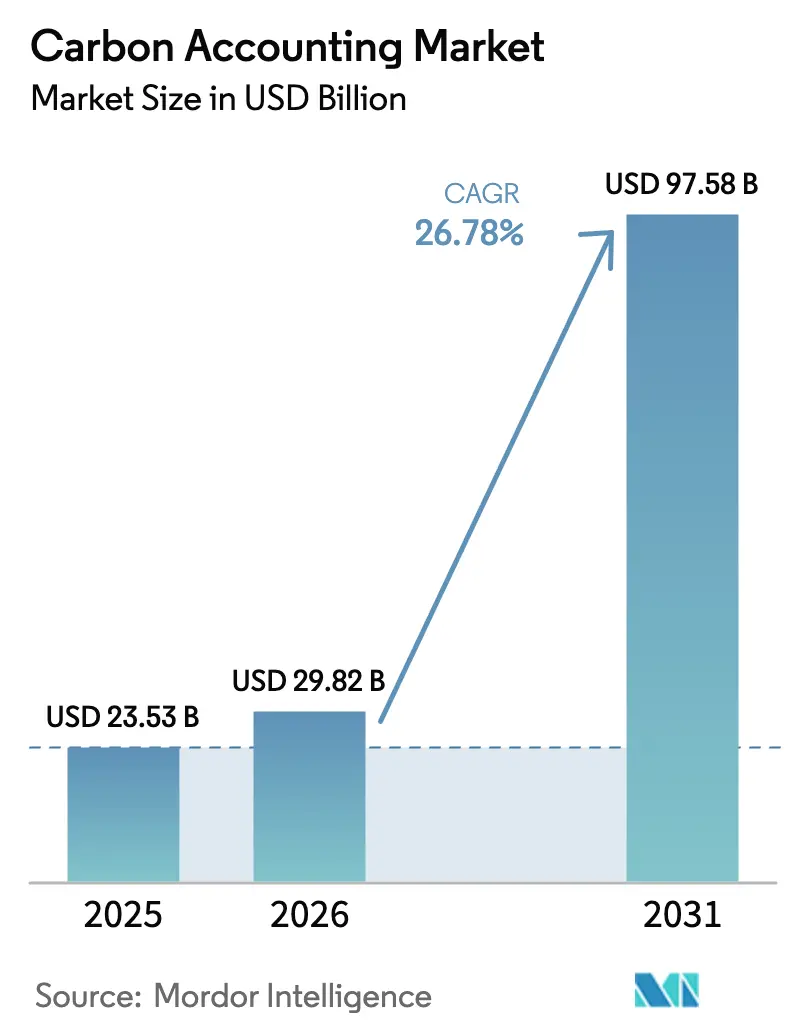
| Market Size (2026) | USD 29.82 Billion |
| Market Size (2031) | USD 97.58 Billion |
| Growth Rate (2026 - 2031) | 26.78% CAGR |
| Fastest Growing Market | Asia Pacific |
| Largest Market | North America |
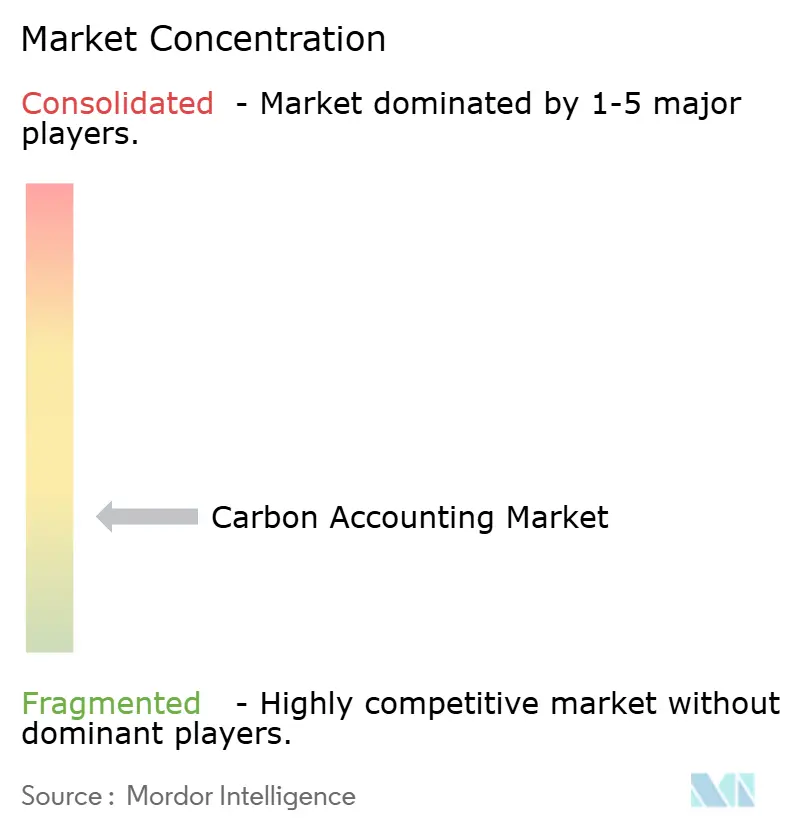
| Market Concentration | Low |
Major Players
*Disclaimer: Major Players sorted in no particular order Image © Mordor Intelligence. Reuse requires attribution under CC BY 4.0. |
|
Carbon Accounting Market Analysis by Mordor Intelligence
The Carbon Accounting market size is expected to grow from USD 23.53 billion in 2025 to USD 29.82 billion in 2026 and is forecast to reach USD 97.58 billion by 2031 at 26.78% CAGR over 2026-2031.
Strong momentum stems from mandatory climate-disclosure rules, sustainable-finance covenants that link borrowing costs to emissions performance, and the rapid adoption of cloud computing, which embeds granular data collection within enterprise resource planning (ERP) and product lifecycle management (PLM) systems. Converging frameworks, such as the EU Corporate Sustainability Reporting Directive (CSRD), the United States Securities and Exchange Commission (SEC) climate rule, and the IFRS Sustainability Standards, are prompting organizations to consolidate their separate reporting workflows into a single platform. Blockchain-enabled tokenization of carbon credits is addressing longstanding transparency concerns, while artificial intelligence engines automate data capture across Scope 1-3 categories, reducing manual effort and audit risk. As a result, more chief financial officers now treat emissions liabilities as a balance-sheet item that directly affects the carbon accounting market’s access to capital.
Key Report Takeaways
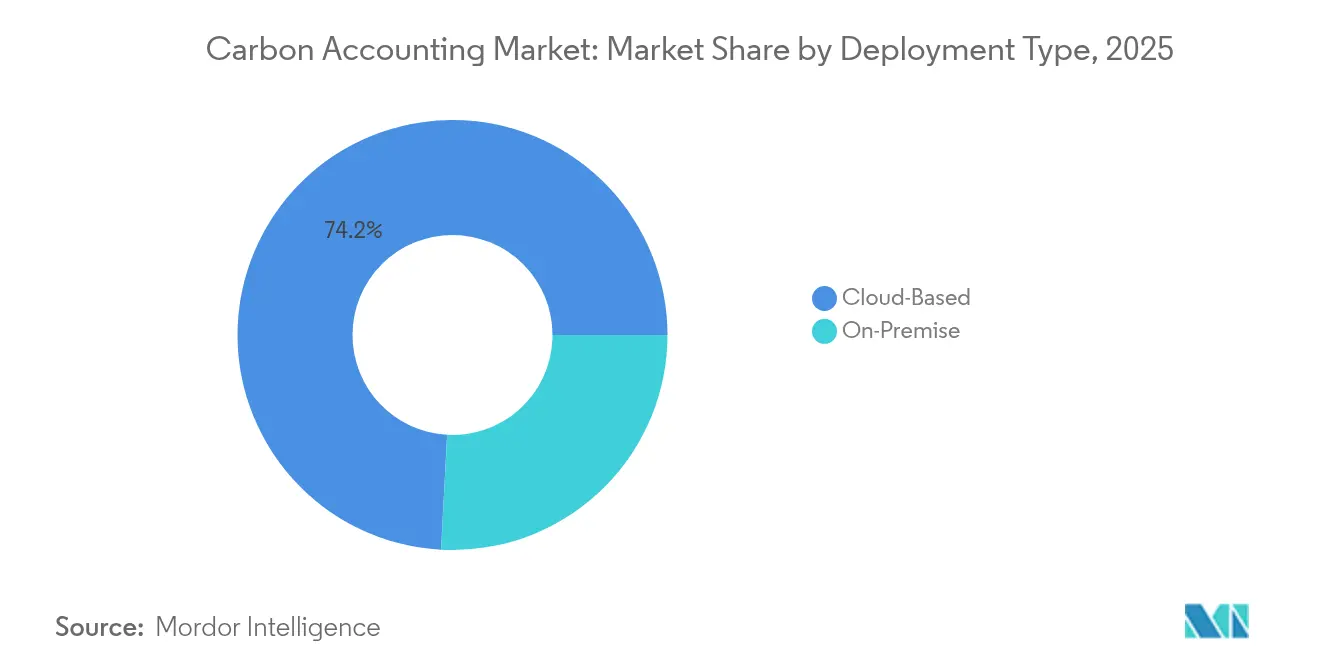
- By deployment type, cloud solutions captured 74.15% revenue in 2025 and are projected to grow at a 28.03% CAGR through 2031.
- By component, software held 71.70% of 2025 revenue, whereas services are poised for the fastest 31.1% CAGR to 2031.
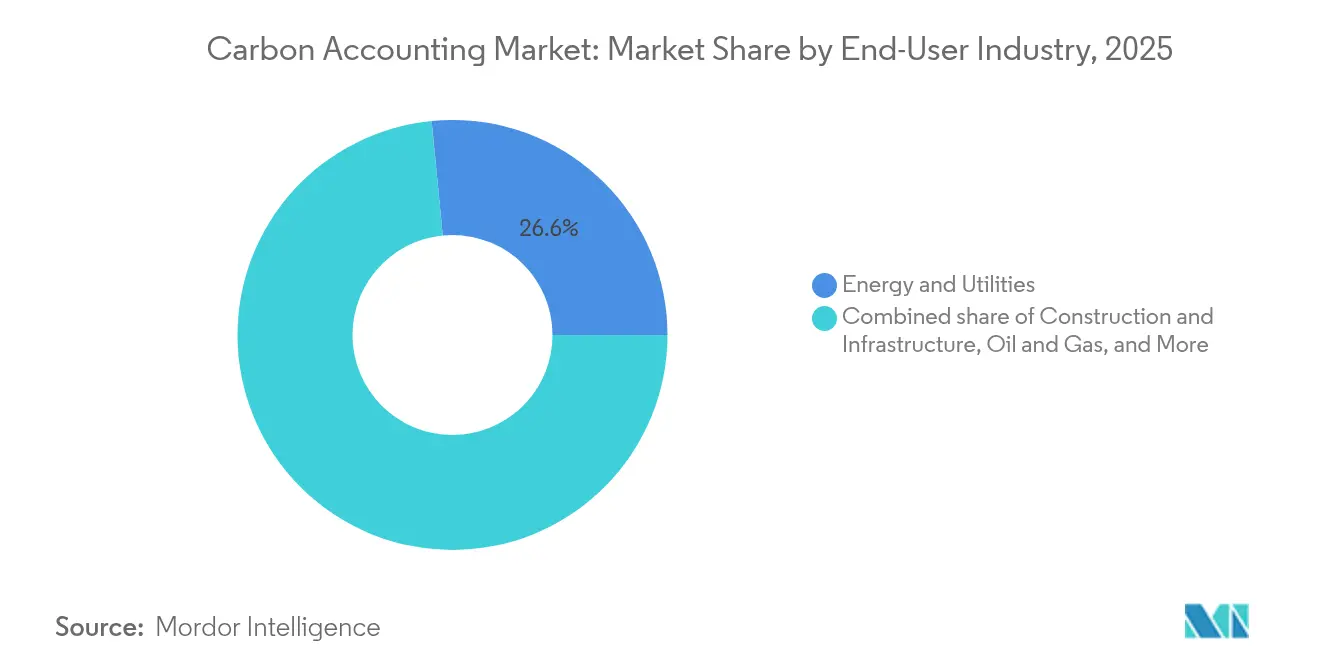
- By end-user industry, energy and utilities led with 26.55% revenue share in 2025; construction and infrastructure is forecast to expand at a 30.4% CAGR to 2031.
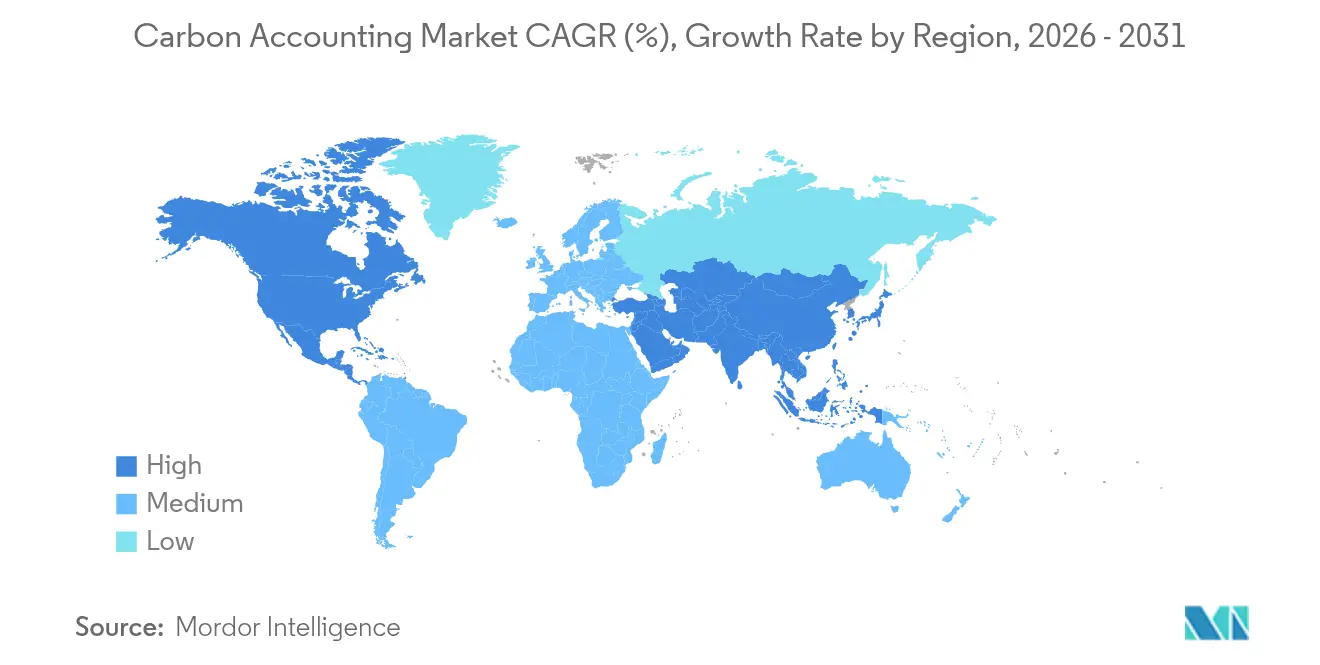
- By geography, North America accounted for 36.05% of 2025 revenue, while the Asia-Pacific region is advancing at the highest 29.6% CAGR through 2031.
Note: Market size and forecast figures in this report are generated using Mordor Intelligence’s proprietary estimation framework, updated with the latest available data and insights as of 2026.
Global Carbon Accounting Market Trends and Insights
Drivers Impact Analysis*
| Driver | (~) % Impact on CAGR Forecast | Geographic Relevance | Impact Timeline |
|---|---|---|---|
| Corporate sustainability-linked finance boom | 6.20% | Global, with early adoption in North America & EU | Medium term (2-4 years) |
| Expanding global disclosure mandates (CSRD, SEC, IFRS-S) | 8.10% | EU core, expanding to North America & Asia-Pacific | Short term (≤ 2 years) |
| Enterprise-wide Scope 3 data tools embedded in ERP & PLM stacks | 4.70% | Global, led by North America enterprise adoption | Medium term (2-4 years) |
| Rapid cloud-first SaaS deployments in carbon software | 3.90% | Global, accelerated in Asia-Pacific emerging markets | Short term (≤ 2 years) |
| Tokenization of carbon credits enabling auditable, real-time ledgers | 2.80% | Global, with pilot implementations in developed markets | Long term (≥ 4 years) |
| EU Digital Product Passport forcing SKU-level carbon traceability | 1.60% | EU mandatory, voluntary adoption in North America | Medium term (2-4 years) |
| Source: Mordor Intelligence | |||
Corporate Sustainability-Linked Finance Boom
Sustainability-linked loans and bonds now exceed USD 500 billion in outstanding volume, and borrowers must track emissions performance milestones to preserve coupon step-down incentives. Banks, therefore, embed rigorous carbon metrics into credit covenants, prompting treasury teams to integrate real-time dashboards rather than relying on year-end spreadsheets. The shift reframes emissions as a cost of capital, elevating the carbon accounting market from a compliance tool to a finance-critical system. Platforms capable of feeding auditable data straight into treasury risk engines gain preference. Financial institutions also utilize blockchain registries to verify the provenance of carbon credits, thereby creating additional demand for secure ledger integrations.
Expanding Global Disclosure Mandates Drive Market Acceleration
The CSRD obliges more than 50,000 firms, including 10,000 non-EU multinationals, to publish third-party-assured Scope 1-3 inventories. Parallel SEC and IFRS rules cement a tri-regional compliance perimeter that few listed entities can ignore.[1]Arbor, "What is the EU CSRD? The Ultimate Guide 2025 for Carbon Accounting," arbor.eco Unlike earlier voluntary frameworks, these mandates introduce fines, civil liability, and in France, even criminal sanctions for misstatements. Enterprises consequently replace fragmented spreadsheets with unified platforms able to render identical data sets across multiple jurisdictions. Vendor selection favors solutions offering pre-configured templates for CSRD, SEC, and IFRS, rather than separate modules.
Enterprise-Wide Scope 3 Data Integration Transforms Supply Chain Visibility
Embedding emissions calculators into ERP transaction lines enables real-time supplier footprints at the purchase order level, providing a comprehensive view of environmental impact. SAP Green Ledger and Microsoft Cloud for Sustainability demonstrate how carbon costs are now integrated alongside financial costs in management reports.[2]SAP, "Carbon Accounting Software| Manage Carbon Emissions," sap.com This visibility addresses the 70-90% of total emissions that are often hidden in upstream tiers. Automated supplier portals collect activity data and apply sector-specific emission factors to derive primary values, thereby reducing reliance on generic proxies. As value-chain transparency improves, procurement teams can incorporate carbon pricing into sourcing decisions, thereby sharpening decarbonization incentives for vendors.
Rapid Cloud-First SaaS Deployments Enable Scalable Implementation
A cloud tenancy avoids the capital expense of on-premise servers and permits instant geographic deployment, which is vital as multi-site companies expand reporting boundaries. Subscription pricing aligns with cost and usage, making proof-of-concept pilots low-risk. Providers bundle API connectors for IoT meters, utility feeds, and logistics data, allowing clients to ingest high-frequency datasets without requiring bespoke coding. Artificial-intelligence plug-ins scan incoming data for outliers, flagging anomalies before audit windows open. These ease-of-use gains underpin the carbon accounting market’s 28.9% CAGR within SaaS channels.[3]Persefoni, "Persefoni Pricing: Free Carbon Accounting & Advanced Climate Solutions," persefoni.com
Restraints Impact Analysis*
| Restraint | (~) % Impact on CAGR Forecast | Geographic Relevance | Impact Timeline |
|---|---|---|---|
| High data-quality & methodology complexity for multi-tier supply chains | -4.30% | Global, particularly acute in Asia-Pacific manufacturing hubs | Short term (≤ 2 years) |
| Up-front software & change-management costs for SMEs | -3.10% | Global, with higher impact in emerging markets | Medium term (2-4 years) |
| Supplier data-privacy & antitrust concerns in Scope 3 sharing | -2.70% | North America & EU regulatory focus | Medium term (2-4 years) |
| Fragmented rules between voluntary & compliance carbon markets | -1.90% | Global, with regional variations in market maturity | Long term (≥ 4 years) |
| Source: Mordor Intelligence | |||
High Data-Quality and Methodology Complexity Constrains Multi-Tier Supply Chain Tracking
Manufacturers sourcing components across five or more echelons struggle to obtain primary emissions values from small vendors that lack metering-grade instrumentation. When suppliers default to industry averages, inventories lose precision and become less audit-ready. Divergent lifecycle-assessment methods further skew comparability, forcing enterprises to maintain multiple calculation engines. These inconsistencies slow the penetration of the carbon accounting market into heavy manufacturing segments because buyers hesitate to assert Scope 3 figures they cannot verify.[4]Food Logistics, "Scope 3 Emissions Remain Hurdle for Many Supply Chain Companies: Study," foodlogistics.com
Up-Front Software and Change-Management Costs Create SME Adoption Barriers
Annual platform subscriptions, implementation consulting, and staff training can exceed USD 200,000 for mid-sized firms, outlays that rival their entire sustainability budget. Many small traders thus remain outside formal disclosure regimes, creating data gaps for upstream customers. Freemium calculators offer a starting point, but interpreting output and crafting reduction roadmaps still require expertise. Until simplified onboarding bundles emerge, SME uptake will lag, potentially capping the growth potential of some vendors.[5]British Business Bank, "Smaller Businesses and the Transition to Net Zero," british-business-bank.co.uk
*Our forecasts treat driver/restraint impacts as directional, not additive. The impact forecasts reflect baseline growth, mix effects, and variable interactions.
Segment Analysis
By Deployment Type: Cloud Dominance Accelerates Enterprise Adoption
Cloud deployments generated 74.15% of 2025 revenue and are expected to grow at a 28.03% CAGR to 2031, while on-premise installations are expected to decline in absolute terms. This momentum reflects multinational demand for zero-footprint rollouts that connect hundreds of facilities without local server builds. A single multi-tenant instance enables headquarters to track global-site emissions nightly, thereby tightening governance across jurisdictions. Meanwhile, data-sovereignty rules in utilities and defense sustain a niche for hybrid clusters, but the carbon accounting market size flowing through public-cloud environments already dwarfs legacy installations, widening the gap each quarter.
The cloud preference also unlocks microservices that ingest telemetry from industrial IoT gateways. AI engines residing within hyperscale latency envelopes perform real-time materiality checks, scoring whether consumption variances warrant investigation. Such functionality would strain on-premise CPU budgets. As a result, several oil-and-gas majors pivoted from proprietary builds to managed SaaS, citing year-one savings in both maintenance cost and audit cycle time. This shift reiterates why cloud remains the de facto foundation for next-generation carbon accounting market workflows.


By Component: Services Growth Outpaces Software as Implementation Complexity Increases
Software licenses accounted for 71.70% of 2025 revenue; however, managed and professional services are growing faster at a 31.1% CAGR, as enterprises lack in-house carbon scientists. Consultants migrate thousands of utility bills, configure emission-factor libraries, and train business users on variance analysis. In parallel, auditors demand third-party verification, so service providers bundle assurance readiness with ongoing data-quality reviews. Consequently, the carbon accounting market size associated with service contracts is expected to almost triple by 2031, thereby closing the knowledge gap that prevents some firms from self-operating on these platforms.
Service growth also mirrors the surge in Scope 3 boundary expansions. Value-chain engagement programs require multilingual outreach, bespoke survey templates, and non-disclosure agreements, all tasks usually outsourced. Vendors that combine software with white-glove onboarding differentiate themselves, reinforcing a solution-plus-service paradigm within the carbon accounting market.
By End-User Industry: Construction Emerges as Fastest-Growing Segment
Energy and utilities still account for 26.55% of 2025 spending, as direct combustion emissions draw regulatory scrutiny. Yet construction and infrastructure will post a 30.4% CAGR to 2031 as green-building certifications enforce embodied-carbon caps. Project owners now insist on tender responses that quantify materials footprints, pushing contractors to embed measurement tools on every project. The carbon accounting market share connected to construction, therefore, expands more quickly than in any other vertical.
Elsewhere, food and beverage brands utilize agricultural life-cycle models to quantify soil-based sequestration potential, while telecom carriers employ carbon analytics to optimize their network's energy intensity. Financial institutions integrate portfolio-wide financed-emissions dashboards, illustrating how the carbon accounting industry now addresses both operational and investment exposures.
Geography Analysis
North America contributed the largest 36.05% of the revenue in 2025, largely due to early voluntary disclosures and sophisticated capital markets that price decarbonization risk. Big-Tech incumbents supply embedded toolkits, and a venture cohort accelerates product innovation. Although the SEC climate rule remains under judicial review, many issuers continue to voluntarily align with pre-existing standards to preempt investor activism. Indigenous carbon registries and renewable-energy certificate programs further foster demand for the platform among corporate power purchase agreement buyers.
Asia-Pacific is the fastest-growing territory, expanding at a 29.6% CAGR through 2031. China’s national emissions-trading system covers more than 4 billion t of CO₂, compelling industrial facilities to monitor plant-level baselines. Singapore, Japan, and Australia have introduced granular disclosure codes that cascade into regional supply chains. Electronics and textile exporters now face buyer audits that assess the carbon intensity of their products, driving the carbon accounting market deeper into supplier tiers. Local software start-ups partner with global vendors to localize factor libraries and language packs, easing adoption hurdles in diverse manufacturing clusters.
Europe’s trajectory aligns almost entirely with the rollout of the CSRD. Forty percent of member states have transposed the directive, with the remainder drafting statutes that hard-wire double materiality and assurance. Companies must therefore integrate emissions posting into their consolidated ledgers, mirroring the rigor of financial statements. The EU Digital Product Passport is expected to reinforce demand for SKU-level traceability across the automotive, consumer appliances, and fashion sectors. As a result, European firms are increasingly seeking platforms that integrate with existing PLM and ERP suites rather than standalone dashboards.

Competitive Landscape
The carbon accounting market balances broad-suite enterprise software vendors against specialist pure plays. SAP, Microsoft, IBM, and Salesforce extend their ERP or CRM footprints with native carbon modules, offering seamless single sign-on and unified master data governance. Conversely, specialists such as Persefoni, Watershed, Normative, Greenly, and CarbonChain prioritize depth, shipping granular emission-factor engines, machine-learning anomaly detection, and rapid supplier onboarding wizards. Enterprise clients weigh integration comfort against analytical sophistication, often choosing dual-track strategies in which a specialist feeds detailed emissions into the broader suite for disclosure consolidation.
Mergers and acquisitions further consolidate the market. Workiva acquired and integrated 'Sustain.Life' into its reporting cloud, Normative bought Eivee for procurement intelligence, and Watershed partnered with KPMG to scale audit-ready templates. Funding flows remain strong: Greenly raised USD 52 million, and Persefoni secured USD 23 million to further develop its AI features. Competitive advantage increasingly pivots on automated Scope 3 ingestion, blockchain credit traceability, and predictive decarbonization scenario modeling. Vendors that bundle these differentiators with low-code configuration stand to capture outsized portions of the carbon accounting market.
Carbon Accounting Industry Leaders
-
Microsoft (Cloud for Sustainability)
-
SAP
-
IBM Envizi
-
Persefoni
-
Sphera
- *Disclaimer: Major Players sorted in no particular order

Recent Industry Developments
- May 2025: Epicor introduced Carbon Cost Rollup to embed CO₂ as an operational currency in manufacturing ERP lines.
- March 2025: Persefoni raised USD 23 million to expand AI-powered Scope 3 and supplier-engagement modules.
- February 2025: Zefiro Methane Corp. joined forces with Fiùtur to heighten transparency in credit issuance processes.
- January 2025: Gravity closed a USD 13 million Series A round to enhance real-time emissions monitoring across multiple jurisdictions.


Global Carbon Accounting Market Report Scope
| Cloud-Based |
| On-Premise |
| Software Platforms |
| Services |
| Energy and Utilities |
| Oil and Gas |
| Construction and Infrastructure |
| Telecommunications |
| Food and Beverages |
| Other Industries |
| North America | United States |
| Canada | |
| Mexico | |
| Europe | Germany |
| United Kingdom | |
| France | |
| Italy | |
| NORDIC Countries | |
| Russia | |
| Rest of Europe | |
| Asia-Pacific | China |
| India | |
| Japan | |
| South Korea | |
| ASEAN Countries | |
| Rest of Asia-Pacific | |
| South America | Brazil |
| Argentina | |
| Rest of South America | |
| Middle East and Africa | Saudi Arabia |
| United Arab Emirates | |
| South Africa | |
| Egypt | |
| Rest of Middle East and Africa |
| By Deployment Type | Cloud-Based | |
| On-Premise | ||
| By Component | Software Platforms | |
| Services | ||
| By End-User Industry | Energy and Utilities | |
| Oil and Gas | ||
| Construction and Infrastructure | ||
| Telecommunications | ||
| Food and Beverages | ||
| Other Industries | ||
| By Geography | North America | United States |
| Canada | ||
| Mexico | ||
| Europe | Germany | |
| United Kingdom | ||
| France | ||
| Italy | ||
| NORDIC Countries | ||
| Russia | ||
| Rest of Europe | ||
| Asia-Pacific | China | |
| India | ||
| Japan | ||
| South Korea | ||
| ASEAN Countries | ||
| Rest of Asia-Pacific | ||
| South America | Brazil | |
| Argentina | ||
| Rest of South America | ||
| Middle East and Africa | Saudi Arabia | |
| United Arab Emirates | ||
| South Africa | ||
| Egypt | ||
| Rest of Middle East and Africa | ||


Key Questions Answered in the Report
What is the projected value of the carbon accounting market in 2031?
The carbon accounting market is expected to reach USD 97.58 billion by 2031, expanding at a 26.78% CAGR.
Which deployment model is growing fastest?
Cloud deployments show the strongest trajectory, rising at 28.03% CAGR thanks to easier integration and lower capital cost.
Which industry segment will expand most rapidly?
Construction and infrastructure is forecast to grow at 30.4% CAGR as embodied-carbon rules tighten and green-building demand rises.
What key technology differentiators are emerging?
AI-driven anomaly detection, blockchain-based credit traceability, and integrated ERP/PLM connectors now separate leading offerings from basic tools.
How do new disclosure mandates affect platform demand?
CSRD, SEC and IFRS rules require assured, multi-jurisdictional inventories, pushing companies to consolidate reporting on scalable unified platforms.
Why are Scope 3 emissions so critical?
Scope 3 categories often represent 70-90% of a company’s footprint, so accurate value-chain tracking is pivotal for credible disclosures.
Page last updated on:


