Carbon Credit Market Size and Share
Market Overview
| Study Period | 2020 - 2030 |
|---|---|
| Market Size (2025) | USD 0.89 Trillion |
| Market Size (2030) | USD 4.53 Trillion |
| Growth Rate (2025 - 2030) | 38.41% CAGR |
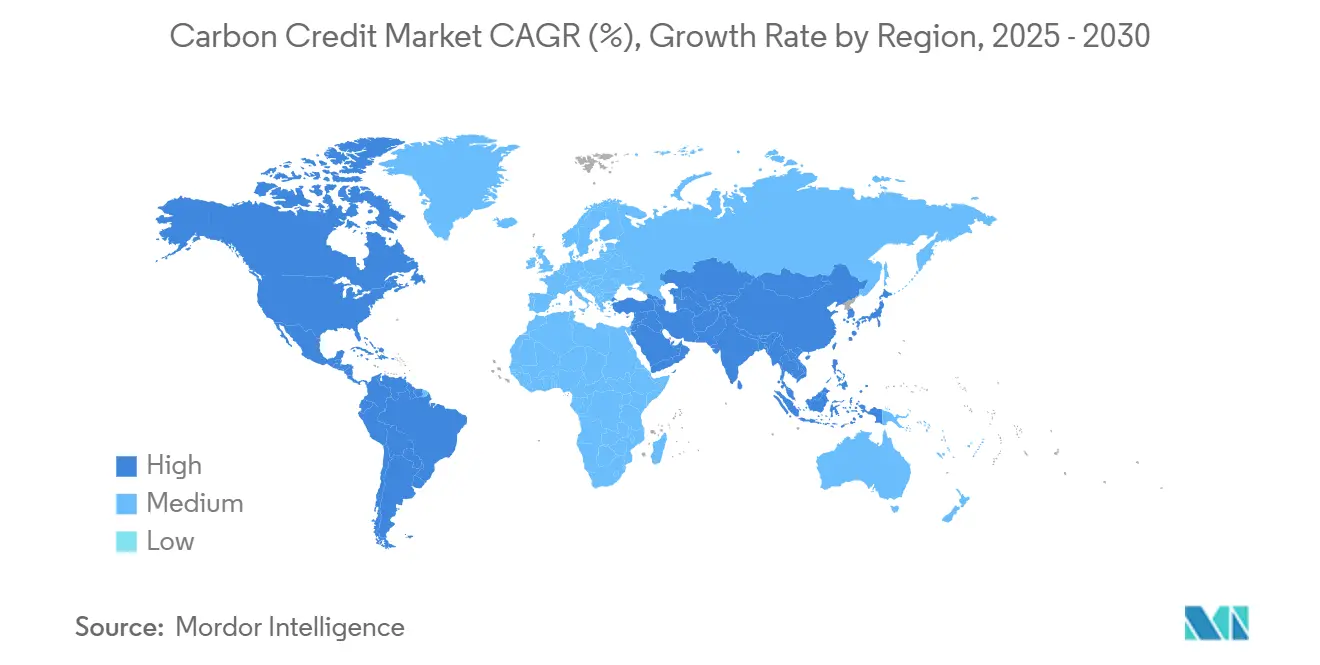
| Fastest Growing Market | Asia Pacific |
| Largest Market | Europe |
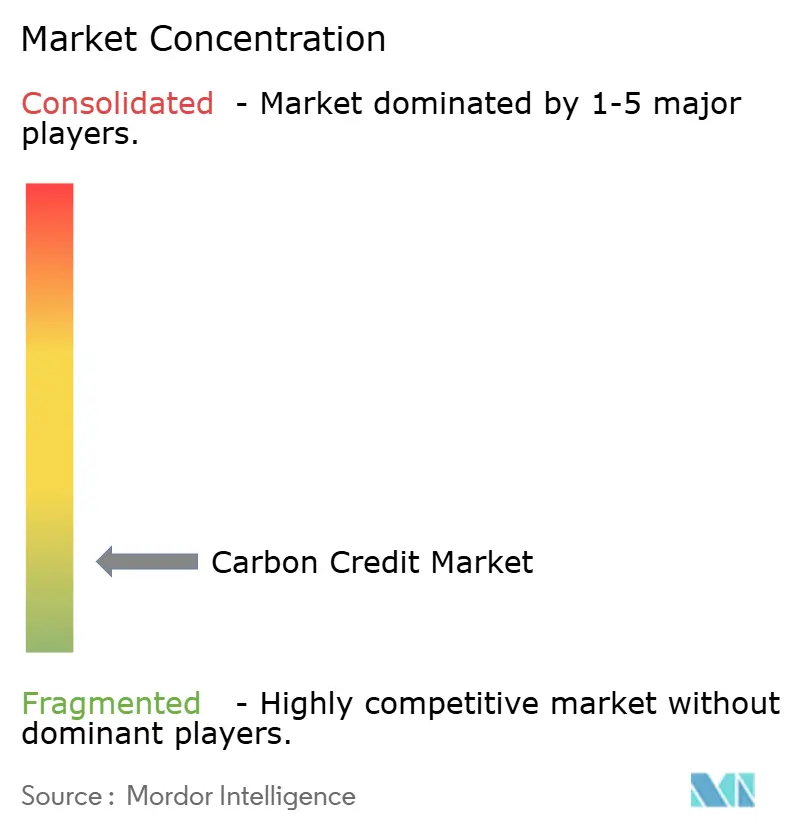
| Market Concentration | Low |
Major Players *Disclaimer: Major Players sorted in no particular order Image © Mordor Intelligence. Reuse requires attribution under CC BY 4.0. | |

Carbon Credit Market Analysis by Mordor Intelligence
The Carbon Credit Market size is estimated at USD 0.89 trillion in 2025, and is expected to reach USD 4.53 trillion by 2030, at a CAGR of 38.41% during the forecast period (2025-2030).
Rapid scale-up of emissions trading schemes, mandatory Scope-3 disclosures, and heightened corporate net-zero pledges are accelerating credit demand across compliance and voluntary channels. Renewable energy procurement keeps baseline volumes high, yet nature-based removal projects are capturing premium prices as buyers shift to credits with measurable biodiversity and community benefits. Digital monitoring, reporting, and verification (MRV) technologies and blockchain registries are tightening credit integrity, improving investor confidence, and drawing institutional capital. Meanwhile, geopolitical friction around the EU Carbon Border Adjustment Mechanism (CBAM) is prompting trading partners to establish domestic carbon markets, supporting global credit liquidity.
Key Report Takeaways
- By type, the compliance segment held 99.2% of the carbon credit market share in 2024, while the voluntary segment is projected to expand at a 50.1% CAGR through 2030.
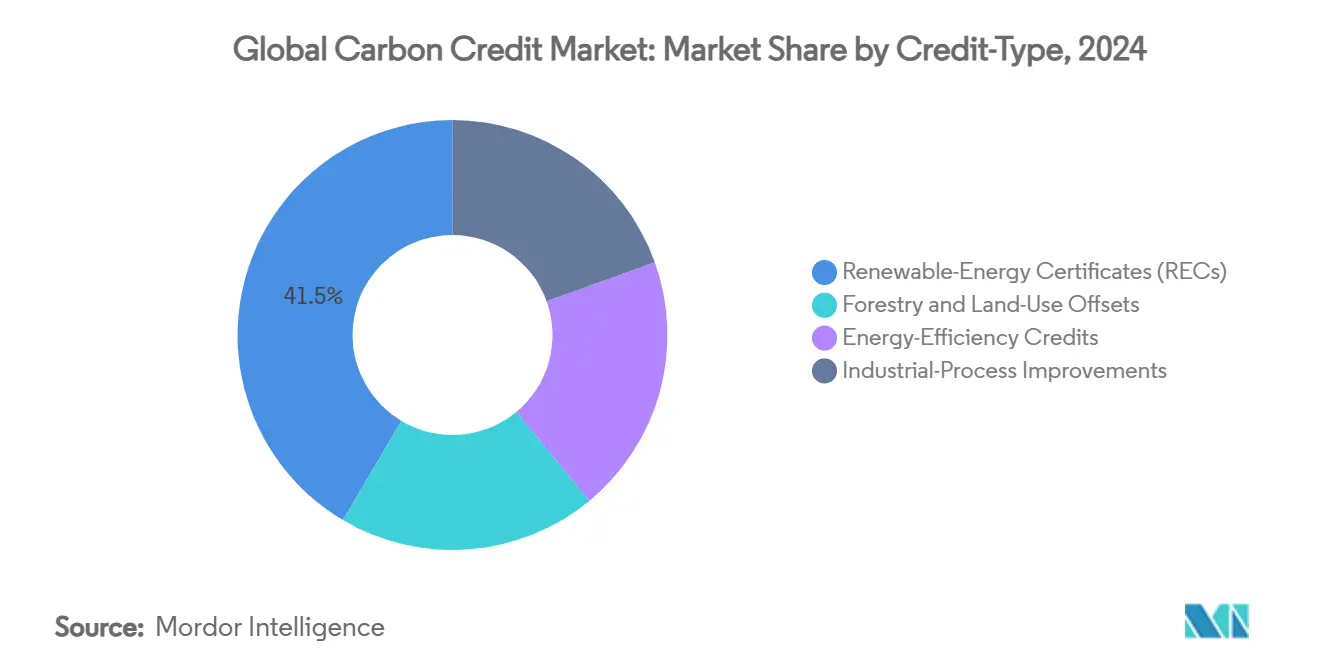
- By credit type, renewable energy certificates accounted for a 41.5% share of the carbon credit market size in 2024, whereas forestry and land-use offsets are forecast to grow at a 45.3% CAGR to 2030.
- By delivery type, spot transactions controlled 60.2% revenue in 2024; futures and forwards are anticipated to rise at a 43.5% CAGR through 2030.
- By end-user, energy and utilities commanded 63.6% of the carbon credit market size in 2024, while transportation is advancing at a 46.4% CAGR between 2025 and 2030.
- By geography, Europe contributed 77.4% of carbon credit market share in 2024, yet Asia-Pacific shows the fastest trajectory at a 44.8% CAGR to 2030.
Global Carbon Credit Market Trends and Insights
Drivers Impact Analysis*
| Driver | (~) % Impact on CAGR Forecast | Geographic Relevance | Impact Timeline |
|---|---|---|---|
| Expansion of compliance ETS across emerging economies | +6.2% | APAC core, spill-over to MEA and Latin America | Medium term (2-4 years) |
| Corporate net-zero commitments accelerating VCM demand | +5.8% | Global, with concentration in North America & EU | Short term (≤ 2 years) |
| Rise in carbon pricing mechanisms and higher allowance prices | +4.1% | Global, led by EU and spreading to APAC | Medium term (2-4 years) |
| Digital MRV & blockchain boosting credit transparency | +3.7% | Global, with early adoption in North America & EU | Long term (≥ 4 years) |
| Scope-3 disclosure mandates lifting removal-credit demand | +2.9% | North America & EU, expanding to APAC | Short term (≤ 2 years) |
| CORSIA Phase-2 tightening spurring nature-based credits | +2.4% | Global aviation hubs, concentrated in major economies | Medium term (2-4 years) |
| Source: Mordor Intelligence | |||
Expansion of compliance ETS across emerging economies
China’s decision in March 2025 to include cement, steel, and aluminum in its national ETS pulled 1,500 firms and roughly 3 billion tCO₂e under a capped regime, equal to 5% of worldwide emissions. Indonesia introduced the IDX Carbon exchange in January 2025 with an opening price of USD 8 per ton, signaling Southeast Asia’s entry into structured trading. India confirmed that a federal carbon market will launch by mid-2026, creating a unified credit platform for multiple industries. Pakistan approved national carbon-trading regulations in February 2025, broadening South Asian participation. Collectively, these programs reposition emerging economies as both substantial buyers and suppliers, reshaping credit flows and spreading regulatory best practices
Corporate net-zero commitments accelerating VCM demand
The Symbiosis Coalition—Google, Meta, Microsoft, and Salesforce—pledged up to 20 million tCO₂e in nature-based removals by 2030, underscoring a pivot from offsets to durable removals. South Pole’s entry into Argentina’s Carbon Roundtable in December 2024 shows corporates looking beyond mature markets for lower-cost, high-additionality credits. Verified Carbon Standard (VCS) issuances climbed 35% through August 2024, reflecting stronger procurement pipelines. Corporations now demand projects with biodiversity and social co-benefits, creating premium tiers and rewarding developers able to document wider sustainability outcomes. This evolution indicates that voluntary purchasing moves from philanthropic offsets to strategic environmental asset management.
Rise in carbon pricing mechanisms and higher allowance prices
The EU ETS produced EUR 43.6 billion for climate programs in 2024, with stationary-source emissions down 16.5% year-on-year.[1]European Commission, “2024 Carbon Market Report,” europa.eu Australia’s ACCU spot price is forecast to rise 75% to AUD 70 by 2025 as demand under the Safeguard Mechanism tightens. Japan’s Green Transformation (GX) plan commits USD 1 trillion across a decade to backstop its ETS, moving the system from pilot to mandatory compliance by 2026. Higher allowance prices narrow the cost delta between internal abatement and external credit purchases, spurring broader adoption of renewable and low-carbon technologies while attracting financial investors seeking arbitrage across regions.
Digital MRV & blockchain boosting credit transparency
Gold Standard’s digital MRV blueprint enables automated data capture, cutting verification costs and reducing human error risk.[2]Gold Standard, “Digital MRV Framework,” goldstandard.org MSCI now tracks more than 30,000 projects and 1 million transactions, supplying investment-grade analytics to portfolio managers assessing credit quality. The Commodity Futures Trading Commission (CFTC) published guidance on derivatives settling in tokenized credits, bringing blockchain into regulated finance. China revised ETS legislation to mandate digital registries and tough penalties for misreporting, ensuring end-to-end auditability. Satellite-based forest monitoring paired with smart contracts now flags reversals quickly, improving credit durability assessments and raising market confidence.
Restraints Impact Analysis*
| Restraint | (~) % Impact on CAGR Forecast | Geographic Relevance | Impact Timeline |
|---|---|---|---|
| Oversupply of low-quality credits eroding buyer confidence | -3.2% | Global, particularly affecting VCM | Short term (≤ 2 years) |
| Fragmented global standards & double-counting risks | -2.8% | Global, with regional variations | Medium term (2-4 years) |
| Geopolitical CBAM tensions limiting cross-border flows | -1.9% | EU-China trade corridors, extending globally | Long term (≥ 4 years) |
| Re-versal liability concerns hurting forestry financing | -1.6% | Global forestry projects, concentrated in tropics | Medium term (2-4 years) |
| Source: Mordor Intelligence | |||
Oversupply of low-quality credits eroding buyer confidence
Bloomberg tracked a 61% value drop in the voluntary market amid reports that many credits deliver limited climate benefit. Sylvera noted Q1 2025 retirements of 54.56 million versus 55.63 million issuances, flirting with a first-time net negative supply-demand balance as buyers screen rigorously for quality. The market prefers “Goldilocks” vintages (3-5 years old), representing 60% of retirements, indicating sophisticated selection criteria. Average spot prices dipped 20% in 2024, but high-integrity credits remain resilient, suggesting a bifurcated pricing structure. The Integrity Council’s Core Carbon Principles aim to restore trust, yet meaningful recovery hinges on consistently adopting robust verification norms.
Fragmented global standards & double-counting risks
The CFTC flagged regulatory gaps between compliance and voluntary frameworks, complicating derivatives oversight.[3]Commodity Futures Trading Commission, “Advisory on Carbon Credits,” cftc.gov Carbon Market Watch highlighted that mismatched accounting rules still allow credit use in multiple jurisdictions. Although COP29 produced baseline guidance for cross-border transfers, national implementation diverges, fostering arbitrage and uncertainty. The UN Paris Agreement’s new Crediting Mechanism rules mandate leakage controls and conservative baselines, but enforcement consistency remains untested. Developers face higher due diligence costs without harmonized registries, and buyers risk headline exposure.
*Our forecasts treat driver/restraint impacts as directional, not additive. The impact forecasts reflect baseline growth, mix effects, and variable interactions.
Segment Analysis
By Type: Compliance mechanisms underpin scale
The compliance segment accounted for 99.2% of the Global carbon credit market size in 2024, as mandatory caps obligated covered entities to purchase allowances or offsets. Robust coverage expansion—in particular China’s inclusion of heavy industry and the EU’s extension to maritime emissions—continues to swell transaction volumes, securing predictable revenue for market infrastructure providers. Firms participating in compliance programs are now layering voluntary purchases on top of regulated requirements to meet holistic net-zero targets, blending lower-cost allowances with premium nature-based removals. This dual strategy strengthens liquidity but accentuates price stratification between generic and high-quality credits. Voluntary activity, while just 0.8% in 2024, is forecast to scale at a 50.1% CAGR as corporate disclosure mandates proliferate. As more jurisdictions move toward linked ETS platforms, cross-border fungibility will improve, lowering transaction costs and fostering arbitrage opportunities for sophisticated traders.
The compliance focus encourages financial intermediaries to build futures and options tied to benchmark allowance prices, deepening secondary-market depth. Voluntary credits benefit indirectly as corporates hedge compliance exposures and seek diversified portfolios that address supply-chain footprints. However, rule discrepancies among systems still impose additional due diligence costs, creating a niche for consultancies and ratings services. Over the forecast period, policy clarity and harmonization will determine whether compliance dominance persists or whether the voluntary space captures a larger slice of the Global carbon credit market share.
By Credit-Type: REC leadership meets forestry surge
Renewable energy certificates (RECs) held 41.5% of the carbon credit market share in 2024, anchored by continued corporate power-purchase agreements and guaranteed origin schemes ACORE.ORG. Despite market maturity, stable demand from data-center operators and heavy industry ensures steady issuance pipelines. Forestry and land-use credits, however, are the fastest-growing at a 45.3% CAGR, propelled by buyers seeking removal solutions with verifiable biodiversity co-benefits and community impact. Improved satellite monitoring and digital MRV have boosted confidence in permanence claims, narrowing historical quality gaps. Energy-efficiency and industrial-process credits offer incremental abatement at lower cost, but they attract narrower buyer pools due to more complex measurement protocols.
Premium pricing is emerging for credits integrating multiple environmental attributes, such as REDD+ projects incorporating watershed protection. Meanwhile, engineered removals like bioenergy with carbon capture and storage (BECCS) and direct-air-capture remain nascent but stand to command the highest clearing prices once scalable. Government procurement programs—most notably Japan’s GX fund—are expected to stimulate the supply of advanced credits, further diversifying the portfolio available to institutional investors. These shifts make credit-type selection a strategic lever for buyers balancing cost, durability, and reputational objectives.


By Delivery Type: Spot supremacy with growing futures depth
Spot delivery represented 60.2% of the carbon credit market size 2024, reflecting immediate surrender obligations in compliance systems and corporate preference for retiring credits promptly. However, futures and forward contracts are growing at a 43.5% CAGR as market participants seek to lock in prices, finance new projects, and hedge exposure to volatile allowance markets. Exchanges such as CME and Intercontinental Exchange have launched standardized futures tied to compliance allowances and voluntary offsets, broadening access for financial players. Index providers now publish daily settlement benchmarks, laying the groundwork for exchange-traded funds and structured products.
Liquidity concentration in near-dated contracts still limits price discovery for longer horizons, but regulatory support—such as the CFTC’s recent guidance—should accelerate maturation. Futures curves enable project developers to secure bank financing against forward sales, shortening payback periods and lowering capital costs. In turn, better-capitalized developers can bring higher-quality projects to market, enhancing overall credit integrity. Nonetheless, counterparty-risk management and physical delivery logistics remain critical factors that market infrastructure must continually refine.
By End-user: Utilities dominate while transport accelerates
Energy and utilities comprised 63.6% of the Global carbon credit market size in 2024 due to renewable-portfolio standards and thermal generation caps. Utilities often face multi-jurisdictional compliance obligations, prompting them to aggregate large allowance positions and actively trade to optimize costs. They also purchase voluntary offsets to market green tariffs to retail customers. Transportation, despite its smaller baseline, is expanding most rapidly at 46.4% CAGR, driven by aviation’s CORSIA mandates and maritime inclusion in the EU ETS. Airlines prioritize credits that meet stringent permanence and additionality criteria, while shipping companies blend offset purchases with investments in alternative fuels.
Industrial manufacturing remains a steady buyer, targeting process-efficiency credits and exploring carbon-capture installations to minimize exposure to rising allowance prices. Agriculture and forestry sectors participate as credit suppliers and buyers because sustainable practices can unlock additional revenue streams and help meet internal emission targets. Over the forecast window, end-user diversification will broaden liquidity and encourage tailored credit classes that align with sector-specific abatement challenges.

Geography Analysis
Europe retained a 77.4% share of the Global carbon credit market in 2024, supported by the mature EU ETS and the phased rollout of CBAM. Emissions from stationary sources fell 16.5% year-on-year, underscoring the scheme’s effectiveness in driving decarbonization. The upcoming inclusion of maritime transport and stringent aviation requirements is set to lift compliance demand further. Price volatility persists, but established financial infrastructure and transparent policy roadmaps maintain investor confidence. Most European buyers now favor high-integrity removal credits, rewarding projects with strong monitoring records and co-benefits.
Asia-Pacific is the fastest-growing region, advancing at a 44.8% CAGR as China, India, and Japan build national trading systems. China’s March 2025 sectoral expansion brought an additional 3 billion tCO₂e into its ETS, creating the world’s largest compliance market by coverage. India’s forthcoming market promises cross-sector trading and potential linkages with other Asian schemes. Japan’s USD 1 trillion GX initiative underwrites credit purchases and technological deployments, stimulating supply of both domestic and imported offsets. Indonesia’s IDXCarbon and Pakistan’s regulatory framework further widen regional participation, while ASEAN discussions on mutual recognition could reduce transaction barriers.
North America exhibits steady momentum through California’s cap-and-trade and strong voluntary uptake among Fortune 500 firms. Deep capital markets and advanced ratings services help differentiate credit quality, sustaining premium prices for high-integrity removals. South America offers significant growth potential, particularly through forestry projects in Brazil, Peru, and Argentina, the latter bolstered by Verra’s involvement in the Carbon Roundtable. Middle East & Africa enter the arena via sovereign and exchange-backed platforms such as Saudi Arabia’s Regional Voluntary Carbon Market Co. and South Africa’s JSE initiative. Abundant land for renewable projects and large-scale sequestration allows the regioning credit exporter as standards harmonize.

Competitive Landscape
Carbon credit market competition remains moderately fragmented but is trending toward consolidation as service providers integrate development, verification, and trading capabilities. Non-profits like Verra and Gold Standard Foundation anchor project certification, while for-profit firms like South Pole scale origination and brokerage operations.[4]Verra, “Joining Argentina Carbon Roundtable,” verra.org Exchange operators—ICE, EEX, CME, and regional counterparts—are racing to capture liquidity by launching futures and clearing services tailored to compliance allowances and voluntary credits. Technology innovators provide satellite analytics, AI-driven risk scoring, and blockchain registries, giving buyers granular insights into project performance.
MSCI’s carbon-markets data platform exemplifies how financial information providers build moats through comprehensive datasets covering tens of thousands of projects. Corporate alliances such as the Symbiosis Coalition illustrate vertical integration, with end-users procuring directly from selected developers to secure supply and guarantee quality. Competition is especially intense in emerging Asia-Pacific and Latin America, where first-mover projects can lock in long-term supply agreements with multinational buyers. At the same time, durability concerns push developers to diversify credit portfolios and incorporate insurance products, adding new layers of competitiveness around risk management.
Market entry barriers are rising as regulators tighten integrity requirements and buyers demand transparent MRV. Firms combining domain expertise, technological infrastructure, and cross-regional presence will likely capture greater wallet share. Conversely, smaller stand-alone developers risk marginalization unless they partner with larger platforms to access finance and verification resources.
Carbon Credit Industry Leaders
South Pole
Anew Climate (Bluesource)
Climate Impact X
Shell Environmental Products
Evolution Markets
- *Disclaimer: Major Players sorted in no particular order

Recent Industry Developments
- April 2025: China expanded its national ETS to cement, steel, and aluminum, adding 1,500 companies and 3 billion tCO₂e under coverage.
- January 2025: Indonesia launched IDXCarbon with an opening price of USD 8 per ton and 1.735 million tCO₂e listed from energy projects.
- December 2024: Verra is aligned with Argentina’s Carbon Roundtable, a coalition of over 45 entities from the nation's carbon markets. This roundtable seeks to fortify Argentina's stance as a global frontrunner in carbon markets.
- May 2024: Google, Meta, Microsoft, and Salesforce formed the Symbiosis Coalition, targeting 20 million tCO₂e nature-based removals by 2030.


Global Carbon Credit Market Report Scope
| Compliance Carbon Market |
| Voluntary Carbon Market |
| Renewable-Energy Certificates (RECs) |
| Forestry and Land-Use Offsets |
| Energy-Efficiency Credits |
| Industrial-Process Improvements |
| Spot (Physical) |
| Futures/Forwards |
| Energy and Utilities |
| Transportation |
| Industrial Manufacturing |
| Agriculture and Forestry |
| North America | United States |
| Canada | |
| Mexico | |
| Europe | Germany |
| United Kingdom | |
| France | |
| Italy | |
| NORDIC Countries | |
| Russia | |
| Rest of Europe | |
| Asia-Pacific | China |
| India | |
| Japan | |
| South Korea | |
| ASEAN Countries | |
| Rest of Asia-Pacific | |
| South America | Brazil |
| Argentina | |
| Rest of South America | |
| Middle East and Africa | Saudi Arabia |
| United Arab Emirates | |
| South Africa | |
| Egypt | |
| Rest of Middle East and Africa |
| By Type | Compliance Carbon Market | |
| Voluntary Carbon Market | ||
| By Credit-Type | Renewable-Energy Certificates (RECs) | |
| Forestry and Land-Use Offsets | ||
| Energy-Efficiency Credits | ||
| Industrial-Process Improvements | ||
| By Delivery Type | Spot (Physical) | |
| Futures/Forwards | ||
| By End-user | Energy and Utilities | |
| Transportation | ||
| Industrial Manufacturing | ||
| Agriculture and Forestry | ||
| By Geography | North America | United States |
| Canada | ||
| Mexico | ||
| Europe | Germany | |
| United Kingdom | ||
| France | ||
| Italy | ||
| NORDIC Countries | ||
| Russia | ||
| Rest of Europe | ||
| Asia-Pacific | China | |
| India | ||
| Japan | ||
| South Korea | ||
| ASEAN Countries | ||
| Rest of Asia-Pacific | ||
| South America | Brazil | |
| Argentina | ||
| Rest of South America | ||
| Middle East and Africa | Saudi Arabia | |
| United Arab Emirates | ||
| South Africa | ||
| Egypt | ||
| Rest of Middle East and Africa | ||


Key Questions Answered in the Report
What was the value of the Global carbon credit market in 2025?
The Global carbon credit market was valued at USD 891.81 billion in 2025.
How fast is the Global carbon credit market expected to grow to 2030?
It is projected to expand at a 38.41% CAGR, reaching USD 4,530.12 billion by 2030.
Which region currently leads in carbon credit transactions?
Europe leads, capturing 77.4% of 2024 transaction value due to the EU ETS.
Why are forestry and land-use credits gaining attention?
Buyers favor them for high-integrity carbon removal and biodiversity co-benefits, driving a 45.3% forecast CAGR.
What impact will CORSIA Phase-2 have on credit demand?
Stricter aviation offset rules are set to boost airline purchases of nature-based credits.
How do digital MRV systems improve credit integrity?
They automate data capture and verification, providing real-time transparency and reducing fraud risk.
Page last updated on:


