Voluntary Carbon Credit Market Size and Share
Market Overview
| Study Period | 2020 - 2030 |
|---|---|
| Market Size (2025) | USD 15.83 Billion |
| Market Size (2030) | USD 120.47 Billion |
| Growth Rate (2025 - 2030) | 50.06% CAGR |
| Fastest Growing Market | Asia Pacific |
| Largest Market | North America |
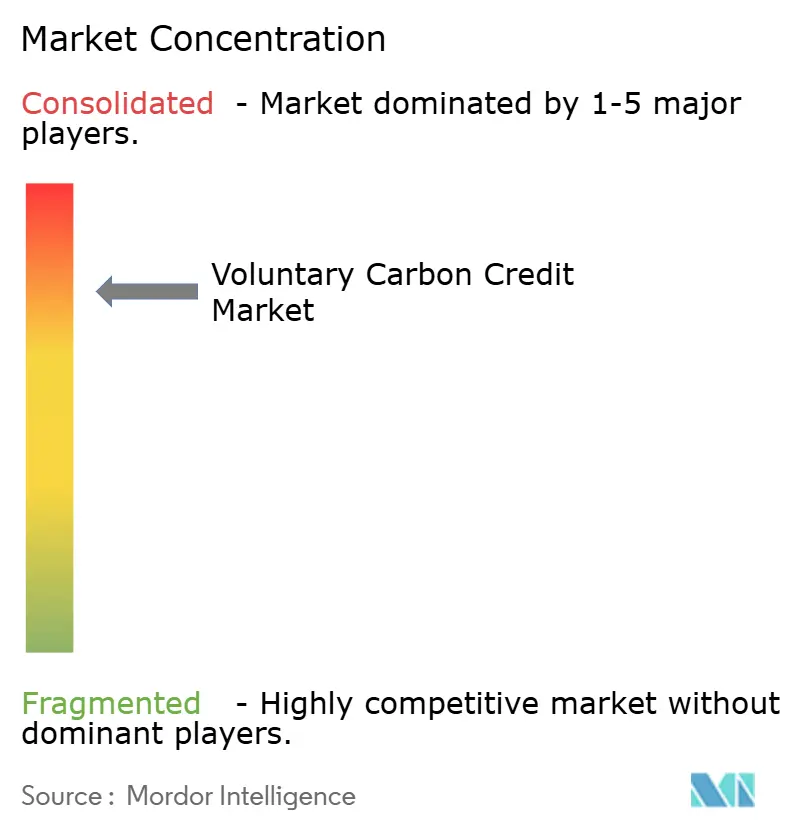
| Market Concentration | High |
Major Players *Disclaimer: Major Players sorted in no particular order Image © Mordor Intelligence. Reuse requires attribution under CC BY 4.0. | |

Voluntary Carbon Credit Market Analysis by Mordor Intelligence
The Voluntary Carbon Credit Market size is estimated at USD 15.83 billion in 2025, and is expected to reach USD 120.47 billion by 2030, at a CAGR of 50.06% during the forecast period (2025-2030).
Corporate net-zero commitments covering over half of the world’s largest companies are the principal growth catalyst, shifting credits from a niche offset tool to mainstream climate-finance infrastructure. Quality differentiation now dominates pricing, as Core Carbon Principles (CCP)-eligible instruments attract sizeable premiums while low-integrity alternatives face declining demand. Digital monitoring, reporting, and verification (MRV) platforms integrated with blockchain reduce issuance costs and speed verification, enabling near-real-time assurance for project developers. Geographically, North America retained leadership in 2024, yet Asia-Pacific is on course to become the largest incremental contributor because of abundant nature-based project capacity and fast-growing corporate demand.
Key Report Takeaways
- By credit type, avoidance and reduction projects commanded 69.4% of the voluntary carbon credit market share in 2024; removal credits are set to grow at a 55.9% CAGR through 2030.
- By project category, renewable energy led with 39.1% share of the voluntary carbon credit market size in 2024, while waste management and methane avoidance projects are poised for the fastest 52.6% CAGR between 2025 and 2030.
- By end user, corporate net-zero buyers captured 60.0% of the voluntary carbon credit market in 2024; consumer goods and retail companies are forecast to post a 54.0% CAGR to 2030.
- By geography, North America accounted for 37.5% of the voluntary carbon credit market size in 2024, whereas Asia-Pacific is projected to compound at 58.4% through 2030.
Global Voluntary Carbon Credit Market Trends and Insights
Drivers Impact Analysis*
| Driver | (~) % Impact on CAGR Forecast | Geographic Relevance | Impact Timeline |
|---|---|---|---|
| Corporate net-zero commitments escalating | 12.50% | Global, with concentration in North America & EU | Medium term (2-4 years) |
| Emergence of Core Carbon Principles & other high-integrity standards | 8.70% | Global, with early adoption in developed markets | Short term (≤ 2 years) |
| Rapid digitisation & blockchain-based MRV platforms | 6.30% | Global, with APAC leading implementation | Medium term (2-4 years) |
| Demand spike for carbon-removal credits for e-fuels certification | 4.80% | EU, North America, with spillover to APAC | Long term (≥ 4 years) |
| Securitisation of credits into structured finance products | 3.20% | North America & EU financial centers | Medium term (2-4 years) |
| Regional "carbon-club" initiatives (e.g., Asia Carbon Alliance) | 2.90% | APAC core, with expansion to MEA | Long term (≥ 4 years) |
| Source: Mordor Intelligence | |||
Corporate Net-Zero Commitments Escalating
More than 6,200 companies held science-based targets in 2025, turning voluntary pledges into fiduciary obligations that spur systematic procurement strategies within the voluntary carbon credit market.[1] Google’s purchase of USD 100 million in carbon-removal credits during 2024 highlighted growing willingness to fund premium projects. Retailers have begun portfolio-based sourcing that pairs credits with in-house efficiency actions, reducing Scope 3 emissions while maintaining capital flexibility. Large banks are layering credits into sustainability-linked loans, exemplified by a USD 210 million carbon-backed facility arranged in 2025. The move from ad-hoc buying to integrated financing embeds credits in corporate capital allocation processes, reinforcing demand predictability and volume growth.
Emergence of Core Carbon Principles & High-Integrity Standards
The Integrity Council’s Core Carbon Principles created the first global benchmark for voluntary credit quality, sparking a two-tier market where CCP-approved units command outsized valuations. Verra’s 2025 issuance under a CCP-aligned methodology signaled operational rollout, while Gold Standard updated its frameworks to enhance Paris Agreement alignment. Stock exchanges such as Hong Kong’s Core Climate platform have begun listing only high-integrity credits, concentrating liquidity around recognized registries in the voluntary carbon credit market. Standardized ratings narrow information asymmetries, facilitating institutional allocations from pension and insurance funds. Quality benchmarks catalyze consolidation among project developers that can meet the stricter criteria.
Rapid Digitization & Blockchain-Based MRV Platforms
Digital MRV trials demonstrate up to 90% cycle-time reduction and significant cost savings relative to traditional field-audit models. Blockchain settles ownership instantly and curtails double-counting, as illustrated by KlimaDAO’s registry integrations. The European Bank for Reconstruction and Development’s D-MRV protocol promotes shared rules that accelerate adoption across emerging markets. Satellite and IoT sensors continuously monitor forest biomass, bolstering permanence assurances critical to buyers concerned about reversal risks. These technologies jointly improve transparency and help smaller projects reach issuance thresholds, broadening supply diversity in the voluntary carbon credit market.
Demand Spike for Carbon-Removal Credits for E-Fuels Certification
International Civil Aviation Organization rules require sustainable aviation fuels (SAF) to demonstrate up to 90% lifecycle emissions reduction, intensifying interest in removal credits integrated with e-fuel production.[2] Boeing’s collaboration with Norsk e-Fuel on a Nordic electro-SAF plant showcases how direct air capture credits underpin certification of Power-to-Liquid fuels. EU legislation to raise SAF blending to 70% by 2050 embeds durable demand for verified removals. Renewable fuels of non-biological origin must exceed a 70% savings threshold, anchoring long-term offtake agreements that enhance project bankability. Engineered removal credits, therefore, shift from speculative instruments in the voluntary carbon credit market to compliance-linked assets.
Restraints Impact Analysis*
| Restraint | (~) % Impact on CAGR Forecast | Geographic Relevance | Impact Timeline |
|---|---|---|---|
| Quality & additionality controversies driving reputational risk | -8.4% | Global, with heightened scrutiny in developed markets | Short term (≤ 2 years) |
| Fragmented regulatory recognition & legal uncertainty | -5.7% | Global, with particular challenges in cross-border transactions | Medium term (2-4 years) |
| Collapse in avoidance-credit prices raising opportunity cost | -4.2% | Global, with acute impact in forestry and renewable energy projects | Short term (≤ 2 years) |
| Counter-party risk in long-dated offtake agreements | -3.1% | Global, with concentration in emerging market projects | Long term (≥ 4 years) |
| Source: Mordor Intelligence | |||
Quality & Additionality Controversies Driving Reputational Risk
High-profile investigations into overstated forest-credit baselines eroded market value by over 70% between 2021 and 2024, prompting buyers to scrutinize vintage, methodology, and permanence before purchase. The U.S. Commodity Futures Trading Commission’s 2024 enforcement against data manipulation heightened awareness of legal liability. The United Kingdom, Kenya, and Singapore formed a coalition to harmonize integrity rules ahead of COP30, signaling political acknowledgment of credibility gaps in the voluntary carbon credit market. California’s AB 1305 now mandates public disclosure of credit attributes behind climate claims, anchoring transparency expectations for multinationals operating in the state. Rising due-diligence costs could deter smaller corporates from participation, though they simultaneously reward high-quality projects with scarcity premiums.
Fragmented Regulatory Recognition & Legal Uncertainty
Divergent national rules complicate cross-border credit transfers and create compliance complexity; the EU’s Carbon Border Adjustment Mechanism may overlap with voluntary claims, challenging corporate accounting consistency.[3] OECD, “International Carbon Credit Regulation Gaps,” oecd.orgArticle 6 of the Paris Agreement provides a cooperation framework, yet only a limited set of bilateral authorizations exists, constraining fungibility. Absence of uniform financial-reporting treatment exposes firms to varying asset-classification rules, affecting balance-sheet valuation. Indonesia’s CO2 transport and storage proposal illustrates emerging rules that still require streamlining before multi-jurisdictional projects can flourish. Until convergence improves, legal uncertainty will temper investment appetite in the voluntary carbon credit market.
*Our forecasts treat driver/restraint impacts as directional, not additive. The impact forecasts reflect baseline growth, mix effects, and variable interactions.
Segment Analysis
By Credit Type: Removal Credits Capture Premium Valuations
Removal credits account for the fastest 55.9% CAGR but still trail avoidance and reduction units that held a 69.4% voluntary carbon credit market share in 2024. Engineered technologies such as direct air capture receive corporate pre-payments at rates several times higher than traditional offsets because they guarantee permanent atmospheric CO2 elimination. The voluntary carbon credit market size allocated to removal projects is expected to expand steadily as science-based targets push for greater permanence assurances. Avoidance credits continue to supply large volumes from renewable energy and forestry, yet ongoing additionality debates narrow eligible baselines, increasing the relative scarcity of high-integrity certificates. Portfolio diversity across credit types remains central to procurement strategies, balancing near-term affordability with long-term climate objectives.
Because monitoring removal projects relies heavily on continuous data feeds, digitized MRV increases verification confidence and unlocks institutional capital. Conversely, forestry avoidance projects struggle to prove permanence over decades, prompting some developers to explore hybrid models that layer soil carbon removal atop conservation commitments. Although reduction credits still represent 22% of global issuances, their scope extends beyond operational efficiency toward process-intensive methods that align with corporate science-based pathways. This evolving mix will keep the voluntary carbon credit market in a state of dynamic price discovery over the outlook period.


By Project Category: Waste Management Outpaces Renewable Energy
Renewable energy retained a 39.1% share of the voluntary carbon credit market in 2024, benefiting from mature methodologies and predictable output. Yet methane-focused waste management projects are slated to grow at a 52.6% CAGR, buoyed by the dual revenue streams of power generation and credit sales. Landfill gas-to-energy systems achieving 98% methane destruction highlight superior mitigation economics while qualifying for sizable credit issuance volumes. The voluntary carbon credit market size tied to landfill projects is projected to climb as municipal authorities emulate Australia’s high-efficiency model.
Integrating bitcoin mining with landfill gas capture introduces alternative financing mechanisms and insulates projects from policy shifts by locking in power buyers. Forestry and land-use projects maintain significant issuance but face stricter permanence audits. Blue carbon and agricultural soil initiatives are gaining visibility as MRV methods mature, offering co-benefits for biodiversity and community livelihoods. Aggregation platforms spearheaded by multilateral agencies now pool small-scale ventures into bankable portfolios, helping voluntary carbon credit market to democratize developer participation across emerging economies.
By End User: Consumer Goods Accelerate Adoption
Corporate net-zero buyers absorbed 60.0% of total 2024 demand, but consumer goods and retail companies are projected for a standout 54.0% CAGR to 2030 as supply-chain decarbonization mandates tighten. Retailers face Scope 3 emissions that surpass 98% of total company footprints, making carbon credits critical to bridging residual gaps after operational improvements. Therefore, the voluntary carbon credit market size attributed to the retail sector will rise as procurement is embedded in supplier contracts. Energy utilities and transport firms continue to leverage credits for hard-to-abate segments such as aviation and marine freight, often bundling them with renewable-energy certificates in integrated purchasing frameworks.
Financial institutions remain investors and end users, with banks bundling credits into green bonds and structured loans. Hospitality groups differentiate guest experiences by bundling verified credits into carbon-neutral stays. Multisector demand diversification reduces concentration risk and underpins the long-term depth of the voluntary carbon credit market. As sector-specific baselines evolve, end-user procurement strategies will increasingly revolve around matching project attributes to brand-level sustainability narratives.

Geography Analysis
Asia-Pacific is poised to reshape the voluntary carbon credit market balance, registering a forecast 58.4% CAGR through 2030 thanks to abundant renewable, forestry, and emerging direct-air-capture potential. China’s reactivation of its Certified Emission Reduction scheme in 2024 unlocked roughly 250 million t CO2 of annual issuance capacity, tightening global supply-demand dynamics while offering domestic corporations compliance-grade options. Singapore’s Carbon Market Alliance positions the city-state as a regional clearing hub, enabling cross-border trades anchored by Article 6 quality requirements and leveraging cost-effective storage solutions in Indonesia and Malaysia.
North America retained a 37.5% voluntary carbon credit market share in 2024, underpinned by sophisticated financial infrastructure and state-level regulations such as California’s Low-Carbon Fuel Standard. Federal agencies clarified derivative trading standards, attracting institutional capital via exchange-listed funds that mirror verified credit baskets. Project development trends lean toward engineered removals and waste-management methane destruction, which align with corporates’ permanence preferences.
Europe exerts outsized influence on price and quality in the voluntary carbon credit market, driven by the EU Carbon Border Adjustment Mechanism and Refuel EU Aviation regulation that embeds high-integrity credit demand into trade and transport policy. Germany, France, and the United Kingdom champion removal-heavy portfolios, while Nordic governments blend removal credits with renewable power certificates for holistic climate compliance. Harmonized accounting within the bloc aids cross-border project financing, although Article 6 bilateral agreements still lag, limiting fungibility with non-EU issuances.


Competitive Landscape
The voluntary carbon credit market demonstrates moderate fragmentation but consolidates around registries and platforms that satisfy CCP criteria. Verra and Gold Standard have achieved early ICVCM approval across multiple methodologies, securing first-mover advantages for projects tapping premium buyer segments. Digital-native intermediaries such as Climate Impact X and Patch reduce transaction friction by coupling API-driven procurement with real-time inventory tracking. Tokenization ventures provide fractionalized ownership and secondary liquidity, with AirCarbon Exchange illustrating how blockchain lowers settlement risk and improves auditability.
Strategic emphasis is shifting toward vertical integration; South Pole’s recapitalization in 2025 prioritized in-house risk management and portfolio diligence to safeguard against quality lapses. International Swaps and Derivatives Association templates, finalized in 2022, enable standardized physically delivered futures, drawing hedge funds and commodity desks into the voluntary carbon credit market. Specialized niches such as blue carbon remain less contested, offering room for new entrants that can master emerging methodologies. Competitive positioning increasingly hinges on proprietary data analytics that validate project baselines and predict reversal probability, with partnerships like Planet Labs–Laconic supplying high-resolution remote-sensing insights.
Voluntary Carbon Credit Industry Leaders
Verra
Gold Standard Foundation
American Carbon Registry
Climate Action Reserve
South Pole
- *Disclaimer: Major Players sorted in no particular order

Recent Industry Developments
- July 2025: JPMorgan and Microsoft backed a USD 210 million carbon loan in a landmark climate finance deal, demonstrating institutional capital markets' growing appetite for carbon credit-collateralized financing structures that provide project developers with upfront funding against future credit delivery, Carbon Credits.
- April 2025: Verra registered its first project using a CCP-approved VCS methodology, marking the operational launch of the Integrity Council's quality framework and establishing precedent for premium pricing of Core Carbon Principles-eligible credits.
- March 2025: ICAO approved four new carbon standards for CORSIA, expanding eligible emissions units for aviation sector compliance and including Gold Standard, Verra, Climate Action Reserve, and Global Carbon Council South Pole.
- August 2024: Hong Kong Exchanges introduced Gold Standard carbon credits on the Core Climate platform, enhancing the diversity of internationally certified climate projects available for trading with Hong Kong Dollar and Renminbi settlement.


Global Voluntary Carbon Credit Market Report Scope
| Avoidance/Reduction Projects |
| Removal Projects |
| Renewable Energy |
| Forestry and Land Use (REDD+, Afforestation, etc.) |
| Waste Management and Methane Avoidance |
| Agriculture |
| Blue Carbon |
| Other Niche Project Types |
| Corporate (Net-Zero Commitments) |
| Energy and Utilities |
| Transportation and Logistics |
| Consumer Goods and Retail |
| Others |
| North America | United States |
| Canada | |
| Mexico | |
| Europe | Germany |
| United Kingdom | |
| France | |
| Italy | |
| NORDIC Countries | |
| Russia | |
| Rest of Europe | |
| Asia-Pacific | China |
| India | |
| Japan | |
| South Korea | |
| ASEAN Countries | |
| Rest of Asia-Pacific | |
| South America | Brazil |
| Argentina | |
| Rest of South America | |
| Middle East and Africa | Saudi Arabia |
| United Arab Emirates | |
| South Africa | |
| Egypt | |
| Rest of Middle East and Africa |
| By Credit Type | Avoidance/Reduction Projects | |
| Removal Projects | ||
| By Project Category | Renewable Energy | |
| Forestry and Land Use (REDD+, Afforestation, etc.) | ||
| Waste Management and Methane Avoidance | ||
| Agriculture | ||
| Blue Carbon | ||
| Other Niche Project Types | ||
| By End-User | Corporate (Net-Zero Commitments) | |
| Energy and Utilities | ||
| Transportation and Logistics | ||
| Consumer Goods and Retail | ||
| Others | ||
| By Geography | North America | United States |
| Canada | ||
| Mexico | ||
| Europe | Germany | |
| United Kingdom | ||
| France | ||
| Italy | ||
| NORDIC Countries | ||
| Russia | ||
| Rest of Europe | ||
| Asia-Pacific | China | |
| India | ||
| Japan | ||
| South Korea | ||
| ASEAN Countries | ||
| Rest of Asia-Pacific | ||
| South America | Brazil | |
| Argentina | ||
| Rest of South America | ||
| Middle East and Africa | Saudi Arabia | |
| United Arab Emirates | ||
| South Africa | ||
| Egypt | ||
| Rest of Middle East and Africa | ||


Key Questions Answered in the Report
What was the global value of the voluntary carbon credit market in 2025?
The voluntary carbon credit market size reached USD 15.83 billion in 2025.
How fast is the voluntary carbon credit market expected to grow through 2030?
The sector is projected to register a 50.06% CAGR, taking total value to USD 120.47 billion by 2030.
Which region will contribute the most incremental growth?
Asia-Pacific is forecast to post the highest 58.4% CAGR, transforming regional supply and demand dynamics.
Why do removal credits command higher prices than avoidance credits?
Removal credits deliver permanent atmospheric CO2 elimination, aligning closely with science-based net-zero pathways, leading buyers to pay premiums.
How are corporate buyers integrating credits into financing strategies?
Companies increasingly embed credits into sustainability-linked loans, securitizations, and structured carbon-backed facilities to fund decarbonization initiatives.
What quality standards govern premium voluntary credits?
The Integrity Council’s Core Carbon Principles define benchmarks that registries must satisfy to achieve CCP-eligible status, ensuring high environmental integrity.
Page last updated on:


