Compliance Carbon Credit Market Size and Share
Market Overview
| Study Period | 2021 - 2031 |
|---|---|
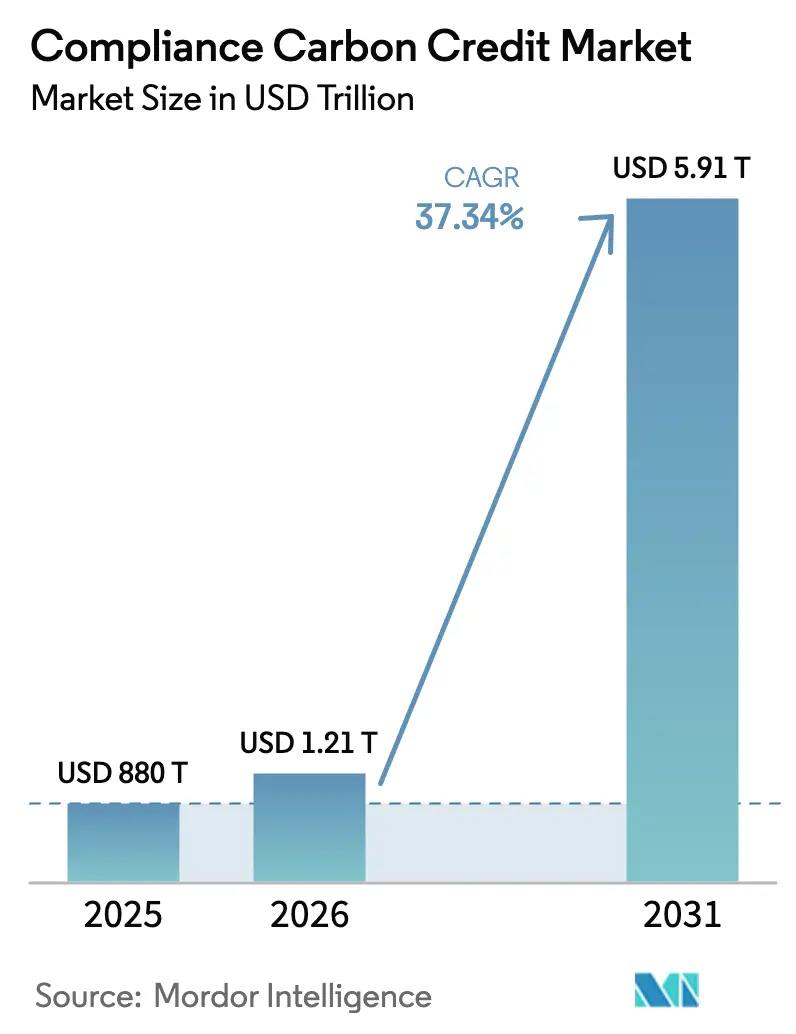
| Market Size (2026) | USD 1.21 Trillion |
| Market Size (2031) | USD 5.91 Trillion |
| Growth Rate (2026 - 2031) | 37.34% CAGR |
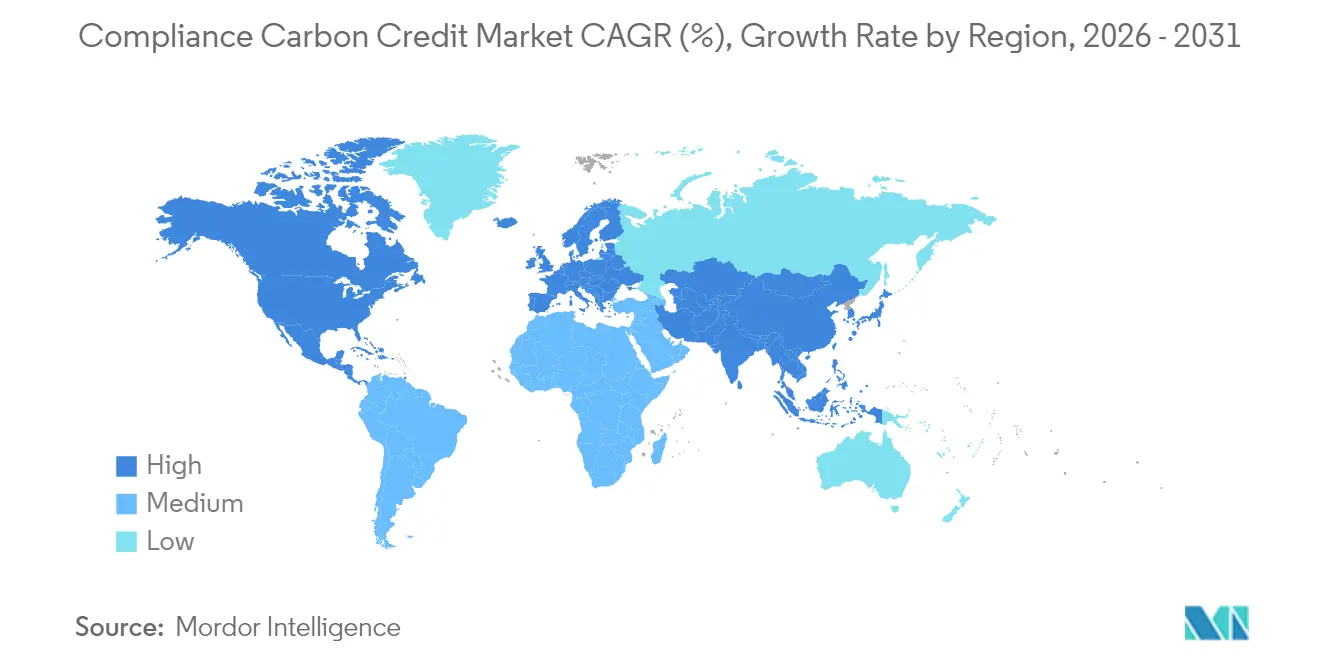
| Fastest Growing Market | Asia Pacific |
| Largest Market | Europe |
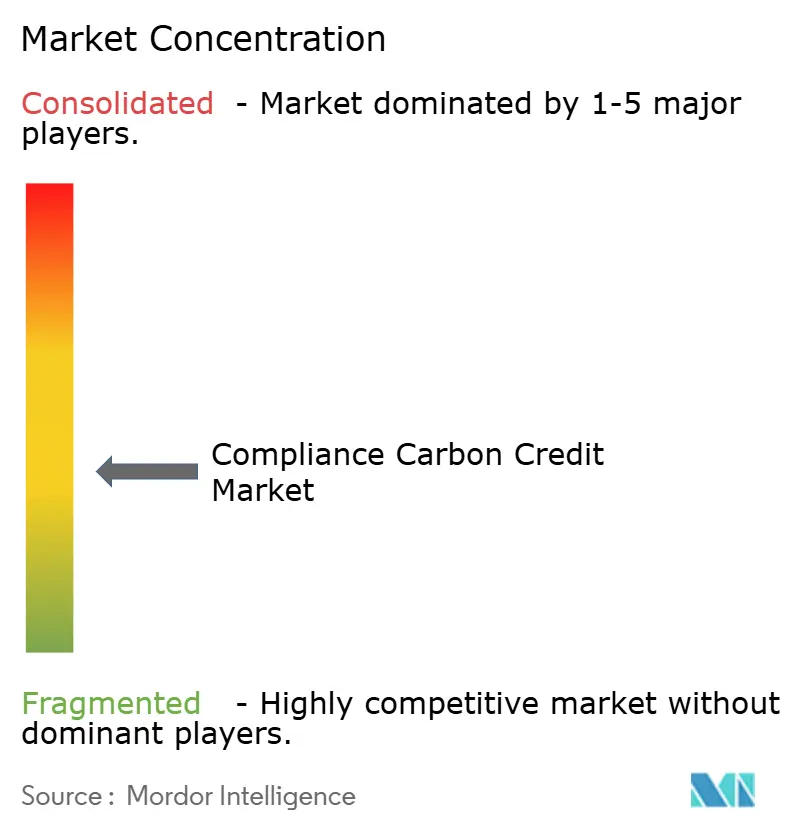
| Market Concentration | Medium |
Major Players *Disclaimer: Major Players sorted in no particular order Image © Mordor Intelligence. Reuse requires attribution under CC BY 4.0. | |
Compliance Carbon Credit Market Analysis by Mordor Intelligence
Compliance Carbon Credit market size in 2026 is estimated at USD 1,208.59 billion, growing from 2025 value of USD 880 billion with 2031 projections showing USD 5,907.9 billion, growing at 37.34% CAGR over 2026-2031.
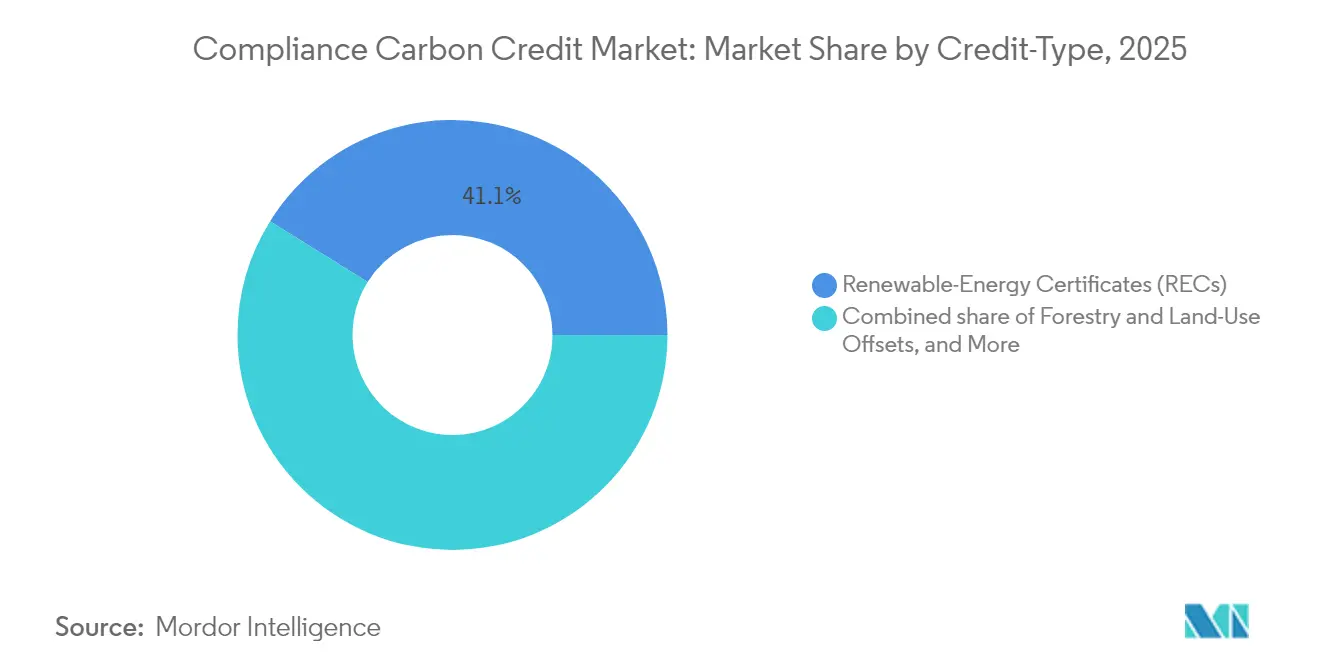
Growing regulatory stringency, widening corporate net-zero commitments, and the emergence of internationally linked trading mechanisms are jointly reshaping price discovery and driving sustained demand across the compliance carbon credit market. Europe currently dominates the market; however, the Asia-Pacific region is experiencing a rapid shift in geographic demand as China, South Korea, and New Zealand implement national schemes. Renewable Energy Certificates hold a 41.5% share by credit type, although Nature-based Forestry and Land-Use Offsets are gaining momentum, with a 45.3% trajectory, buoyed by premium pricing for removal-focused assets. Energy and Utilities account for 63.6% of procurement, reflecting power generators’ direct exposure to cap-and-trade rules. Meanwhile, transportation exhibits the fastest growth, driven by CORSIA and maritime decarbonization mandates. Parallel growth in futures and forwards signals a maturing derivatives layer that is drawing new liquidity providers into the compliance carbon credit market.
Key Report Takeaways
- By credit type, Renewable Energy Certificates held 41.12% of the compliance carbon credit market share in 2025, whereas Forestry and Land-Use Offsets are projected to expand at a 43.94% CAGR through 2031.
- By compliance scheme, EU-ETS allowances commanded a 74.12% share of the compliance carbon credit market size in 2025; emerging “Others” schemes are forecast to grow at a 48.2% annual rate to 2031.
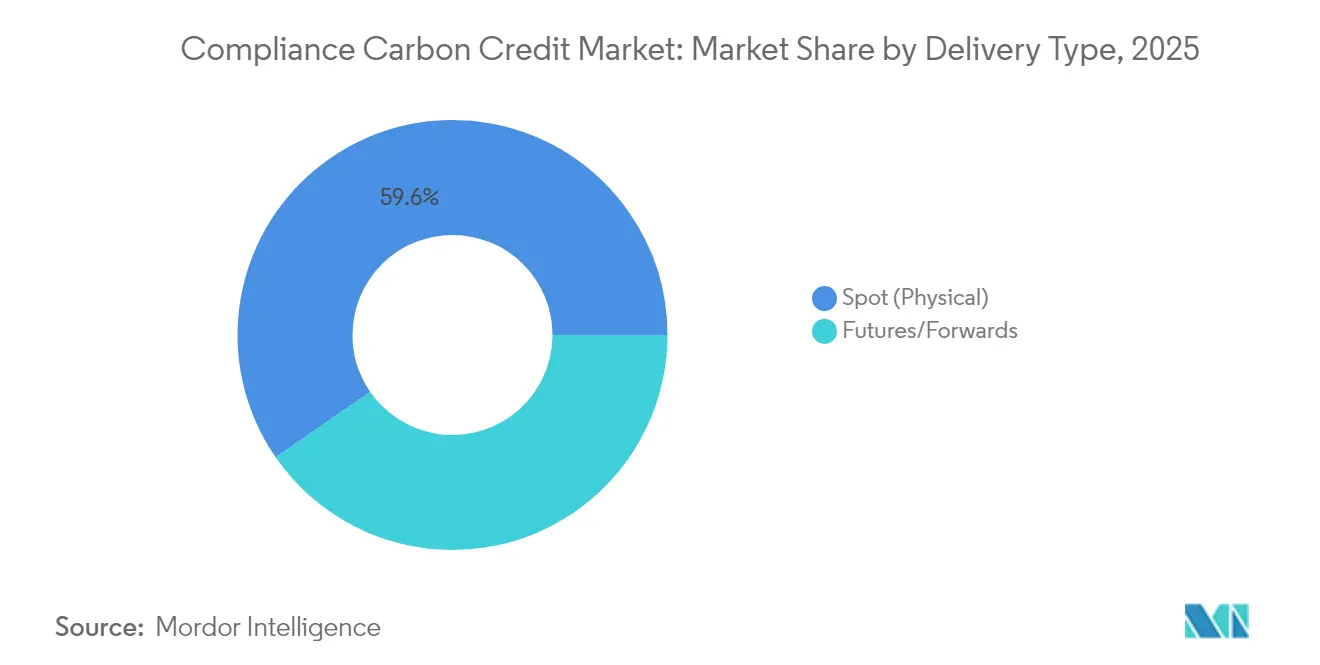
- By delivery method, spot transactions captured 59.63% of the revenue in 2025, while futures and forwards contracts are poised to grow at a 41.2% CAGR between 2026 and 2031.
- By end user, the Energy and Utilities segment led with a 62.95% share in 2025, while transportation recorded the highest 44.1% CAGR outlook.
- By geography, Europe dominates with a 76.85% revenue share in 2025; the Asia-Pacific region is projected to post the fastest growth, with a 42.6% CAGR from 2026 to 2031.
Note: Market size and forecast figures in this report are generated using Mordor Intelligence’s proprietary estimation framework, updated with the latest available data and insights as of 2026.
Global Compliance Carbon Credit Market Trends and Insights
Drivers Impact Analysis*
| Driver | (~) % Impact on CAGR Forecast | Geographic Relevance | Impact Timeline |
|---|---|---|---|
| Expanding stringency of cap-and-trade programmes | 6.20% | Global, with EU and Asia-Pacific leading | Medium term (2-4 years) |
| Increasing corporate net-zero commitments | 8.40% | Global, concentrated in North America & EU | Long term (≥ 4 years) |
| Carbon-border adjustments spur demand | 7.10% | EU core, spillover to trading partners globally | Short term (≤ 2 years) |
| Article-6 bilateral trading uptake | 5.80% | Asia-Pacific core, expanding to Latin America | Medium term (2-4 years) |
| Digital MRV accelerates credit issuance | 4.70% | Global, with early adoption in developed markets | Short term (≤ 2 years) |
| Financial-institution participation boosts liquidity | 2.30% | North America & EU, expanding to Asia-Pacific | Long term (≥ 4 years) |
| Source: Mordor Intelligence | |||
Expanding Stringency of Cap-and-Trade Programmes
Mandatory carbon ceilings are tightening across every major jurisdiction, generating structural demand within the compliance carbon credit market. China’s March 2025 inclusion of cement, steel, and aluminum adds 3 billion t CO₂e to regulated coverage, while the EU’s Market Stability Reserve has withdrawn more than 2.3 billion allowances since 2024, anchoring price floors.[1]Asia Society Policy Institute, “China Expands National ETS to Heavy Industry,” asiasociety.org Brazil’s 2024 SBCE law establishes compulsory trading for high-emitting industries by 2030, and India’s CCTS rules lay the groundwork for exchange-based compliance trading from 2026. The UK confirmation in May 2025 that it will link with the EU ETS shows that once installed, cap-and-trade systems rarely reverse course. Collectively, these moves lock in a progressively tighter emissions budget that underpins long-run value in the compliance carbon credit market.
Increasing Corporate Net-Zero Commitments
Corporate buyers are transitioning from basic offsets to removal-oriented credits, which reinforces quality and price premiums. A 2024 Nasdaq survey found that 93% of companies hold carbon credit strategies, and 57% specifically target removals, signaling that voluntary procurement behavior is now influencing compliance segments.[2]Nasdaq, “Global Net-Zero Survey 2024,” nasdaq.com J.P. Morgan Chase and Bank of America together have earmarked USD 2.5 trillion for climate-aligned finance through 2030, explicitly carving out budgets for high-quality compliance credits. The updated VCMI Claims Code introduces Silver, Gold, and Platinum tiers for permanence and additionality, directing demand toward registry-verified assets that can be seamlessly integrated into compliance obligations. Microsoft’s 8 million-tonne removal purchase in 2024 became a benchmark that other corporates emulate, raising the bar for integrity in the compliance carbon credit industry.
Carbon-Border Adjustments Spur Demand
The EU’s Carbon Border Adjustment Mechanism imposes quarterly reporting duties on importers of aluminum, cement, fertilizers, hydrogen, and steel, adding immediate compliance costs for firms outside the bloc. The UK will implement CBAM from January 2027, while California’s Low Carbon Fuel Standard amendment establishes a domestic CBAM-style rule targeting a 30% reduction in carbon intensity by 2030. Because CBAMs credit carbon paid in an equivalent jurisdiction, they have become a catalyst for ETS linking, lifting cross-border liquidity in the compliance carbon credit market. Their trade-policy nature repositions credits from purely environmental instruments to de facto customs clearances.
Article-6 Bilateral Trading Uptake
Governments are turning to Article 6.2 deals to shortcut protracted multilateral talks. Singapore-Rwanda, Ghana-Singapore, and Indonesia-Japan agreements illustrate a template under which states exchange ITMOs while retaining sovereignty over baselines. The UN’s May 2025 adoption of the Paris Agreement Crediting Mechanism rules created a governance backbone; already, 287 projects, led by 89 in Brazil, seek a transition. California’s partnership with Panama further hints at sub-national deployments. As these bilateral tracks expand, cross-border recognition of high-integrity carbon units will deepen liquidity and heighten price coherence in the compliance carbon credit market.
Restraints Impact Analysis*
| Restraint | (~) % Impact on CAGR Forecast | Geographic Relevance | Impact Timeline |
|---|---|---|---|
| Policy uncertainty from political shifts | -3.20% | Global, particularly US and emerging markets | Short term (≤ 2 years) |
| Complex & fragmented compliance rules | -2.80% | Global, with highest impact in multi-jurisdictional operations | Medium term (2-4 years) |
| Double-counting risk with voluntary credits | -1.90% | Global, concentrated in Article 6 implementation regions | Medium term (2-4 years) |
| Algorithmic-trading-induced price volatility | -1.50% | Developed markets with advanced trading infrastructure | Long term (≥ 4 years) |
| Source: Mordor Intelligence | |||
Policy Uncertainty from Political Shifts
Election cycles can stall or dilute climate legislation. Singapore’s financial sector fines rose 22% in 2024, foreshadowing tougher AML/KYC oversight that may raise onboarding costs for carbon desks.[3]Fenergo, “Financial Crime Fines 2024 Report,” fenergo.com Pakistan approved a trading framework in February 2025, but its execution is contingent upon fiscal stability and external financing. In the United States, coordinated CFTC-DOJ-SEC probes into carbon-credit fraud enhance credibility in the long term, yet inflate compliance budgets in the short term. Such unpredictability can defer project-finance decisions and dampen the near-term outlook of the compliance carbon credit industry.
Complex & Fragmented Compliance Rules
Across borders, divergent baselines and leakage tests can inflate transaction expenses, particularly for multinationals that juggle multiple schemes. Gold Standard's June 2024 tracker catalogues mismatched MRV protocols, which complicate cross-jurisdictional transfers.[4]Gold Standard, “Carbon Market Regulations Tracker,” goldstandard.org The EU's CBAM employs a methodology that differs from domestic ETS reporting, whereas the UK's planned CBAM adds a layer. Fragmentation also afflicts forestry offsets where permanence requirements vary widely, creating hidden liabilities that curb issuance in the compliance carbon credit market.
*Our forecasts treat driver/restraint impacts as directional, not additive. The impact forecasts reflect baseline growth, mix effects, and variable interactions.
Segment Analysis
By Credit Type: Nature-Based Solutions Command Premium Pricing
Forestry and Land-Use Offsets are on track for a 43.94% CAGR between 2026 and 2031, outpacing Renewable Energy Certificates’ 41.12% 2025 share within the compliance carbon credit market. Premium REDD+ projects regularly fetch double the average voluntary price because removal credits satisfy both regulatory and reputational objectives. Cost-effective natural regeneration registers USD 23.80 t/CO₂, compared to more than USD 600 t/CO₂ for direct air capture, thereby anchoring a bifurcated pricing curve. Even so, studies questioning additionality in 90% of forestry credits have amplified calls for end-to-end digital MRV and third-party audits, helping credible issuers consolidate market trust.
Second-tier categories, such as Energy-Efficiency and Industrial-Process credits, remain relevant where electrification hurdles persist-specifically in steel, cement, and chemicals-providing predictable, albeit slower, growth. Increasingly, corporations blend nature-based removals with industrial abatement to hedge against permanence risk, a trend that widens product diversity within the compliance carbon credit market.


By Compliance Scheme: Emerging Markets Challenge EU Dominance
EU-ETS allowances generated 74.12% of the 2025 turnover, but "Other" schemes, including New Zealand, South Korea, China, and upcoming Brazil, are expected to post a 48.2% CAGR, reducing Europe's share over time. China's expansion alone adds 3 billion tonnes of coverage, while its CCER relaunch in 2024 reopens a domestic offset pipeline. Meanwhile, South Korea's K-ETS reforms allow banks to trade spot and derivatives, boosting liquidity.
The compliance carbon credit market size attached to the UK-ETS is expected to benefit once the May 2025 EU-UK linking deal is finalized, setting a precedent that could motivate the alignment of California's RGGI. Japan's GX-ETS will transition from voluntary to mandatory by 2026, enrolling more than 550 corporations that collectively emit half of the country's greenhouse gases. Mature North American programs, such as RGGI, enjoy policy continuity but exhibit slower growth.
By Delivery Method: Futures Markets Gain Liquidity
Spot transactions still accounted for 59.63% in 2025, but futures and forwards are scaling at a 41.2% CAGR. CFTC-approved derivatives have made carbon a hedgeable commodity, attracting asset managers and proprietary desks that value two-way markets. Indonesia’s January 2025 launch on IDX listed 1.7 million credits and framed them legally as securities, signalling institutional design innovations from the Global South. Secondary trading of tokenized credits reached USD 21.2 million in 2024, a relatively small amount by commodity standards, yet it represents evidence of widening participation.
Algorithmic liquidity providers cut bid-ask spreads but introduce flash-crash risk. Northern Trust’s blockchain system embeds compliance checkpoints into smart contracts, potentially limiting spoofing and wash trades that can destabilize the compliance carbon credit market.
By End User: Transportation Demand Outpaces Utilities
Utilities drove 62.95% of 2025 credit usage, reflecting power-sector caps. However, transportation’s 44.1% CAGR dwarfs all others, as airlines under CORSIA and shipping firms face IMO decarbonization rules, chasing aviation-grade or ocean methodology credits. EU and UK sustainable-aviation mandates escalate from 2% SAF in 2025 to 70% by 2050, ensuring a baseline demand pull. The US Department of Energy’s USD 6 billion industrial fund also taps credits for hard-to-abate sectors, further broadening offtake sources.
Industrial manufacturers deploy credits as bridge solutions until breakthrough technologies as green hydrogen and CCUS, scale. Agriculture also adopts soil-carbon projects, but at a moderated pace due to measurement complexities, sustaining a multi-speed dynamic within the compliance carbon credit market.
Geography Analysis
Europe remains the anchor, accounting for 76.85% of 2025 revenues; the EU ETS’ Market Stability Reserve has removed an accumulated 2.3 billion allowances, reinforcing the scarcity that firms have priced into forward curves. CBAM extends that influence overseas by compelling exporters to embed carbon costs in landed prices, a design that indirectly enlarges the compliance carbon credit market.
The Asia-Pacific region is the growth engine, forecasted to grow at a 42.6% CAGR. China’s expanded ETS coverage, the relaunch of CCER, and the exploration of EU linking signal a policy tilt toward carbon-market centrality. Japan’s GX-ETS will transition to auctions by 2033, and South Korea’s reforms now permit banks to act as intermediaries, while ASEAN members explore Article 6 credits to monetize forestry assets. Collectively, these steps institutionalise the compliance carbon credit market across the world’s manufacturing hubs.
North America shows mixed momentum. California’s LCFS requires 30% CI cuts by 2030 and 90% by 2045, fueling regional demand. Federal initiatives, including a USD 6 billion industrial decarbonisation fund, offset political gridlock at the congressional level. Canada’s Output-Based Pricing System harmonises provincial differences and allows inter-provincial trading. Latin America’s prospects brighten with Brazil’s SBCE law, while Zimbabwe’s first blockchain registry positions the continent as a credible supplier of high-integrity credits. These parallel developments collectively deepen the liquidity pool of the compliance carbon credit market.

Competitive Landscape
Competition is moderate and intensifying. Oil majors such as Shell, BP, and TotalEnergies extend their existing commodity-trading desks into carbon, leveraging their balance-sheet heft for large, structured deals. Specialist developers-such as South Pole, Climate Impact Partners, and 3Degrees-focus on origination and advisory services, securing early-stage project optionality. Exchange operators ICE, EEX, and Nasdaq Commodities benefit from license and clearing barriers, though blockchain-native platforms challenge fee structures through automated settlement.
Recent tactics include vertical integration and tokenisation. Shell’s planned divestiture of most of its oil and gas unit in November 2024 indicates a pivot to core hydrocarbons, whereas a UK-Kenya-Singapore coalition aims to underwrite high-integrity supply pipelines. Banks like HSBC create new credit classes for coal-asset retirement to monetise avoided emissions. Meanwhile, CFTC’s Environmental Fraud Task Force raises compliance overhead, implicitly favouring incumbents with robust legal budgets. Altogether, these forces underscore a convergence of energy, finance, and tech actors inside the compliance carbon credit market.
Compliance Carbon Credit Industry Leaders
Shell Environmental Products
BP
South Pole
Vitol
Engie Global Markets
- *Disclaimer: Major Players sorted in no particular order

Recent Industry Developments
- May 2025: The European Commission and the UK Government agreed to link the EU ETS and the UK ETS, establishing mutual allowance recognition.
- May 2025: The UNFCCC adopted baseline and leakage standards for the Paris Agreement Crediting Mechanism, preparing the first methodologies for approval by the end of 2025.
- March 2025: China expanded its national ETS to cement, steel, and aluminum, adding 3 billion t CO₂e coverage.
- January 2025: Indonesia initiated international carbon trading on the IDX platform, listing 1.7 million credits.
- February 2025: Northern Trust introduced its Carbon Ecosystem platform for institutional blockchain-based credit custody.


Global Compliance Carbon Credit Market Report Scope
Compliance carbon credits refer to tradable certificates representing the removal, reduction, or avoidance of one metric ton of CO2 or its equivalent in other greenhouse gases, which entities use to comply with emissions regulations. A complete background analysis of the compliance carbon credits market, including the assessment of the economy and contribution of sectors in the economy, market overview, market size estimation for key segments, and emerging trends in the market segments, market dynamics, and geographical trends, and COVID-19 impact, is covered in the report.
The compliance carbon credit market is segmented by types of credit (renewable energy projects, forestry and land use, energy efficiency, and industrial process improvements), sector (energy sector, transportation, industrial sector, and agriculture and forestry), and geography (North America, Europe, Asia-Pacific, Middle East and Africa, and Latin America). The report offers market size and forecasts for all the above segments in value (USD).
| Renewable-Energy Certificates (RECs) |
| Forestry and Land-Use Offsets |
| Energy-Efficiency Credits |
| Industrial-Process Improvements |
| EU-ETS Allowances (EUA) |
| UK-ETS Allowances (UKA) |
| California CCA |
| RGGI Allowances |
| Others (NZ-ETS, S-Korea K-ETS etc.) |
| Spot (Physical) |
| Futures/Forwards |
| Energy and Utilities |
| Transportation |
| Industrial Manufacturing |
| Agriculture and Forestry |
| North America | United States |
| Canada | |
| Mexico | |
| Europe | Germany |
| United Kingdom | |
| France | |
| Italy | |
| NORDIC Countries | |
| Russia | |
| Rest of Europe | |
| Asia-Pacific | China |
| India | |
| Japan | |
| South Korea | |
| ASEAN Countries | |
| Rest of Asia-Pacific | |
| South America | Brazil |
| Argentina | |
| Rest of South America | |
| Middle East and Africa | Saudi Arabia |
| United Arab Emirates | |
| South Africa | |
| Egypt | |
| Rest of Middle East and Africa |
| By Credit-Type | Renewable-Energy Certificates (RECs) | |
| Forestry and Land-Use Offsets | ||
| Energy-Efficiency Credits | ||
| Industrial-Process Improvements | ||
| By Compliance-Scheme | EU-ETS Allowances (EUA) | |
| UK-ETS Allowances (UKA) | ||
| California CCA | ||
| RGGI Allowances | ||
| Others (NZ-ETS, S-Korea K-ETS etc.) | ||
| By Delivery Type | Spot (Physical) | |
| Futures/Forwards | ||
| By End-user | Energy and Utilities | |
| Transportation | ||
| Industrial Manufacturing | ||
| Agriculture and Forestry | ||
| By Geography | North America | United States |
| Canada | ||
| Mexico | ||
| Europe | Germany | |
| United Kingdom | ||
| France | ||
| Italy | ||
| NORDIC Countries | ||
| Russia | ||
| Rest of Europe | ||
| Asia-Pacific | China | |
| India | ||
| Japan | ||
| South Korea | ||
| ASEAN Countries | ||
| Rest of Asia-Pacific | ||
| South America | Brazil | |
| Argentina | ||
| Rest of South America | ||
| Middle East and Africa | Saudi Arabia | |
| United Arab Emirates | ||
| South Africa | ||
| Egypt | ||
| Rest of Middle East and Africa | ||


Key Questions Answered in the Report
What is the current value of the compliance carbon credit market?
The compliance carbon credit market size stands at USD 1,208.59 billion in 2026 and is projected to reach USD 5,907.9 billion by 2031.
Which region leads the compliance carbon credit market?
Europe commands 76.85% market share in 2025, driven by the institutional maturity of the EU ETS.
Which segment is growing fastest within the compliance carbon credit market?
Forestry and Land-Use Offsets are forecast to expand at 43.94% CAGR from 2026 to 2031, outpacing all other credit types.
Why is the transportation sector’s demand for compliance credits rising?
Aviation’s CORSIA obligations and maritime decarbonization targets are propelling transportation to a 44.1% CAGR between 2026 and 2031.
What role do digital MRV platforms play in the compliance carbon credit market?
Blockchain-enabled monitoring accelerates verification, lowers costs and improves transparency, attracting institutional capital.
How will the EU-UK ETS linkage affect the market?
The May 2025 linkage enables mutual allowance recognition, boosting cross-border liquidity and improving price convergence.
Page last updated on:


