Canned Beverages Market Size and Share
Market Overview
| Study Period | 2021 - 2031 |
|---|---|
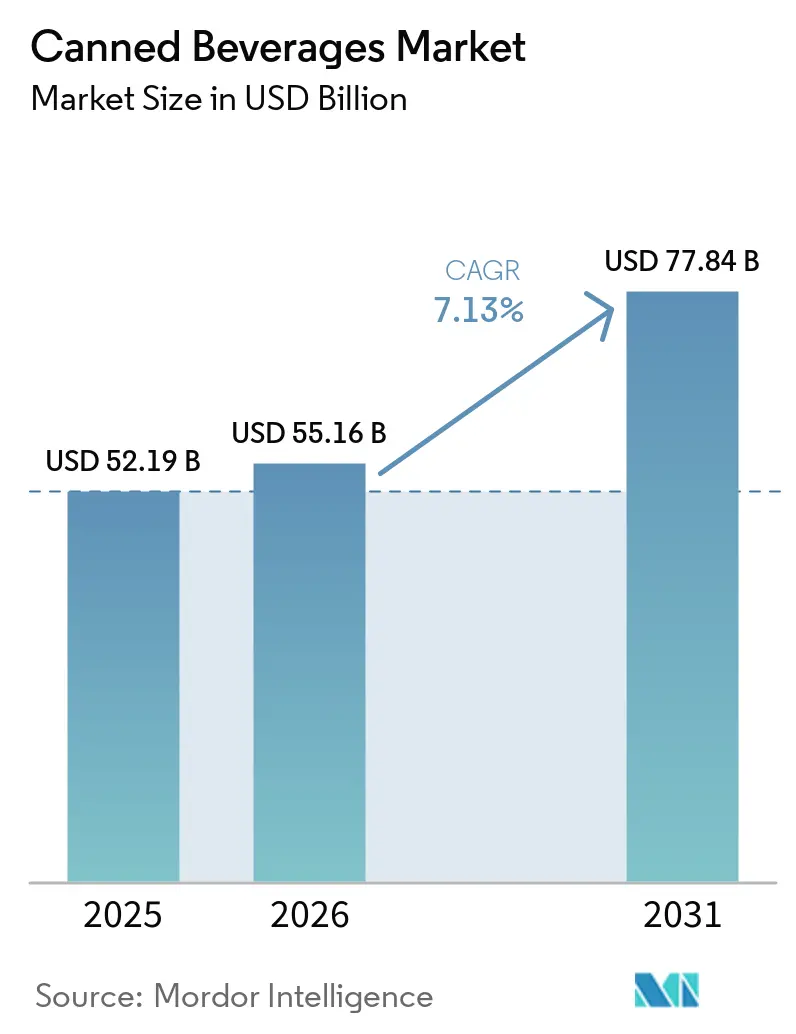
| Market Size (2026) | USD 55.16 Billion |
| Market Size (2031) | USD 77.84 Billion |
| Growth Rate (2026 - 2031) | 7.13% CAGR |
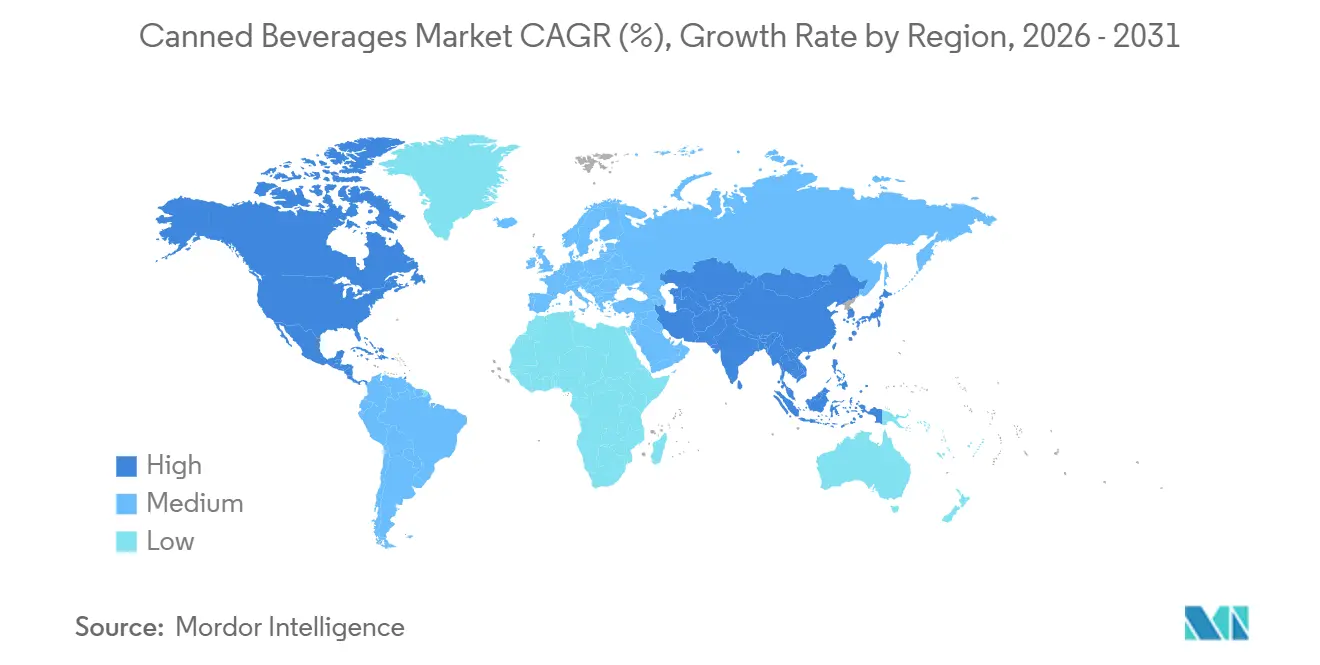
| Fastest Growing Market | Asia Pacific |
| Largest Market | North America |
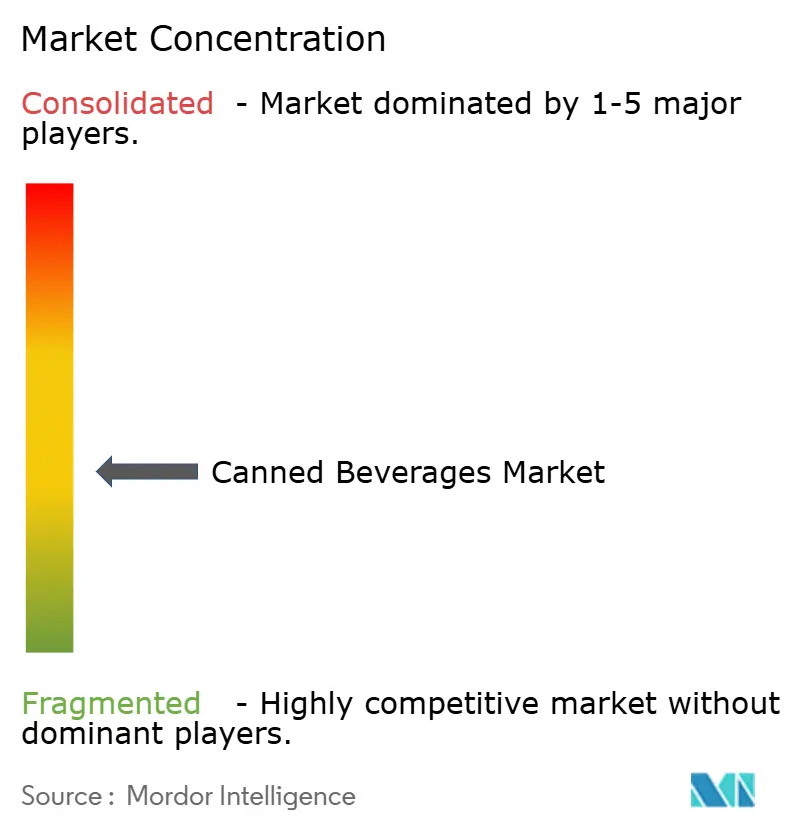
| Market Concentration | Medium |
Major Players
*Disclaimer: Major Players sorted in no particular order Image © Mordor Intelligence. Reuse requires attribution under CC BY 4.0. |
|
Canned Beverages Market Analysis by Mordor Intelligence
The canned beverages market size is expected to increase from USD 52.19 billion in 2025 and 55.16 billion in 2026 to USD 77.84 billion by 2031, growing at a CAGR of 7.13% over 2026-2031. This growth is attributed to the increasing demand for portable and shelf-stable beverage formats, the implementation of sustainability initiatives, and the introduction of a broader range of functional formulations. In Europe, aluminum's recycling rate stands at 76%, with 75% of all aluminum ever produced still in use.[3]Source: International Diabetes Federation, "Facts & figures", idf.org This highlights aluminum's significance as the preferred material for brands aiming to comply with Extended Producer Responsibility regulations. Advancements in digital can-printing technology, capable of producing 500 cans per minute, have facilitated small-lot premium graphics, previously limited to glass packaging. This development has accelerated SKU diversification and supported premium pricing strategies. However, fluctuating aluminum prices, ranging between USD 2,500 and USD 3,300 per tonne during 2024-2025, are exerting pressure on gross margins. Despite this, tight supply conditions have minimized the risk of material substitution.
Key Report Takeaways
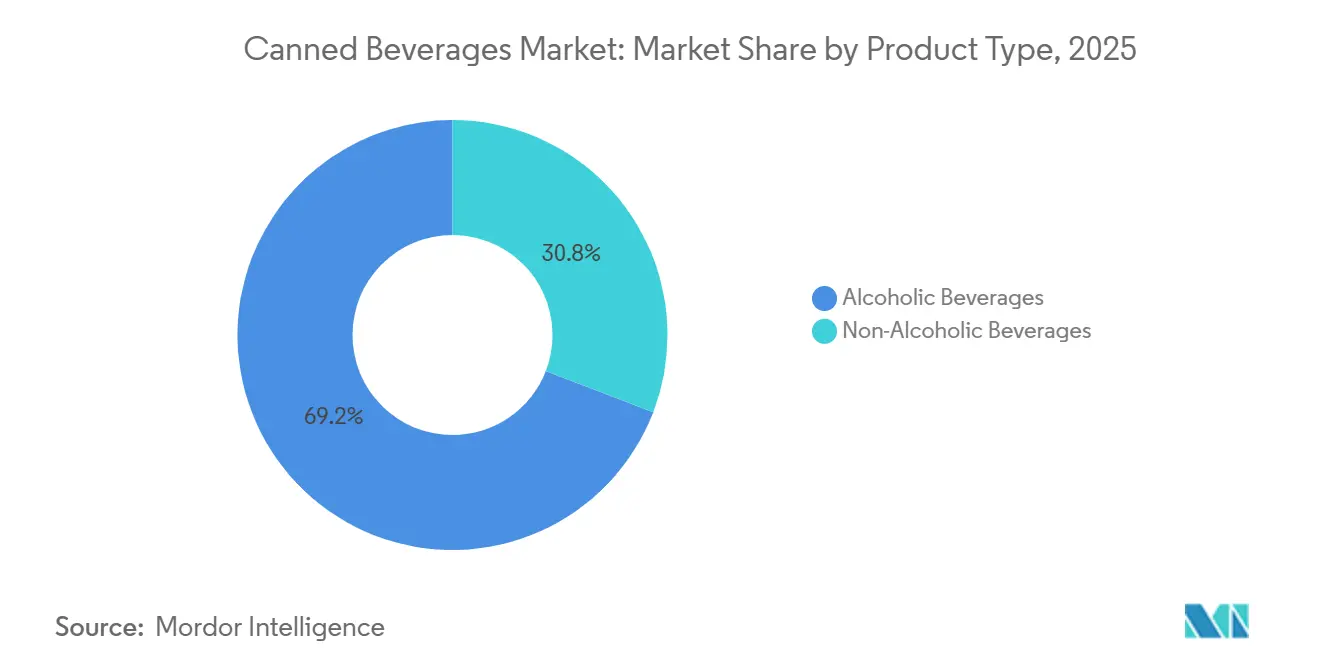
- By product type, alcoholic beverages commanded 69.16% of 2025 revenue, but non-alcoholic beverages are set to expand at an 8.56% CAGR during 2026-2031, led by energy drinks and ready-to-drink coffee.
- By can material, aluminum cans captured 71.29% share in 2025; steel/tinplate cans are projected to grow at 7.57% CAGR to 2031 as brewers in price-sensitive regions trade barrier performance for cost.
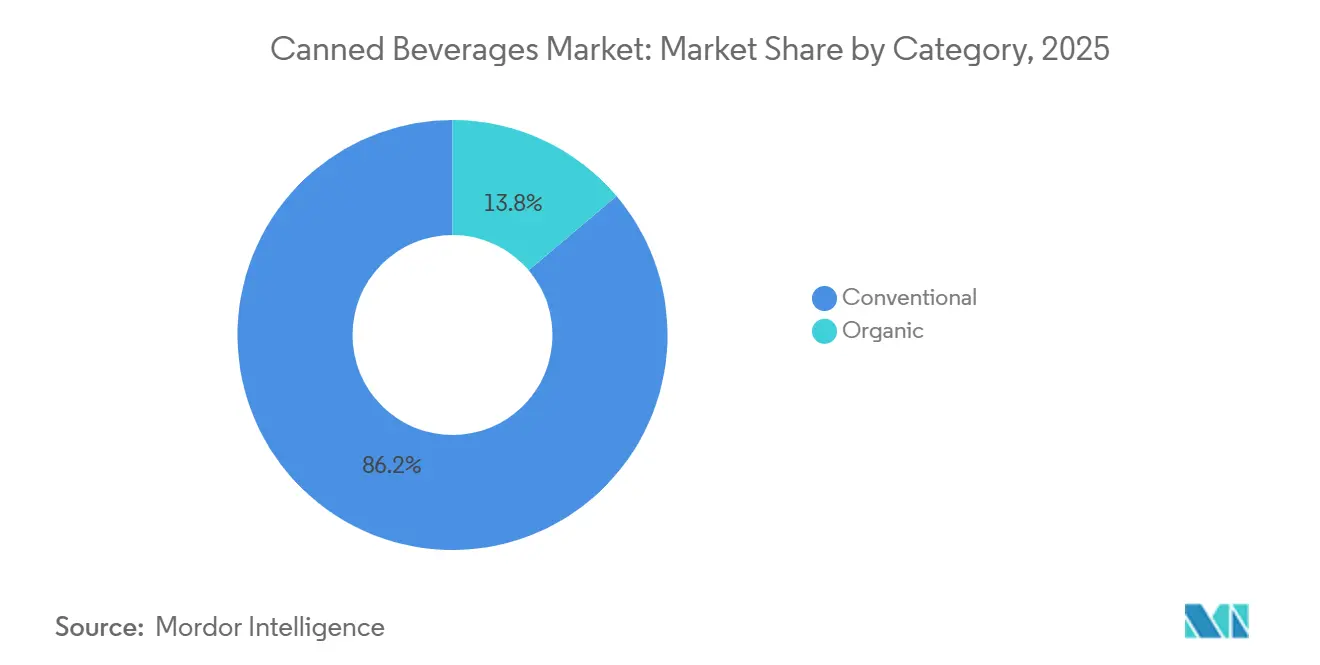
- By category, conventional beverages held 86.19% of the 2025 value, while organic beverages will register the fastest growth at 8.08% CAGR amid rising clean-label adoption in North America and Western Europe.
- By distribution channel, off-trade accounted for 65.20% of sales in 2025, yet on-trade venues will post a 7.37% CAGR through 2031 as hospitality restocking and premium draft alternatives rebound.
- By geography, North America retained 32.40% of global value in 2025; Asia-Pacific is forecast to advance at 7.81% CAGR over 2026-2031 on urbanization and localized flavor innovation.
Note: Market size and forecast figures in this report are generated using Mordor Intelligence’s proprietary estimation framework, updated with the latest available data and insights as of January 2026.
Global Canned Beverages Market Trends and Insights
Drivers Impact Analysis*
| Driver | (~) % Impact on CAGR Forecast | Geographic Relevance | Impact Timeline |
|---|---|---|---|
| Rising demand for ready-to-drink convenience beverages | +1.8% | Global, with peak adoption in North America and Asia-Pacific | Medium term (2-4 years) |
| Growth of functional and health-oriented beverages | +1.5% | North America, Europe, and Asia-Pacific urban centers | Long term (≥ 4 years) |
| Sustainability push favouring infinitely recyclable aluminum cans | +1.3% | Europe (regulatory lead), North America, spreading to Asia-Pacific | Long term (≥ 4 years) |
| Demand for low-calorie, organic, and natural ingredient beverages | +1.0% | North America, Western Europe | Medium term (2-4 years) |
| Premiumization across beverage categories | +0.9% | North America, Europe, Asia-Pacific affluent segments | Medium term (2-4 years) |
| Digital-printing and AI-driven mass customization unlocking hyper-targeted runs | +0.7% | Global, early adoption in North America and Europe | Short term (≤ 2 years) |
| Source: Mordor Intelligence | |||
Growth of functional and health-oriented beverages
The increasing demand for functional and health-oriented beverages is driving notable changes in the global canned beverages market, as consumers prioritize drinks that provide health benefits beyond basic hydration. In the United Kingdom, approximately 49% of consumers are projected to consume some form of functional beverage by 2025, with this figure rising to 62% among active individuals aged 18-44. Millennials and Gen Z are at the forefront of this trend, favoring products that align with their health-conscious lifestyles [1]. This demographic shows a strong preference for beverages enriched with vitamins, probiotics, and adaptogens, addressing wellness needs such as immune support, energy enhancement, and stress management. The demand for convenience further supports this trend, as consumers increasingly opt for ready-to-drink formats that suit their busy routines. Canned functional beverages, offering portability and ease of use, are well-suited to meet these preferences. Consequently, beverage manufacturers are focusing on innovation, introducing new formulations and premium ingredients such as plant-based proteins and botanical extracts to appeal to health-conscious consumers. The functional drinks market is anticipated to maintain robust growth, driven by younger generations' preference for health-focused, flavorful, and functional beverage options.
Sustainability push favouring infinitely recyclable aluminium cans
The increasing focus on sustainability is a significant driver in the global canned beverages market, with a growing preference for environmentally friendly packaging solutions such as aluminium cans. Aluminium's infinite recyclability positions it as a highly sustainable option for beverage packaging, meeting both regulatory requirements and consumer demand for eco-friendly products. This emphasis on sustainability has resulted in notable advancements in recycling rates across Europe. According to European Aluminium and Metal Packaging Europe, the recycling rate for aluminium beverage cans in the EU, UK, Switzerland, Norway, and Iceland reached 76.3% in 2023, marking a 7% year-on-year increase in recycling volumes [2]Source: European Aluminium, "Press Release: Aluminium Beverage Can Recycling Reaches a New Record as Industry Drives Toward 100% Circularity by 2050", european-aluminum.eu . This improvement not only promotes a circular economy but also helps reduce the carbon footprint associated with producing new materials. The steady growth in aluminium can recycling volumes and the circular use of materials are critical for achieving global sustainability objectives and enhancing resource efficiency. Both consumers and regulatory authorities are increasingly prioritizing packaging solutions that support a sustainable future.
Demand for low-calorie, organic, and natural ingredient beverages
The rising global prevalence of chronic health conditions, particularly diabetes, is driving the demand for low-calorie, organic, and natural ingredient beverages in the global canned beverages market. According to the International Diabetes Federation (IDF) Diabetes Atlas (2025), 11.1% of the adult population (aged 20-79) is living with diabetes. Projections indicate that by 2050, 1 in 8 adults, or 853 million people, will be affected, representing a 46% increase [3]. This significant rise in diabetes cases has increased awareness of the importance of healthy diets, prompting consumers to seek beverages that are lower in sugar, free from artificial additives, and made with natural ingredients. Consequently, the demand for low-calorie and organic beverage options has grown, with consumers favoring drinks that align with health-conscious preferences. Beverages made with natural sweeteners, plant-based ingredients, and minimal processing are gaining popularity as alternatives to traditional sugary sodas.
Premiumization across beverage categories
Premiumization across beverage categories is a significant driver of growth in the canned beverages market. The shift in consumer preferences toward high-quality, premium products has redefined the traditional "value" perception associated with canned beverages. Craft beer, single-origin spirits, and artisanal sodas have emerged as key examples, leveraging the can format to deliver premium offerings while enabling margin expansion. Similarly, canned wine has evolved to include estate bottlings with sustainable-vineyard certifications, appealing to environmentally conscious consumers and those seeking convenience, particularly at events such as festivals. Moreover, advancements in technology, such as AI-driven flavor mapping, have further supported premiumization by enabling global brewers to launch seasonal varieties three months faster than traditional researh and development processes. This capability allows companies to respond quickly to emerging flavor trends and secure a competitive advantage in niche markets. The impact of premiumization is most pronounced in North America and Europe, where per-capita consumption has plateaued, but higher revenue per unit reflects the growing consumer willingness to pay a premium for quality and innovation.
Restraints Impact Analysis*
| Restraint | (~) % Impact on CAGR Forecast | Geographic Relevance | Impact Timeline |
|---|---|---|---|
| Regulatory scrutiny on sugar and alcohol content (taxes, age limits) | -0.9% | Global, with acute pressure in the United Kingdom, Mexico, Jamaica, India | Medium term (2-4 years) |
| Volatile aluminum and steel prices squeezing producer margins | -0.7% | Global, most acute in regions reliant on imported metal | Short term (≤ 2 years) |
| Supply chain disruptions | -0.5% | Asia-Pacific, Middle East, select North American corridors | Short term (≤ 2 years) |
| Emerging fiber-based and reusable packs eroding the can's eco-advantage | -0.4% | Europe (pilot stage), North America (early trials) | Long term (≥ 4 years) |
| Source: Mordor Intelligence | |||
Regulatory scrutiny on sugar and alcohol content (taxes, age limits)
Regulatory scrutiny on sugar and alcohol content, including taxes and age restrictions, is emerging as a significant restraint in the canned beverages market. Governments are introducing fiscal policies and age-verification measures to limit sugar intake and alcohol consumption, which is directly affecting the volume growth of high-margin categories. These regulations are reducing demand for full-sugar carbonated soft drinks and high-ABV canned spirits, prompting manufacturers to shift towards zero-sugar and lower-alcohol alternatives that yield lower profit margins. Additionally, age-verification requirements for online alcohol sales are creating challenges for e-commerce channels, particularly in regions without digital-ID infrastructure. Compliance-related expenses, such as labeling updates, recipe reformulations, and legal reviews, are diverting resources away from innovation and capacity expansion, further constraining market growth.
Volatile aluminium and steel prices squeezing producer margins
Volatile aluminum and steel prices are restraining the growth of the canned beverages market by squeezing producer margins. Between 2024 and 2025, aluminum prices ranged from USD 2,500 to USD 3,300 per tonne, driven by China's production caps, rising energy costs, and geopolitical supply disruptions, according to the London Metal Exchange. Similarly, steel and tinplate prices experienced significant fluctuations, creating challenges for beverage companies without long-term hedging contracts or vertical integration into can manufacturing. Ball Corporation's sold-out status through 2026 highlights tight supply conditions, while also indicating that can manufacturers are passing raw material cost increases to beverage producers. Smaller brands, lacking the purchasing scale of larger competitors, face intensified margin pressures, limiting their ability to invest in marketing or expand distribution networks. Data from the Aluminum Association show that secondary (recycled) aluminum trades at a premium during periods of tight scrap availability, adding further instability to input costs. Additionally, currency fluctuations exacerbate risks for producers sourcing metal in U.S. dollars while selling beverages in emerging-market currencies.
*Our forecasts treat driver/restraint impacts as directional, not additive. The impact forecasts reflect baseline growth, mix effects, and variable interactions.
Segment Analysis
By Product Type: Non-Alcoholic Formats Outpace Mature Beer Segment
In 2025, alcoholic beverages represented the largest segment of the canned beverages market, comprising 69.19% of the total market share. Despite evolving consumer preferences, these beverages continue to dominate due to their extensive availability and established consumer loyalty. The segment's shift toward zero-sugar variants has played a crucial role in retaining its market position, appealing to health-conscious consumers while competing with emerging alternatives. However, challenges such as sugar levies in regions like Mexico could impact the segment's growth potential.
The non-alcoholic beverages segment is expected to be the fastest-growing category in the canned beverages market, with a projected CAGR of 8.56% during the forecast period. This growth is primarily fueled by the increasing demand for energy drinks and ready-to-drink coffee, particularly among Gen Z consumers who are moderating their alcohol intake. These products are progressively replacing traditional lager consumption occasions, reflecting a significant shift in consumer behavior and preferences.


By Can Material: Aluminum Dominance Challenged by Steel Cost Arbitrage
Aluminum remained the largest segment in the canned beverages market in 2025, accounting for a 71.29% share. This is primarily due to its lightweight design, excellent barrier properties, and well-established recycling infrastructure. Furthermore, European deposit-return schemes heavily favor aluminum, reinforcing its market dominance. However, rising prices, which have reached up to USD 3,300 per tonne, may create challenges in price-sensitive regions. Despite these concerns, aluminum's inherent advantages are expected to sustain its leading position in the market.
Steel/tinplate cans are expected to emerge as the fastest-growing segment in the canned beverages market, with a projected CAGR of 7.57% during the forecast period. Increasing aluminum prices are encouraging brewers in Southeast Asia and Latin America to consider steel as a cost-effective alternative. Although steel's heavier weight results in higher freight costs, its lower purchase price makes it a suitable choice for economy lagers, where price sensitivity is a key factor. Cost-conscious emerging markets are likely to adopt dual sourcing strategies, driving the growth of steel cans in the coming years.
By Category: Organic Beverages Gain Share Despite Premium Pricing
Conventional canned beverages accounted for the largest segment share of 86.19% in the canned beverages market in 2025, driven by their dominance in volume sales. These products continue to appeal to a broad consumer base due to their affordability and widespread availability. Efforts to enhance their appeal, such as the introduction of cleaner labels and zero-sugar varieties, have further solidified their position. Despite the growing interest in health-conscious alternatives, conventional beverages maintain a cost advantage, ensuring their stronghold in the market.
Organic canned beverages are projected to be the fastest-growing segment in the canned beverages market, with an anticipated CAGR of 8.08% during the forecast period. Their penetration is most notable in U.S. natural-food chains and German bio-supermarkets, while emerging markets like India and China are witnessing increased adoption due to rising health awareness among the middle class. This growth underscores the shifting consumer preference toward healthier and more sustainable options.
By Distribution Channel: On-Trade Recovery Lags E-Commerce Surge
Off-trade is anticipated to remained the largest segment in the canned beverages market in 2025, holding a substantial 65.20% market share. This segment's dominance is driven by its accessibility and convenience, appealing to consumers who prefer purchasing beverages from retail outlets. The established distribution networks and consistent demand for ready-to-drink options further bolster its position. Additionally, the segment benefits from offering a diverse range of products, including premium and specialty beverages, which continue to attract a wide consumer base seeking variety and quality for at-home consumption.
The on-trade segment is anticipated to be the fastest-growing category in the canned beverages market, with a projected growth rate of 7.37% from 2026 to 2031. This growth is driven by increasing consumer demand for convenient, ready-to-serve canned beverages in bars, restaurants, and other foodservice establishments. The rising preference for on-the-go options and unique, premium beverage experiences has boosted the popularity of ready-to-drink (RTD) alcoholic and non-alcoholic beverages in this segment. Additionally, the emphasis on convenience and the growing interest in novel and craft beverages in accessible formats are contributing to higher sales within the foodservice industry.
Geography Analysis
North America acounted for the largest segment in the canned beverages market in 2025, contributing 32.40% of the total revenue. This dominance is attributed to established consumption patterns and a well-developed cold-chain logistics infrastructure. In 2024, the United States aluminum beverage cans industry demonstrated strong production capacity, with the country manufacturing nearly 110 billion aluminum cans, accounting for approximately 30% of global packaging units. While per-capita consumption levels have plateaued, the market is witnessing a shift towards premium craft beers and functional beverages. However, the introduction of sugar-tax draft bills in several states and restrictions on energy-drink marketing are anticipated to pose minor challenges to growth.
The Asia-Pacific region is projected to be the fastest-growing segment, with a forecasted CAGR of 7.81%. Factors such as rapid urbanization, increasing disposable incomes, and advancements in localized flavor research and development in countries like China, India, and Thailand are driving this growth. In China, energy-reduction policies are tightening the domestic aluminum supply, leading to higher import dependency and increased marginal costs. Meanwhile, India is addressing certification challenges by investing in local can production, with beverage multinationals accelerating vendor qualification processes to meet rising demand.
Other regions are also contributing significantly to the canned beverages market. Europe, with a 76% aluminum recycling rate, continues to lead in sustainability and sets global standards. While volume growth remains stable, premiumization trends are driving revenue. In South America, beer and soda volumes are expanding at double-digit rates, with local players like Arca Continental adding can lines to capitalize on higher margins compared to returnable glass. The Middle East and Africa, though smaller in market size, are experiencing rapid growth due to a youthful population and increasing hospitality developments within the Gulf Cooperation Council.

Competitive Landscape
The canned beverages market exhibits moderate fragmentation, reflecting balanced competition between established multinational corporations and emerging regional players that leverage niche positioning and local market knowledge. Strategic consolidation is reshaping competitive dynamics, exemplified by Carlsberg's USD 4.2 billion acquisition of Britvic in January 2025, which creates synergies between beer and soft drink portfolios while strengthening relationships with key partners like PepsiCo. Major players such as AB InBev, The Coca-Cola Company, PepsiCo, Heineken N.V., and Monster Energy Company have a significant share in the canned beverages market. These established brands are continuously adapting to shifting consumer preferences by expanding their offerings into low-calorie beverages, functional drinks, and more sustainable packaging options.
At the same time, the market is witnessing the ascent of niche and craft beverage brands, which are capitalizing on the demand for unique flavors, organic ingredients, and functional additives such as probiotics and adaptogens. Start-ups and mid-sized firms are differentiating themselves through transparent sourcing, bold innovations, and direct engagement with younger, health-conscious consumers. Limited-edition packaging, collaborations with creatives, and a focus on storytelling have allowed these smaller brands to carve out loyal customer bases, particularly among millennials and Gen Z.
Sustainability has become a pivotal battleground in this competitive environment. With aluminum cans recognized for their high recyclability and eco-friendliness, beverage manufacturers are ramping up sustainability pledges and rolling out innovative packaging, such as lightweight or resealable cans, to reduce environmental impact. Digital marketing and e-commerce strategies are further intensifying competition, as brands deploy direct-to-consumer models and social media campaigns to enhance customer reach and foster brand loyalty. As a result, the canned beverages market is shaped by a dynamic interplay of scale, innovation, and eco-consciousness, ensuring ongoing differentiation and growth opportunities for both established and emerging players.
Canned Beverages Industry Leaders
-
AB InBev
-
The Coca-Cola Company
-
PepsiCo
-
Heineken N.V.
-
Monster Beverage Corporation
- *Disclaimer: Major Players sorted in no particular order

Recent Industry Developments
- March 2026: The Coca-Cola Company and the National Basketball Association (NBA) previously announced a global marketing partnership, reinstating Sprite as the league's Official Global Soft Drink Partner.
- March 2026: PepsiCo expanded its venue-partnership portfolio, securing exclusive beverage-supply agreements with various sports arenas and entertainment complexes throughout North America. These agreements emphasized the canned versions of Gatorade, Pepsi, and Mountain Dew, sidelining fountain dispensers. This shift underscored the growing consumer preference for portability and hygiene.
- October 2025: Diageo formed a joint venture with a local bottler in Nigeria to produce ready-to-drink spirits in aluminum cans, targeting urban consumers and hospitality venues. The partnership included technology transfer for can-filling lines and local sourcing of aluminum to mitigate import tariffs.


Global Canned Beverages Market Report Scope
| Alcoholic Beverages | Beer |
| Wine | |
| Spirits | |
| Others | |
| Non-Alcoholic Beverages | Carbonated Soft Drinks |
| Energy Drinks | |
| Sports Drinks | |
| Juices | |
| Ready-to-Drink Tea/Coffee | |
| Others |
| Aluminum Cans |
| Steel/Tinplate Cans |
| Conventional |
| Organic |
| On-Trade | |
| Off-Trade | Supermarkets/Hypermarkets |
| Convenience/Grocery Stores | |
| Online Retail Stores | |
| Other Distribution Channel |
| North America | United States |
| Canada | |
| Mexico | |
| Rest of North America | |
| Europe | United Kingdom |
| Germany | |
| France | |
| Italy | |
| Spain | |
| Sweden | |
| Belgium | |
| Poland | |
| Netherlands | |
| Rest of Europe | |
| Asia-Pacific | China |
| Japan | |
| India | |
| Thailand | |
| Singapore | |
| Indonesia | |
| South Korea | |
| Australia | |
| Rest of Asia-Pacific | |
| South America | Brazil |
| Argentina | |
| Colombia | |
| Chile | |
| Peru | |
| Rest of South America | |
| Middle East and Africa | United Arab Emirates |
| South Africa | |
| Saudi Arabia | |
| Nigeria | |
| Egypt | |
| Morocco | |
| Turkey | |
| Rest of Middle East and Africa |
| By Product Type | Alcoholic Beverages | Beer |
| Wine | ||
| Spirits | ||
| Others | ||
| Non-Alcoholic Beverages | Carbonated Soft Drinks | |
| Energy Drinks | ||
| Sports Drinks | ||
| Juices | ||
| Ready-to-Drink Tea/Coffee | ||
| Others | ||
| By Can Material | Aluminum Cans | |
| Steel/Tinplate Cans | ||
| By Category | Conventional | |
| Organic | ||
| By Distribution Channel | On-Trade | |
| Off-Trade | Supermarkets/Hypermarkets | |
| Convenience/Grocery Stores | ||
| Online Retail Stores | ||
| Other Distribution Channel | ||
| By Geography | North America | United States |
| Canada | ||
| Mexico | ||
| Rest of North America | ||
| Europe | United Kingdom | |
| Germany | ||
| France | ||
| Italy | ||
| Spain | ||
| Sweden | ||
| Belgium | ||
| Poland | ||
| Netherlands | ||
| Rest of Europe | ||
| Asia-Pacific | China | |
| Japan | ||
| India | ||
| Thailand | ||
| Singapore | ||
| Indonesia | ||
| South Korea | ||
| Australia | ||
| Rest of Asia-Pacific | ||
| South America | Brazil | |
| Argentina | ||
| Colombia | ||
| Chile | ||
| Peru | ||
| Rest of South America | ||
| Middle East and Africa | United Arab Emirates | |
| South Africa | ||
| Saudi Arabia | ||
| Nigeria | ||
| Egypt | ||
| Morocco | ||
| Turkey | ||
| Rest of Middle East and Africa | ||


Key Questions Answered in the Report
What is the projected value of the canned beverages market by 2031?
The market is forecast to reach USD 77.84 billion by 2031, reflecting a 7.13% CAGR during 2026–2031.
Which region is expected to grow the fastest in the canned beverages market?
Asia-Pacific, supported by urbanization and rising disposable incomes, is set to expand at a 7.81% CAGR through 2031.
How are health trends influencing product development?
Demand for low-calorie, organic, and natural ingredient beverages is fostering zero-sugar energy drinks, organic sparkling teas, and non-alcoholic beers with functional benefits.
How concentrated is competition in the canned beverages industry?
The market scores indicate moderate fragmentation where leading multinationals coexist with agile regional challengers.
Page last updated on:


