
Market Overview
| Study Period | 2021 - 2031 |
|---|---|
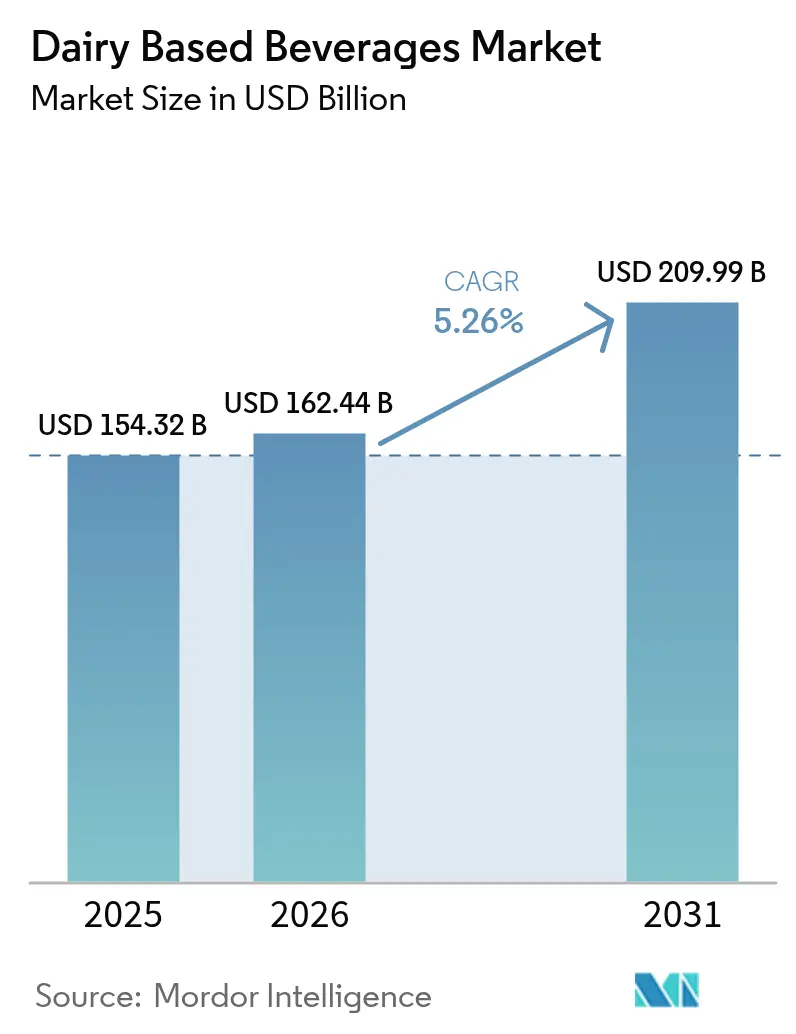
| Market Size (2026) | USD 162.44 Billion |
| Market Size (2031) | USD 209.99 Billion |
| Growth Rate (2026 - 2031) | 5.26 % |
| Fastest Growing Market | Middle East and Africa |
| Largest Market | Asia Pacific |
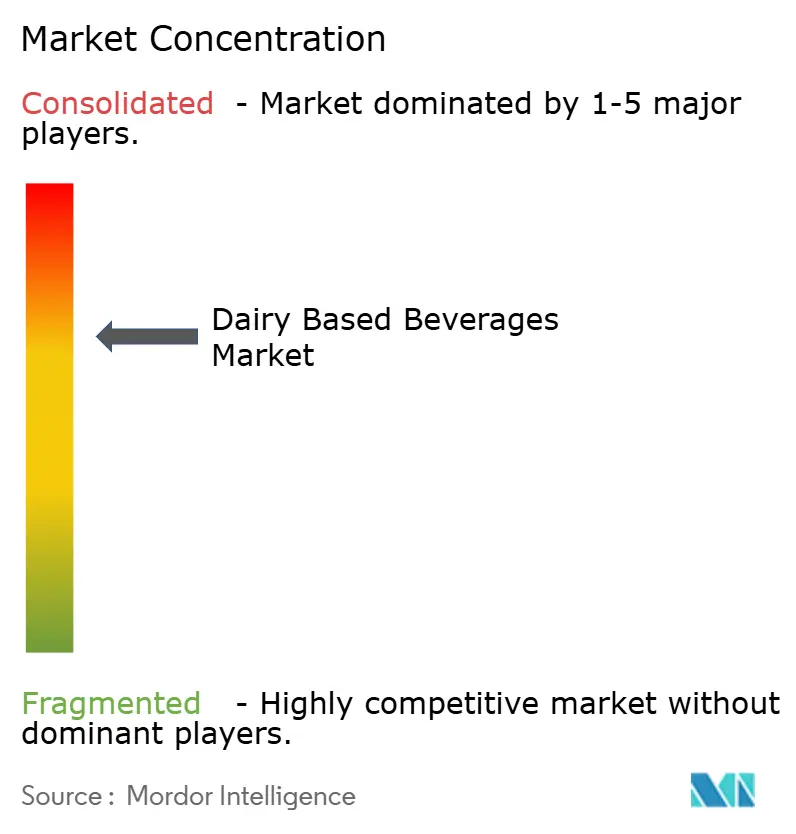
| Market Concentration | Medium |
Major Players
*Disclaimer: Major Players sorted in no particular order Image © Mordor Intelligence. Reuse requires attribution under CC BY 4.0. |
|
Dairy Based Beverages Market Analysis by Mordor Intelligence
The dairy-based beverages market size is expected to grow from USD 154.32 billion in 2025 to USD 162.44 billion in 2026 and is forecast to reach USD 209.99 billion by 2031 at 5.26% CAGR over 2026-2031. The market growth stems from consumer demand for nutritious beverages combining functional benefits with taste appeal. Urban millennials' consumption patterns have transformed protein-enriched, probiotic, and clean-label products from specialized offerings into mainstream market segments. Dairy beverages retain a significant market share despite plant-based competition, primarily due to established taste preferences and nutritional content that aligns with balanced dietary requirements. Market expansion in Asia-Pacific, and Middle East and Africa continues through increased consumer purchasing power and enhanced cold-chain logistics infrastructure, enabling broader distribution of both chilled and shelf-stable dairy products. The competitive environment comprises global corporations, regional cooperatives, and technology-focused startups, with firms investing in product development, sustainability initiatives, and direct distribution channels to address consumer requirements. Market performance depends on companies' operational flexibility in responding to evolving consumer preferences.
Key Report Takeaways
- By product type, yogurt drinks led with 23.72% of the dairy beverages market share in 2025, while kefir and other fermented drinks are forecast to expand at a 6.36% CAGR through 2031.
- By fat content, the whole/fat segment commanded 50.05% share of the dairy beverages market size in 2025; low-fat variants are set to grow at a 5.42% CAGR between 2026 and 2031.
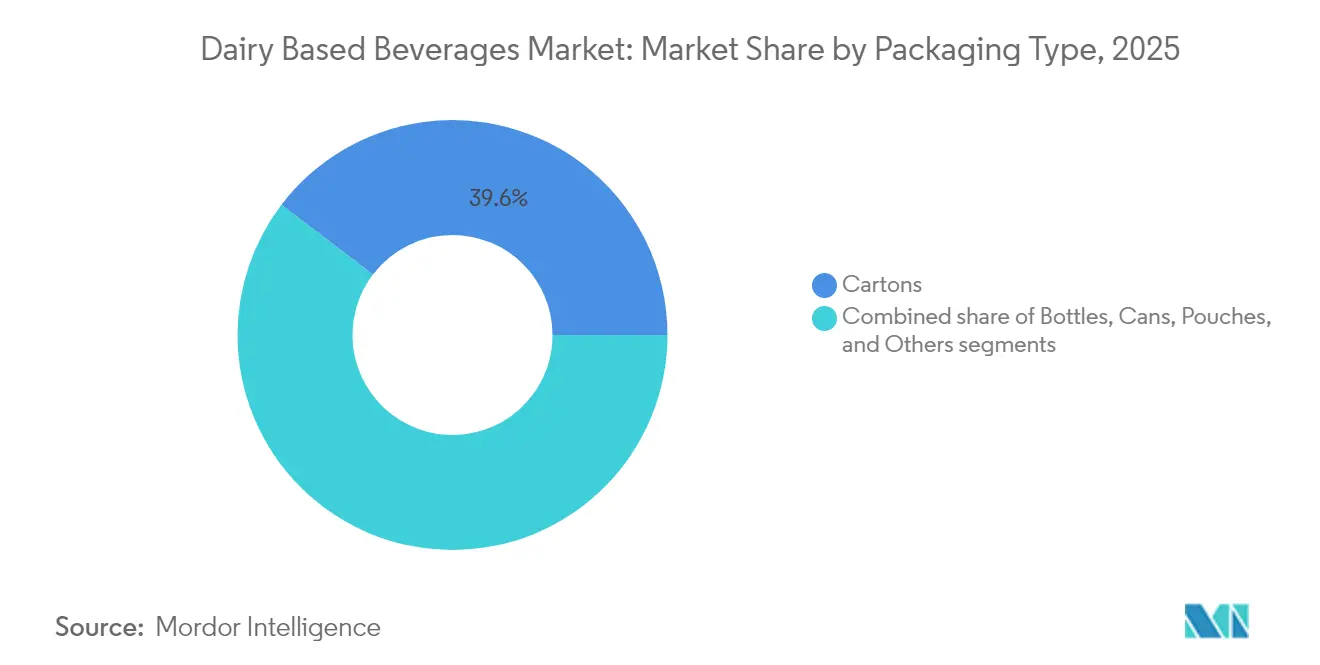
- By packaging type, cartons accounted for 39.64% of the dairy beverages market size in 2025, whereas pouches post the highest projected CAGR at 6.39% for the forecast period.
- By distribution channel, off-trade held 65.12% share of the dairy beverages market in 2025; on-trade is advancing at a rapid 7.05% CAGR to 2031.
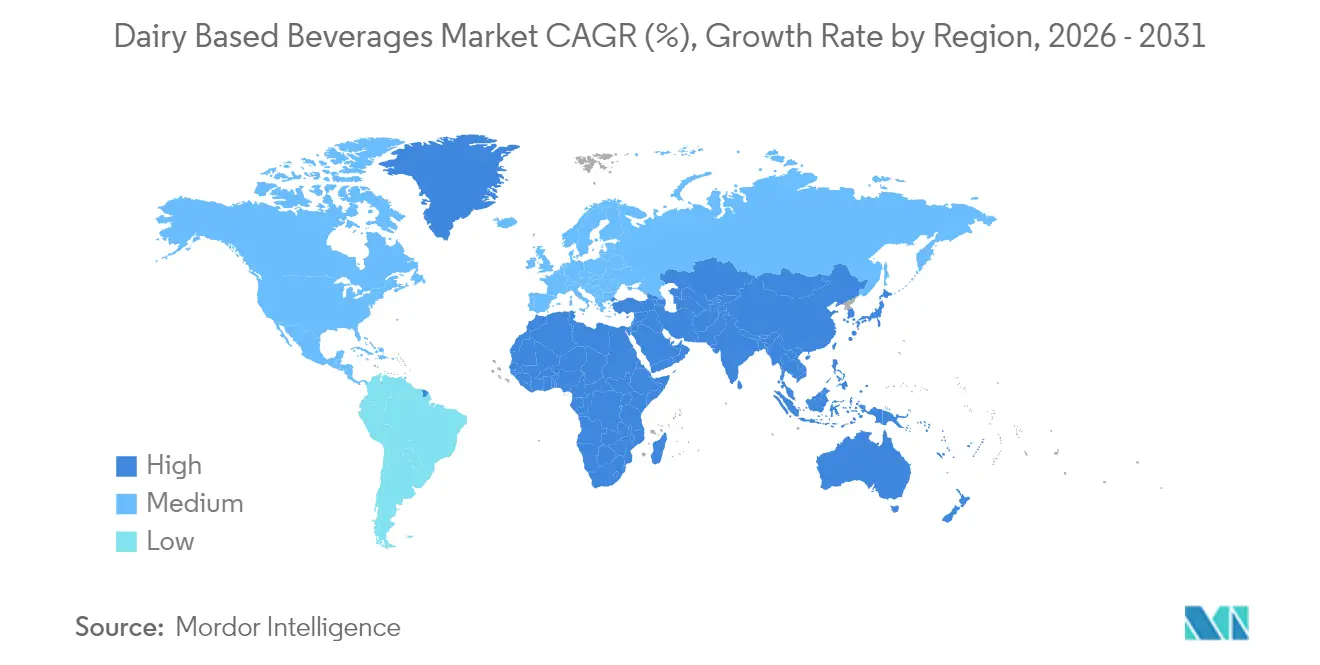
- By geography, Asia-Pacific captured a dominant 35.18% of the dairy beverages market share in 2025, while the Middle East and Africa are on track to register the fastest 7.09% CAGR through 2031.
Note: Market size and forecast figures in this report are generated using Mordor Intelligence’s proprietary estimation framework, updated with the latest available data and insights as of 2026.
Market Trends and Insights
Drivers Impact Analysis of Dairy Based Beverages Market*
| Driver | (~) % Impact on CAGR Forecast | Geographic Relevance | Impact Timeline |
|---|---|---|---|
| Growing demand for high-protein functional drinks among millennials | +0.8% | Global, North America, Europe, and Asia-Pacific | Medium term (2–4 years) |
| Growth in foodservice and café culture | +0.6% | Europe and North America | Short term (≤ 2 years) |
| Cold-chain expansion enabling ambient yogurt drinks | +0.5% | Asia-Pacific and Middle East and Africa | Long term (≥ 4 years) |
| Premiumization driving artisan kefir and cultured smoothies | +0.4% | North America and Europe | Medium term (2–4 years) |
| Rising awareness of gut health fuels demand for probiotic dairy drinks | +0.6% | Global, North America, Europe, Asia-Pacific, and South America | Medium term (2–4 years) |
| Innovation in packaging enhances consumer convenience | +0.4% | Europe and North America | Short term (≤ 2 years) |
| Source: Mordor Intelligence | |||
Growing demand for high-protein functional drinks among millennials
The protein-rich dairy beverages segment is experiencing substantial growth, driven by millennials and Gen Z consumers who increasingly regard protein as a vital nutritional component. This demographic shift is transforming the global functional beverage market. Protein is widely acknowledged for its role in muscle development, weight management, satiety, and overall wellness. With a growing emphasis on fitness, consumers are seeking nutrient-dense beverages that deliver both refreshment and functional benefits, which dairy-based protein drinks effectively provide. According to Sport England, participation in sports and physical activities among adults in England reached 30 million weekly participants during 2023-2024, demonstrating an increase of 2.4 million individuals [1]Source: Sport England, " Record numbers playing sport and taking part in physical activity", sportengland.org . This trend has expanded beyond traditional sports nutrition, as consumers actively integrate protein into their daily diets. In response, key industry players are introducing strategic innovations. For instance, in May 2025, Oikos expanded its product portfolio with shelf-stable protein shakes, marking its first venture beyond dairy products. The new protein shakes contained 30g of complete protein to support muscle strength and satiety, along with 5g of prebiotic fiber for digestive health. The product contained no artificial sweeteners.
Growth in foodservice and café culture
As coffee houses and specialty cafés continue to expand, they are driving a notable increase in dairy consumption within beverages, thereby strengthening the interconnection between the coffee and dairy sectors. According to the Ministry of Health, Labour and Welfare of Japan, the number of licensed coffee shops in the country reached 47,530 in 2024 [2]Source: Ministry of Health, Labour and Welfare of Japan, "Report on public health administration - food hygiene FY 2023" e-stat.go.jp . This trend is particularly evident in the quick service restaurant (QSR) market, where the growing demand for specialty coffee beverages has significantly elevated the use of dairy, establishing milk-based drinks as essential offerings on café menus worldwide. Moreover, the increased trend of urban consumers socializing and working in cafés drove the demand for milk-based beverages, including lattes, frappés, and specialty flavored milk drinks. Foodservice chains and quick-service restaurants expanded their dairy beverage offerings to cater to younger consumers who sought trendy options. This trend was particularly evident in metropolitan areas, where café culture aligned with lifestyle preferences and convenience. Starbucks and Costa Coffee played a significant role in popularizing cold brew with milk, flavored lattes, and dairy-based specialty beverages worldwide.
Cold-chain expansion enabling ambient yogurt drinks
Cold chain logistics are playing a transformative role in the dairy beverage market, particularly fueling the growth of ambient yogurt drinks that do not require refrigeration. This innovative solution, first introduced in China, has rapidly gained global momentum by addressing the inefficiencies and challenges associated with traditional cold chain systems, especially in emerging markets where infrastructure constraints are more pronounced. Companies like Rivigo are leading this transformation by implementing advanced technologies and operational models that ensure precise temperature control and significantly enhance supply chain efficiency. For example, Rivigo's driver relay model has successfully reduced the transit time between Mumbai and Guwahati from the typical 10-12 days to just four days. This reduction in transit time allows manufacturers to respond swiftly and effectively to dynamic market demand, ensuring better product availability and quality. Furthermore, the continuous expansion of cold-chain infrastructure is emerging as a pivotal factor in driving the growth and sales of yogurt drinks, enabling the industry to meet evolving consumer preferences and market requirements.
Premiumization driving artisan kefir and cultured smoothies
Kefir and cultured smoothies are experiencing a transformative shift, evolving from niche products to widely accepted mainstream options. This transition is being driven by the premiumization trend within the dairy beverages market, which emphasizes high-quality and value-added offerings. Kefir sales have exhibited substantial growth, primarily attributed to increasing consumer awareness of its functional health benefits. These benefits are particularly centered around its probiotic properties, which play a crucial role in supporting gut health and enhancing immune system functionality. Furthermore, ongoing scientific research continues to validate the potential of this category, emphasizing kefir's unique microbial composition and its associated health advantages, such as improved digestion and better lactose tolerance. The convergence of rising consumer demand, scientific backing, and strong market performance is solidifying artisanal cultured dairy beverages as a dynamic and rapidly expanding high-growth segment within the broader dairy market.
Restraints Impact Analysis of Dairy Based Beverages Market*
| Restraint | (~) % Impact on CAGR Forecast | Geographic Relevance | Impact Timeline |
|---|---|---|---|
| Rise of plant-based alternatives cannibalizing dairy shelf space | -0.7% | North America and Europe | Short term (≤ 2 years) |
| Farm-gate milk price volatility squeezing processor margins | -0.5% | Global, North America, Europe, and Asia-Pacific | Long term (≥ 4 years) |
| Shelf life and cold chain limitations | -0.4% | Global, Asia-Pacific, Middle East and Africa, and South America | Short term (≤ 2 years) |
| Increasing consumer concerns over lactose intolerance and dairy allergies are further restraining market growth. | -0.6% | Global, North America, Europe, and Asia-Pacific | Long term (≥ 4 years) |
| Source: Mordor Intelligence | |||
Rise of plant-based alternatives cannibalizing dairy shelf space
Traditional dairy beverages are increasingly encountering significant competitive pressure from the expanding plant-based milk sector. Globally, products such as almond milk, oat milk, soy milk, and coconut milk are not only gaining widespread consumer acceptance but are also becoming essential components of modern diets. These plant-based beverages are now available in a wide range of flavors and are frequently fortified with nutrients or enriched with protein, positioning them as strong competitors to traditional dairy beverages. Marketed as "cleaner" and "healthier" alternatives, these products emphasize key benefits such as lower cholesterol levels and the absence of hormones and antibiotics, which resonate strongly with health-conscious consumers. However, it is crucial to recognize that price fluctuations tend to impact plant-based alternatives more acutely than traditional dairy products. This indicates that, despite their growing shelf presence and increasing popularity, plant-based beverages remain susceptible to economic pressures and continue to face challenges in overcoming consumer loyalty to the taste and nutritional benefits traditionally associated with dairy products.
Farm-gate milk price volatility squeezing processor margins
Dairy processors are increasingly grappling with significant margin pressures caused by the volatility of farm-gate milk prices. This persistent unpredictability poses challenges to their ability to formulate effective long-term planning and investment strategies. In 2023, the financial performance of major dairy companies reflected this volatility. FrieslandCampina reported a 7.1% decline in revenue, amounting to EUR 13.1 billion, primarily due to currency fluctuations and reduced consumer market demand. These financial challenges also impact strategic positioning. For example, Danone, despite outperforming some competitors, encountered significant obstacles. To address these pressures, dairy processors are adopting innovative business models. A prominent shift is the transition to direct-to-consumer (D2C) strategies, which bypass intermediaries, offering greater control over branding and customer engagement. This evolution in distribution models is a strategic response to margin constraints, enabling processors to capture higher value while strengthening direct relationships with consumers.
*Our forecasts treat driver/restraint impacts as directional, not additive. The impact forecasts reflect baseline growth, mix effects, and variable interactions.
Dairy Based Beverages Market Segment Analysis
By Product Type:
Fermented Drinks Outpace Traditional OptionsYogurt beverages held 23.72% of the dairy beverages market in 2025, driven by consumer demand for products containing live cultures. Yogurt drinks maintained their strong market position through diverse flavor offerings and their association with digestive health benefits. Their commercial momentum continues as processors introduce lactose-free versions to attract sensitive consumers. Parallel to this, kefir growth at a 6.36% CAGR outpaces the parent category, powered by medical studies linking its multispecies microbiota to gut-barrier integrity. Shelf-stable probiotic formats remove refrigeration barriers, supporting volume gains in emerging geographies where cold-chain coverage lags.
Kefir’s tangy flavour profile, once considered niche, is now normalised by crossover consumers seeking sour notes similar to kombucha. The product’s thicker mouthfeel enables meal-replacement positioning, creating incremental use occasions beyond refreshment. Innovation is accelerating: brands combine kefir with fruit purees, ancient grains, and plant-derived sweeteners, tapping flexitarian preferences while maintaining dairy provenance. Additionally, the dairy beverages market capitalises on these launches to defend probiotic mindshare against non-dairy ferments. As fermented SKUs proliferate, retailers allocate dedicated refrigeration bays, cementing their status as a core sub-category rather than a specialty aisle curiosity.




By Fat Content:
Whole/Fat Preferences Driving SegmentationIn 2025, whole-fat beverages accounted for 50.05% of the dairy market, reflecting a sustained preference for rich flavors and satiety. Millennials have emerged as key adopters of whole milk, challenging traditional dietary norms that previously stigmatized fats. Sensory evaluations indicate that consumers can readily detect reductions in fat content. These findings have driven manufacturers to prioritize maintaining creaminess while employing protein filtration and lactose hydrolysis to enhance nutritional value.
Meanwhile, low-fat products are projected to grow at a 5.42% CAGR by 2031, supported by advancements in stabilizers that restore texture lost during the skimming process. Innovations such as micro-filtered milk concentrate solids-not-fat are improving mouthfeel without increasing butterfat levels. The dairy beverages market addresses both ends of the fat spectrum, recognizing the diverse lifestyle preferences of consumers. By maintaining a balanced portfolio, companies can ensure market resilience, adapting to regulatory shifts that alternate between favoring low-fat guidelines and whole-food advocacy, thereby navigating ongoing nutritional debates effectively.
By Packaging Type:
Innovation Driving Convenience and SustainabilityIn 2025, cartons accounted for 39.64% of the dairy beverages market share, driven by their lightweight structure and strong integration into widely accepted recycling systems. Continuous advancements in material science have further enhanced their appeal, making them a preferred choice for sustainable packaging. The addition of resealable spouts has enabled cartons to penetrate the "on-the-go" consumption segment, a space traditionally dominated by PET bottles. This innovation has expanded the functionality of cartons while maintaining their environmental credibility, aligning with the growing consumer demand for eco-friendly solutions.
Pouches, on the other hand, are anticipated to witness the fastest growth, with a projected compound annual growth rate (CAGR) of 6.39%. This growth is fueled by their convenience and their ability to reduce material usage, which aligns with sustainability goals. Notable innovations, such as SIG’s dome-shaped carton bottle, combine the portability of traditional bottles with the recyclability of cartons, offering a unique value proposition. The dairy beverages market is further supported by the increasing adoption of eco-score labels by retailers. These labels encourage consumers to choose packaging with a lower carbon footprint, thereby driving the demand for renewable and sustainable material solutions.
By Distribution Channel:
Digital Transformation Reshaping Retail DynamicsThe off-trade channel held 65.12% market share of the dairy beverages market revenue in 2025. This position results from established retail distribution networks across supermarkets, hypermarkets, convenience stores, and online grocery platforms. Consumers purchase dairy drinks in bulk for household consumption, utilizing available packaging options from single-serve bottles to family packs. The off-trade segment maintains growth through extended shelf life (ESL) milk, flavored milk, and ready-to-drink (RTD) products. The expansion of e-commerce and quick-commerce grocery delivery services has increased market penetration and purchase frequency. Companies like Amul and Danone are expanding their digital presence and multi-pack product lines to address market demand.
Meanwhile, the on-trade channel demonstrates a projected CAGR of 7.05%, driven by the expansion of cafés, quick-service restaurants, and specialty beverage outlets. Dairy-based beverages, including frappés, milkshakes, and lattes, generate increased revenue as complementary food items and standalone purchases. Foodservice operators are diversifying their product portfolios with flavored dairy beverages and functional ingredients to address evolving consumer requirements. Market growth concentrates in urban regions, where the younger demographic demands customization and premium beverage options. Major operators such as Starbucks and Café Coffee Day have increased market penetration through cold coffee, flavored lattes, and seasonal dairy-based beverages, integrating conventional dairy products with modern café operations.
Geography Analysis
APAC Dairy Based Beverages Market
In 2025, Asia-Pacific holds a commanding 35.18% share of the global dairy beverages market, driven by population growth, rising incomes, and shifting consumption patterns. China and India are the primary contributors to this growth. In India, urbanization and increasing incomes support higher per capita milk consumption, highlighting the region's capacity for innovation. The rise in milk production enables the development of a diverse range of dairy beverages, including flavored milk, yogurt drinks, lassi, and chaas. According to the Ministry of Fisheries, Animal Husbandry and Dairying, India produced 239.3 million tons of milk in 2024 , ensuring a stable supply of raw materials to support large-scale processing and innovation.
MEA Dairy Based Beverages Market
The Middle East and Africa are positioned as the fastest-growing region for dairy beverages, with a projected CAGR of 7.09% from 2026 to 2031, presenting significant opportunities for market expansion. This growth is attributed to advancements in cold chain infrastructure and increasing disposable incomes across the continent. The region's dairy farming systems are undergoing transformation, characterized by trends such as the semi-intensification of production systems and the settlement of nomadic herders. However, challenges remain in milk purchasing and consumption patterns, particularly among low-income households. Despite these obstacles, with consumption levels below recommended standards, the region offers substantial growth potential as incomes rise and formal distribution channels expand.
Europe and North America Dairy Based Beverages Market
Europe and North America, while mature markets with established consumption patterns, continue to lead in innovation, particularly in premium and functional dairy beverages. North America maintains a leading market share, supported by growing demand for functional beverages. In Europe, significant growth opportunities exist, especially in hybrid dairy products that combine dairy and plant-based ingredients. This trend reflects the increasing number of flexitarian consumers seeking to incorporate more plant-based options while retaining dairy in their diets.

Regulatory Landscape
Regulation for dairy-based beverages centers on compositional identity, labeling, and food safety controls that vary by market but increasingly require tighter documentation and border checks for products of animal origin. In the United States, FDA standards of identity for milk and cream under 21 CFR Part 131 continue to anchor beverage-grade definitions. FDA also issued a July 2025 proposal (Federal Register) to revoke 18 outdated dairy standards of identity, indicating modernization that can affect how legacy sub-categories are managed and labeled.
Cross-border requirements are becoming more operationally specific. Vietnam promulgated Circular 09/2026/TT-BCT introducing QCVN 28:2026/BCT for fluid milk products, effective September 1, 2026, which pushes manufacturers and importers toward updated technical compliance. In the European Union, delegated amendments and updated border control rules for products of animal origin in 2026 increase the importance of correct CN/HS classification and supporting documentation for dairy and composite dairy beverages moving through EU entry points.
Value Chain Analysis
The dairy-based beverages value chain starts with raw milk production and on-farm quality management, followed by collection and chilling, processing (standardization, fermentation for yogurt and kefir, homogenization, and ESL or aseptic treatment where used), packaging, and distribution through refrigerated and ambient networks. Key participants include dairy farmers and cooperatives, processors and brand owners, ingredient suppliers (cultures, stabilizers, sweeteners, proteins), packaging providers (cartons, bottles, pouches), and logistics firms delivering temperature-controlled transport and traceability.
Cold-chain availability and energy costs remain key constraints, particularly for cultured drinks where live-culture viability and shelf life depend on time-temperature control, making logistics performance a differentiator in emerging markets. Industry collaboration is also expanding into upstream technology and side-stream valorization. Standing Ovation partnered with Tetra Pak (April 2025) to optimize equipment and process design for industrial-scale alternative casein production, and Milcobel partnered with NoPalm Ingredients (September 2025) to valorize whey permeate into sustainable ingredients via a Netherlands demo facility planned to start operations in 2026. These moves tie core dairy processing more closely to process innovation, byproduct upgrading, and packaging and distribution choices that protect quality while extending reach.
Competitive Landscape
The dairy beverages market exhibits moderate consolidation. Major players such as Nestle SA, Arla Foods amba, Danone SA, Almarai Company, and Fonterra Co-operative Group Limited hold significant positions in the dairy beverages market. Nestlé, leveraging its extensive global presence, effectively utilizes its procurement scale to mitigate the impact of input cost fluctuations. These industry leaders not only dominate in terms of market share but also set high standards in areas such as carbon footprint reporting, flavor innovation, and digital shopper engagement, thereby shaping the competitive landscape.
The dairy beverages market is experiencing structural changes driven by increased health consciousness and sustainability concerns among consumers. Market players achieving success demonstrate product innovation capabilities, effective value proposition communication, and diversified product portfolios that address consumer requirements. Companies are incorporating proteins, probiotics, and functional ingredients into dairy drinks to meet consumer demand for wellness products. The industry focus includes sustainable packaging implementation, ethical sourcing practices, and transparent product labeling to build consumer trust. Companies implementing nutritional benefits alongside sustainable practices gain market share opportunities.
Digitization of the supply chain has become a critical differentiator in the competitive landscape. For example, Rivigo’s relay-driver network has redefined logistics by reducing multi-day transportation times to less than 24 hours, ensuring the viability of probiotics by the time they reach retail shelves. Furthermore, the integration of IoT sensors for real-time temperature monitoring enables suppliers to take proactive measures to prevent spoilage. Retailers are increasingly prioritizing suppliers who can demonstrate cold-chain integrity through reliable data, rewarding those with robust logistics capabilities. This dynamic environment underscores a competitive dairy beverages market where multinational corporations, cooperatives, and technology-driven start-ups are all striving to achieve growth in volume, profitability, and sustainability.
Dairy Based Beverages Industry Leaders
-
Nestle SA
-
Arla Foods amba
-
Almarai Company
-
Danone SA
-
Fonterra Co-operative Group Limited
- *Disclaimer: Major Players sorted in no particular order
Dairy Based Beverages Market Companies Covered in this Report
- Nestle S.A.
- Arla Foods amba
- Danone S.A.
- China Mengniu Dairy Co. Ltd.
- Inner Mongolia Yili Industrial Group Co. Ltd.
- Lactalis Group
- Fonterra Co-operative Group Limited
- Morinaga Milk Industry Co., Ltd.
- Chobani LLC
- General Mills Inc.
- Yakult Honsha Co., Ltd.
- Yeo Valley Organic Limited
- National Agricultural Development Company (NADEC)
- Almarai Company
- Al Othman Holding
- Gujarat Cooperative Milk Marketing Federation
- Vinamilk
- Karnataka Cooperative Milk Producers' Federation Limited
- Clover Sonoma
- Lifeway Foods, Inc.

Market Opportunities and Future Outlook
Capacity additions and process investments are opening space for high-protein, fortified, and functional dairy beverages across both chilled and shelf-stable formats. In March 2026, Coca-Cola confirmed a USD 650 million expansion of Fairlife production capacity in Michigan, adding 245,000 square feet and two additional lines, which reinforces the scale-up pathway for premium, protein-forward dairy beverages. Similar investment activity in dairy processing and proteins supports product renovation across RTD dairy, cultured drinks, and dairy-based nutrition beverages, especially where processors can pair filtration and fortification with aseptic or ESL capabilities to improve distribution economics.
Open innovation and localized manufacturing programs are also widening the opportunity set beyond mature markets. Yili Group launched its Global Innovation Vanguard Initiative in Cambridge, UK (May 2026), focused on precision nutrition, functional ingredients, and sustainable packaging, which aligns with the market shift toward differentiated health propositions and improved pack formats. In emerging dairy markets, announced greenfield and expansion projects, including Pelwatte Dairy Industries Limiteds June 2026 investment in a liquid milk facility in Sri Lanka, add room for flavored milk and value-added dairy beverages that can benefit from modern retail and improving cold-chain access. Regional processors can also use these upgrades to defend dairy shelf space against plant-based alternatives through new benefit-led propositions.
Recent Industry Developments in Dairy Based Beverages Market
- June 2026: Danone announced the acquisition of Australia-based MADE Group and the remaining 49% stake in its fresh dairy joint venture with Saputo Dairy Australia. The acquisition broadens Danones access to health-focused beverage and nutrition positioning while consolidating control over local fresh dairy execution in a developed, brand-driven market.
- May 2026: Yili Group launched the Global Innovation Vanguard Initiative in Cambridge, UK, built around an open-access R&D framework spanning smart farming, precision nutrition, functional ingredients, and sustainable packaging. The program strengthens pipelines for functional dairy beverage renovation and accelerates partner-led development of differentiated formulations and packs.
- April 2025: Standing Ovation partnered with Tetra Pak to optimize equipment and process design for industrial-scale alternative casein production. This collaboration supports the development of non-animal and dairy-integrated ingredients, which improves supply-chain flexibility and product differentiation in future offerings.


Dairy Based Beverages Market Report Scope and Research Methodology
Market Definition and Coverage
For this study, the dairy-based beverages market covers ready-to-drink beverages where milk or milk-derived ingredients are a primary base, sold through retail and foodservice channels in value terms.
Scope exclusions: Plant-based drinks and fully non-dairy beverages are excluded even if they are sold next to dairy drinks in the same aisles.
Segments Covered in This Report
-
By Product Type
- Probiotic Milk
- Yogurt Drink
- Kefir and Other Fermented Dairy Drinks
- Others
-
By Fat Content
- Whole/Fat
- Low-fat
- Skimmed/Non-fat
-
By Packaging Type
- Cartons
- Bottles
- Pouches
- Cans
- Others
-
By Distribution Channel
-
Off-Trade
- Supermarkets/Hypermarkets
- Convenience Stores
- Specialty Stores
- Online Retail
- Others (Vending, Institutional)
- On-Trade
-
Off-Trade
-
By Geography
-
North America
- United States
- Canada
- Mexico
- Rest of North America
-
South America
- Brazil
- Argentina
- Colombia
- Peru
- Chile
- Rest of South America
-
Europe
- United Kingdom
- Germany
- France
- Italy
- Spain
- Netherlands
- Sweden
- Poland
- Belgium
- Rest of Europe
-
Middle East and Africa
- Saudi Arabia
- United Arab Emirates
- South Africa
- Nigeria
- Egypt
- Morocco
- Turkey
- Rest of Middle East and Africa
-
Asia-Pacific
- China
- India
- Japan
- South Korea
- Australia
- Indonesia
- Singapore
- Thailand
- Rest of Asia-Pacific
-
North America
Data Sources, Market Sizing, and Validation
Desk Research
We started by mapping the market using public, repeatable data points that link dairy beverages to real supply and consumption signals. Sources reviewed included government agriculture and dairy statistics (such as USDA and national agriculture ministries), FAOSTAT-style production series, and trade and tariff databases to understand import and export flows for dairy-based beverage categories.
To connect volume with value in a practical way, we also relied on company annual reports, investor presentations, and earnings commentary where beverage mixes and pricing changes are discussed. Trade association releases and reputable press were used to check shifts in packaging formats, distribution channel mix, and regulation-driven labeling or fortification trends. For cross-checking company exposure and long-term product pipeline context, a paid subscription for company financials and a patent database were used in a limited way. The sources mentioned here are illustrative only, and many other public references were reviewed for data collection, validation, and clarification.
Primary Interviews and Surveys
Next, we validated the desk findings through expert interviews and structured surveys with a spread of dairy beverage producers, packaging and ingredient participants, distributors, and retail-facing stakeholders. Respondent input was used to confirm which drink formats are counted as dairy-based beverages in practice, how pricing is moving by pack type, and how demand differs across APAC, EMEA, and the Americas, and then to close gaps where public data is too aggregated.
Distribution of primary research fieldwork respondents
| Company type | Respondent position | Region |
|---|---|---|
| Top tier: 26% | CXOs: 12% | APAC: 39% |
| Mid tier: 59% | Functional/Unit leaders: 32% | EMEA: 35% |
| Smaller Players: 15% | Managers: 56% | Americas: 26% |
Market-Sizing & Forecasting
Sizing begins with a top-down build where dairy production and trade data help reconstruct an addressable beverage pool, which is then filtered using consumption patterns and channel availability by region. Once that structure is set, we corroborate it with selective bottom-up approximations, such as sampled brand and channel price points multiplied by plausible volumes, followed by supplier and distributor checks that adjust the totals when the arithmetic does not match market reality.
Key model inputs include the direction of per capita dairy consumption, the split between plain milk and value-added drink formats, fermented drink adoption (such as yogurt drinks and kefir), packaging mix shifts (cartons, bottles, pouches, and cans), and retail versus on-trade share movements. Pricing is handled through a simple ASP ladder by region and pack type, and then stress-tested against primary feedback on promo intensity and inflation pass-through timing. Where country-level detail is thin, proxy ratios are used from similar markets and then corrected using interview-based sanity checks, and the main estimate is kept traceable to the same few drivers.
For forecasting, we rely on scenario analysis supported by short-series trend fitting on the largest variables, with assumptions for dairy input costs, consumer trading behavior, and distribution reach reviewed with industry participants. In years where disruptions are more likely, we run a conservative path and an upside path, and the final view is selected only after the implied volume and value growth lines up with what respondents describe in the market.
Data Validation & Update Cycle
Outputs are checked in multiple steps so the final numbers do not depend on one dataset or one assumption. We compare the totals against independent signals, such as dairy production changes, trade movement, and reported pricing trends, and then investigate any sharp jumps that do not have a clear market explanation.
Before sign-off, the model is reviewed by another analyst who focuses on variance checks across regions, channel splits, and year-to-year growth logic. If a key input moves materially or if an anomaly is found, follow-up calls are triggered to re-check assumptions, and the model is updated accordingly. Reports are refreshed annually, with interim updates when major events shift demand, supply, or pricing, and a final pre-delivery review is completed so clients receive the latest view.
Mordor Intelligence's Dairy Based Beverages Market Sizing Compared With Other Published Estimates
Published market sizes for dairy-based beverages can look far apart, even when they sound like they cover the same products, because definitions, year alignment, and value build-ups vary across studies. Differences also show up when one publisher reports a single-point value, while another reports a growth increment or a wider beverage universe that overlaps with dairy.
Plant-based drinks sit outside Mordor Intelligence's scope, and that one inclusion difference alone can widen totals in sources that treat dairy beverages as part of a broader ready-to-drink wellness beverage basket. Gaps also come from how ASPs are progressed (especially when pack sizes and promo cycles change), whether on-trade is fully counted, and whether currency conversion is done at a single-year rate or smoothed across the period, which can noticeably move global numbers.
Benchmark comparison
| Source | Market Size | Gaps in Research Methodology |
|---|---|---|
| Mordor Intelligence | USD 154.32 B (2025) | |
| Trade Publisher A | USD 157.50 B (2024) | Uses a different base year and may apply a broader product grouping by type, which can shift the counted beverage pool and the implied price mix. |
| Industry Report B | USD 82.50 B (2025) | Covers a differently defined dairy drinks universe and appears to apply a narrower scope and value capture logic, which can compress totals versus full retail plus foodservice coverage. |
The spread in the table is largely explained by what gets counted as a dairy beverage, how the starting year is selected, and how value is converted from volume and prices across regions. By keeping the scope tied to dairy-based ready-to-drink products and then validating key inputs like channel mix and pack-level pricing through primary checks, the final estimate stays transparent and easier to replicate.


Key Questions Answered in the Report
What is the current value of the dairy based beverages market?
The dairy based beverages market is valued at USD 162.44 billion in 2026.
How fast is the dairy beverages market expected to grow?
The market is forecast to expand at a 5.26% CAGR, reaching USD 209.99 billion by 2031.
Which region leads the dairy beverages market today?
Asia-Pacific holds the largest share at 35.18%, supported by rising incomes and urbanization.
Which product category is growing the quickest?
Kefir and related fermented drinks are projected to grow at an 6.36% CAGR, outpacing all other dairy beverage segments.
Page last updated on:


 Your data is secure and never sold or shared.


