Blockchain-Based Security Solutions Market Size and Share
Market Overview
| Study Period | 2019 - 2030 |
|---|---|
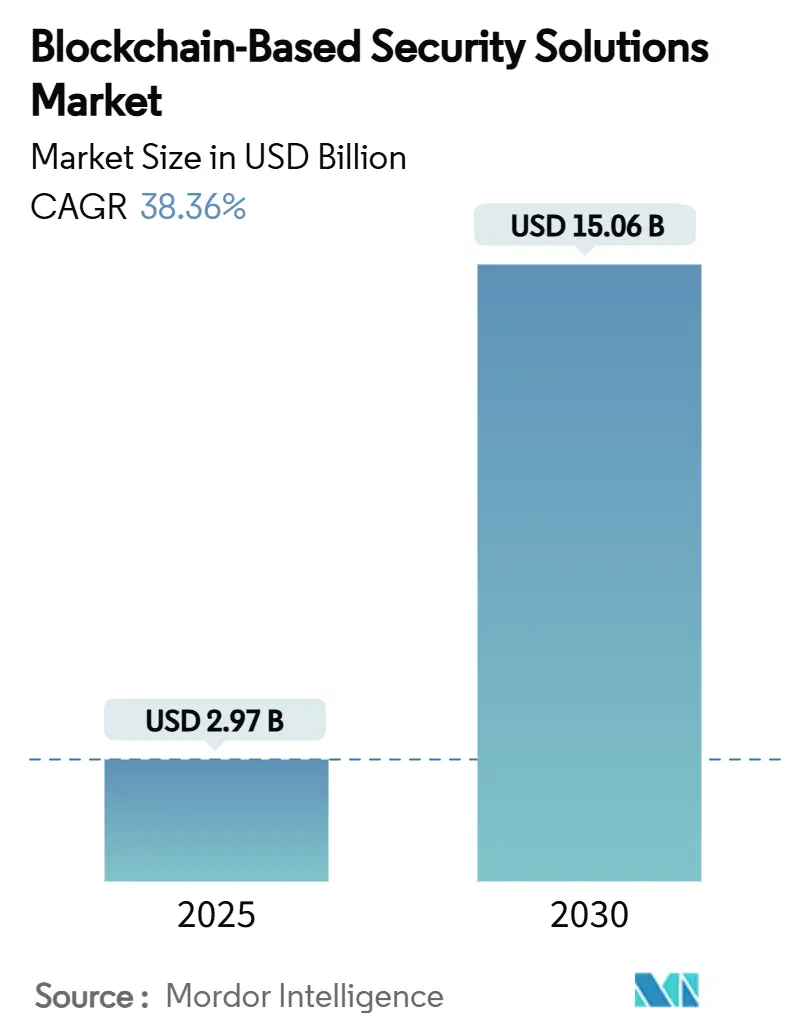
| Market Size (2025) | USD 2.97 Billion |
| Market Size (2030) | USD 15.06 Billion |
| Growth Rate (2025 - 2030) | 38.36% CAGR |
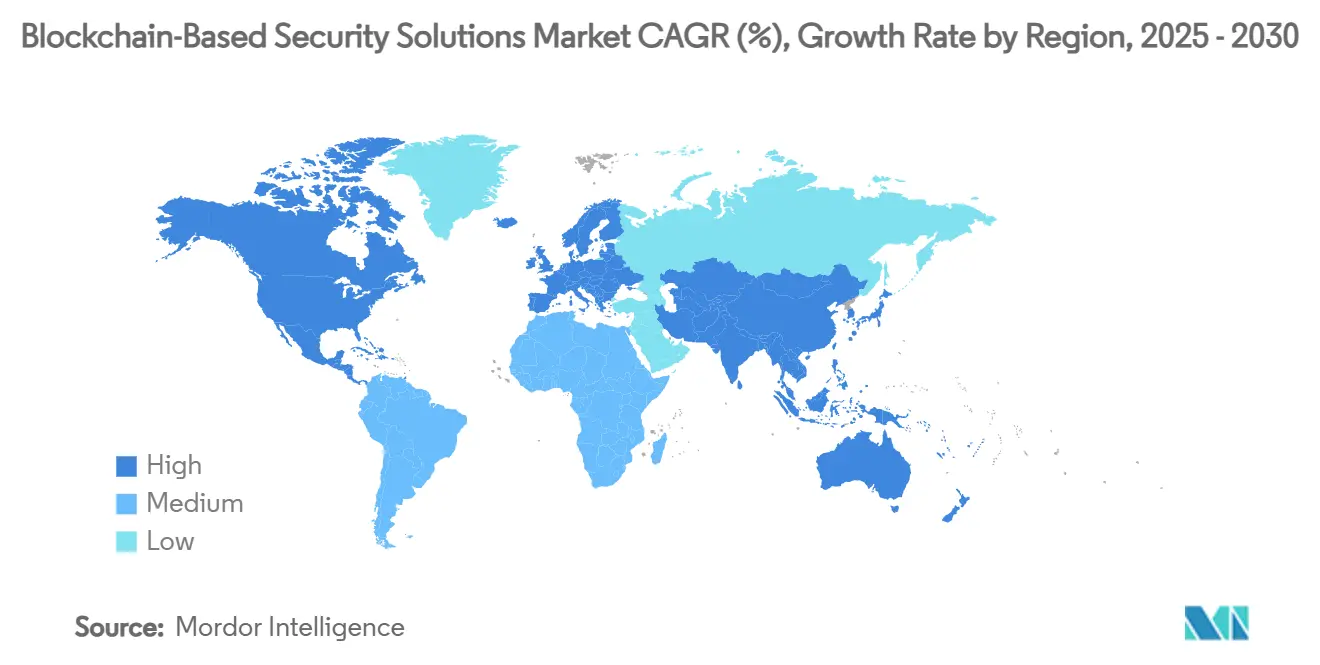
| Fastest Growing Market | Asia Pacific |
| Largest Market | North America |
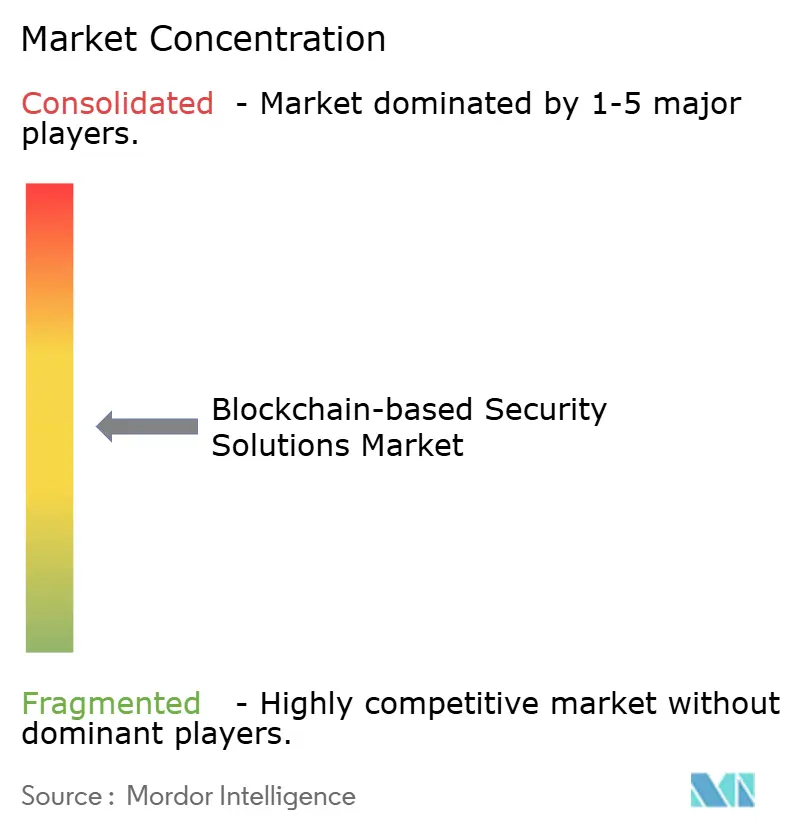
| Market Concentration | Medium |
Major Players
*Disclaimer: Major Players sorted in no particular order Image © Mordor Intelligence. Reuse requires attribution under CC BY 4.0. |
|
Blockchain-Based Security Solutions Market Analysis by Mordor Intelligence
The blockchain-based security solutions market size reached USD 2.97 billion in 2025 and is forecast to climb to USD 15.06 billion by 2030, reflecting a 38.32% CAGR over the period. The market’s rapid expansion is fuelled by the surge in enterprise migration toward Web3-native architectures, the rising frequency of smart-contract exploits, and tightening global regulations that demand tamper-proof audit trails. High-profile exploits totalling USD 2.36 billion across 760 incidents in 2024 underscored the limits of traditional perimeter defenses and accelerated spending on specialized auditing, threat-detection, and zero-knowledge proof (ZKP) middleware. Cloud-native deployment, ongoing tokenization of financial and real-world assets, and AI-driven vulnerability detection are further shaping growth opportunities. Heightened venture funding and national workforce programs targeting blockchain security skills gaps add momentum, but persistent cross-chain bridge vulnerabilities and talent shortages remain structural challenges.[1]CERTIK Research Team, “Hack3d: The Web3 Security Report 2024,” CertiK, certik.com
Key Report Takeaways
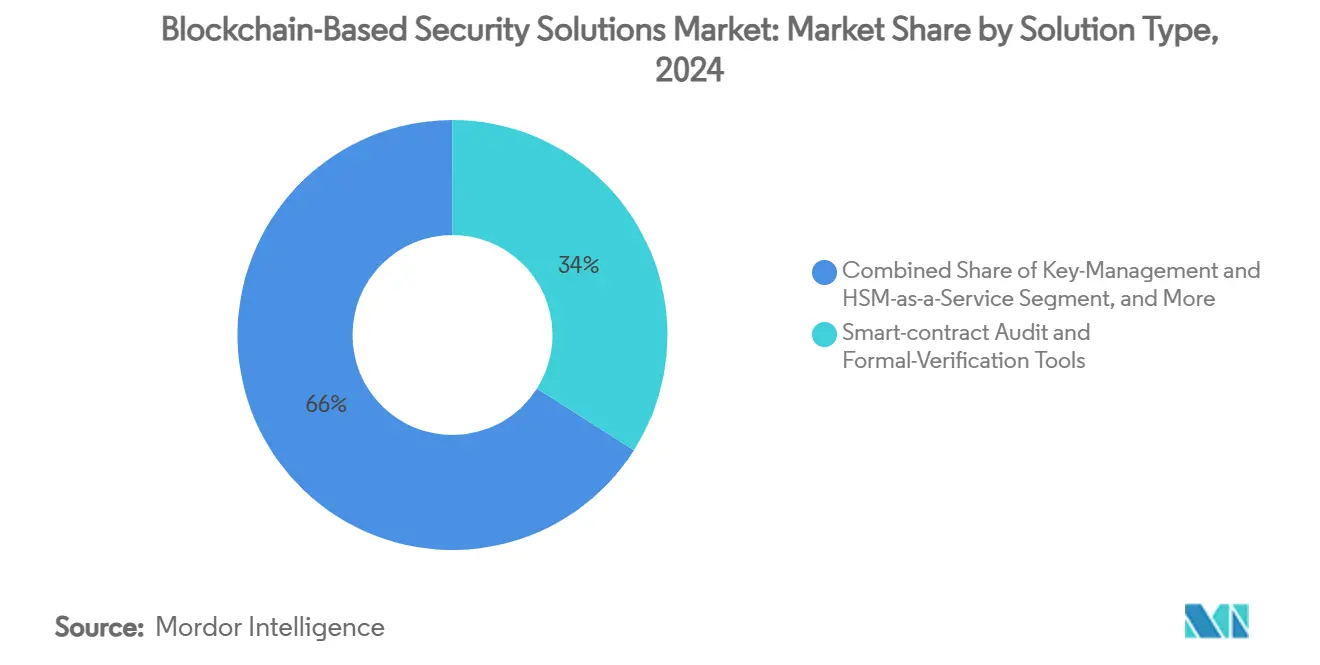
- By solution type, smart-contract audit tools led with 34% of the blockchain-based security solutions market share in 2024, while zero-knowledge proof middleware is projected to expand at a 42.01% CAGR through 2030.
- By deployment mode, cloud delivery held 52% share of the blockchain-based security solutions market size in 2024 and is advancing at a 43.11% CAGR through 2030.
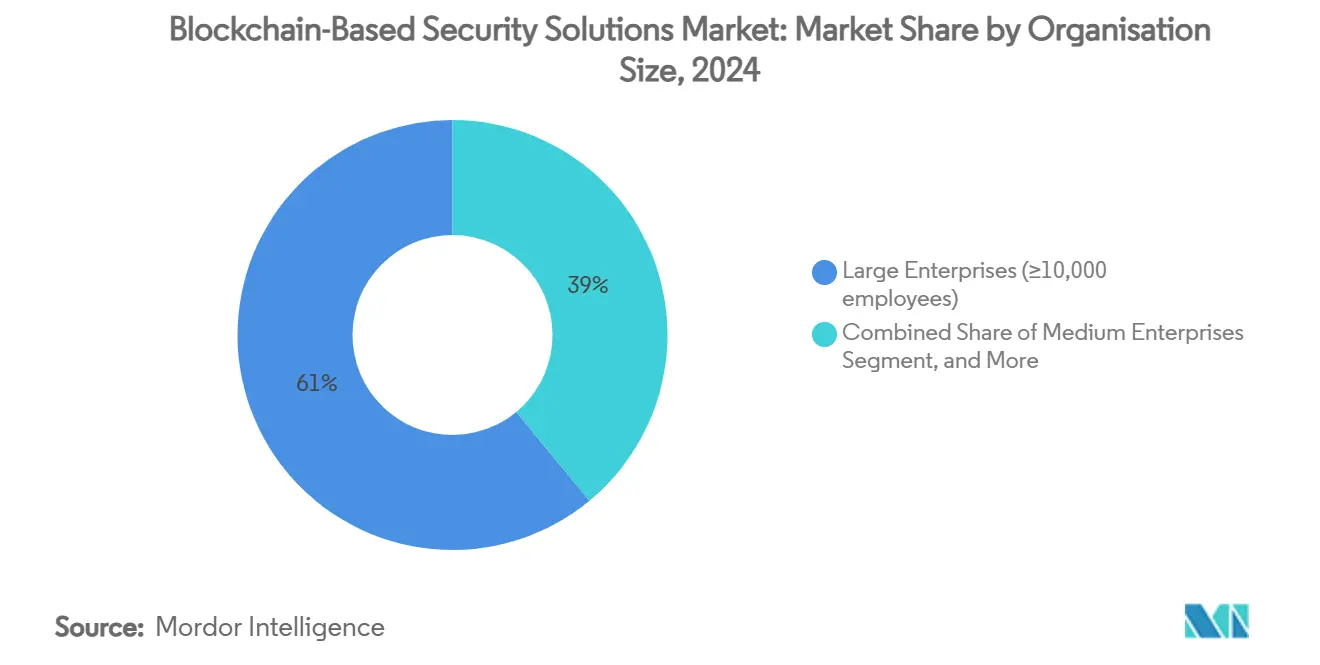
- By organization size, SMEs are set to register a 45.04% CAGR between 2025-2030, outpacing large enterprises in adoption of blockchain-based security solutions.
- By end-use industry, financial services accounted for 38% revenue share in 2024; supply chain and logistics is on track for a 44.84% CAGR to 2030.
- By geography, North America commanded 45% share of the blockchain-based security solutions market in 2024, whereas Asia-Pacific is forecast to grow at 46% CAGR through 2030.
Global Blockchain-Based Security Solutions Market Trends and Insights
Drivers Impact Analysis*
| Driver | (~) % Impact on CAGR Forecast | Geographic Relevance | Impact Timeline |
|---|---|---|---|
| Rapid enterprise move to Web3 native identity frameworks | +8.20% | Global, with early adoption in North America and EU | Medium term (2-4 years) |
| Escalating smart-contract exploits driving spend on auditing tools | +9.10% | Global, concentrated in DeFi-heavy regions | Short term (≤ 2 years) |
| Regulatory mandates for tamper-proof audit trails (e.g., EU DORA) | +7.80% | EU primary, spillover to North America and APAC | Medium term (2-4 years) |
| Integration of zero-knowledge proofs for privacy-preserving compliance | +6.40% | North America and EU, expanding to APAC | Long term (≥ 4 years) |
| Tokenisation of real-world assets creating new attack surfaces | +5.70% | Global, with concentration in financial hubs | Medium term (2-4 years) |
| Growing cyber-insurance premiums incentivising on-chain security controls | +4.30% | North America and EU primarily | Short term (≤ 2 years) |
| Source: Mordor Intelligence | |||
Rapid Enterprise Move to Web3-Native Identity Frameworks
Organizations are transitioning from centralized identity systems to self-sovereign identity (SSI) models that allow users to control verifiable credentials while keeping sensitive data off-chain. Financial institutions piloting the Customer Self-Sovereign Identity framework report faster loan approvals and lower fraud rates because verifiers can anchor consented data on immutable ledgers.[2]Iuon-Chang Lin, “A Self-Sovereign Identity Blockchain Framework for Access Control and Transparency in Financial Institutions,” MDPI, mdpi.com Projects such as Sovrin and uPort demonstrate broad adherence to open SSI standards, though interoperability gaps persist. Industry leaders highlight that successful tokenization hinges on digital identity verification able to withstand AI-generated deepfakes, elevating demand for blockchain-based security solutions market offerings that pair privacy with authenticity. Advances like EY Nightfall enable institutions to transact on public blockchains without exposing data, steering adoption toward public-private hybrid architectures. These trends collectively boost uptake of credential-verification, ZKP, and data-minimalization tools across the blockchain-based security solutions market.
Escalating Smart-Contract Exploits Driving Spend on Auditing Tools
Phishing, flash-loan attacks, and private-key compromises caused USD 2.36 billion in 2024 losses, intensifying enterprise focus on preventive code analysis and continuous monitoring. Auditors now deploy AI-supported frameworks such as VulnScan GPT, which combines large language models with vector databases to detect complex market-maker manipulation schemes that elude pattern-matching scanners. Specialized offerings like Quantstamp’s Economic Exploit Analysis target flash-loan vulnerabilities that accounted for 90% of stolen funds in July 2024. Post-upgrade audits of Uniswap V4 revealed double-withdrawal and tick-price-invariant bugs, proving the need for diverse auditor teams and formal verification to protect growing decentralized exchange volumes. Consequently, the blockchain-based security solutions market sees audit platforms evolving from periodic assessments to always-on security operations centers (SOCs) integrated with runtime threat detection.
Regulatory Mandates for Tamper-Proof Audit Trails
The EU Digital Operational Resilience Act, in force since January 2025, obliges financial entities to record immutable logs, perform threat-led penetration tests, and report incidents within strict deadlines. Fines can reach 1% of global daily turnover, prompting banks and fintech to invest in ledger-based audit modules with granular access control.[3]European Union, “Regulation (EU) 2022/2554 on Digital Operational Resilience,” EUR-Lex, eur-lex.europa.eu Hong Kong’s stable-coin code-auditing rules and MiCA licensing deadlines further harmonize security expectations across jurisdictions, spurring deployment of standardized blockchain evidence-management engines. These frameworks are influencing adoption patterns in North America and Asia-Pacific, where regulators reference DORA’s principles for their own rulemaking, deepening the blockchain-based security solutions market’s compliance-driven revenue streams.
Integration of Zero-Knowledge Proofs for Privacy-Preserving Compliance
Financial consortia increasingly test ZKP-enabled workflows that prove AML and KYC checks without disclosing personal data. JPMorgan’s Kinexys pilot combines ZKPs with fully homomorphic encryption so counterparties can validate asset eligibility, limits, and sanctions status while shielding identities. Academic demonstrations of Decker-ZKP Compliance Models show regulators can audit transactional risk in aggregate yet maintain customer confidentiality. Technology vendors now package off-the-shelf ZKP middleware to support selective disclosure, giving rise to the fastest-growing segment in the blockchain-based security solutions market. Early production rollouts in Europe and North America signal steady migration to privacy-first compliance architectures that remain performance-competitive with transparent chains.
Restraints Impact Analysis*
| Restraint | (~) % Impact on CAGR Forecast | Geographic Relevance | Impact Timeline |
|---|---|---|---|
| Persistent skills gap in blockchain security engineering | -6.80% | Global, acute in North America and EU | Long term (≥ 4 years) |
| Inter-chain interoperability weaknesses | -4.20% | Global, concentrated in multi-chain ecosystems | Medium term (2-4 years) |
| Regulatory uncertainty in key jurisdictions | -3.90% | Global, particularly US and emerging markets | Medium term (2-4 years) |
| High cost of continuous code audits for rapid release cycles | -2.70% | Global, acute for SMEs and DeFi protocols | Short term (≤ 2 years) |
| Source: Mordor Intelligence | |||
Persistent Skills Gap in Blockchain Security Engineering
Worldwide cybersecurity vacancies topped 450,000 in 2025, and Web3-specific roles outpaced supply three-to-one in the United States alone. Complexities spanning cryptography, consensus design, and evolving regulation leave traditional certification programs outdated. Although NIST disbursed USD 3.6 million to expand curricula, smaller firms still struggle to attract cryptographers and formal-methods specialists, delaying deployments or increasing reliance on managed-security vendors. Quantum-resistant design adds urgency; organizations must upgrade protocols well before widespread quantum computing arrives, yet few internal teams possess post-quantum expertise. The resulting talent bottleneck tempers the blockchain-based security solutions market’s ability to scale at the pace of demand.
Inter-Chain Interoperability Weaknesses
Bridges connecting heterogeneous blockchains accounted for a significant share of the USD 730 million lost to DeFi hacks in 2024. Attacks exploit smart-contract bugs, centralized validator sets, and oracle manipulation, propagating risk across ecosystems. Formal verification and multi-signature relayers improve robustness, but implementation remains inconsistent. Enterprises often restrict deployments to single chains or forgo cross-chain value transfer, narrowing project scope. Regulators note that systemic risks could undermine confidence in tokenized finance, prompting calls for common security baselines that remain nascent. Until hardened interoperability frameworks mature, this restraint will dampen the blockchain-based security solutions market growth trajectory, particularly for global supply-chain or multi-asset trading platforms.
*Our forecasts treat driver/restraint impacts as directional, not additive. The impact forecasts reflect baseline growth, mix effects, and variable interactions.
Segment Analysis
By Solution Type: Audit Tools Anchor Security Transformation
Smart-contract audit tooling captured 34% blockchain-based security solutions market share in 2024 as enterprises reacted to USD 2.36 billion in exploit losses. Vendors evolved offerings from static analysis to continuous pipelines feeding real-time threat detectors. The segment’s dominance persists because auditors provide the first line of defense against logic flaws and economic exploits. Meanwhile, zero-knowledge proof middleware logs the highest forecast expansion at 42.01% CAGR, driven by compliance, identity, and privacy mandates in regulated finance. Identity-management solutions leverage SSI standards to link off-chain credentials to on-chain attestations, while consensus-layer security tools harden proof-of-stake networks against slashing and long-range attacks.
Adoption patterns indicate convergence: leading audit platforms integrate formal verification engines, AI-based anomaly detection, and issuance of machine-readable compliance certificates. Quantstamp’s flash-loan analysis and VulnScan GPT’s price-manipulation detection illustrate specialization depths that differentiate platforms. As these toolsets merge into full-stack DevSecOps suites, buyers treat them as strategic investments to sustain trust in decentralized apps across the blockchain-based security solutions market.


By Deployment Mode: Cloud Dominance Accelerates Adoption
Cloud services held 52% share of the blockchain-based security solutions market in 2024 owing to rapid deployment, elastic scaling, and embedded compliance controls. Hyperscale providers bundle blockchain-optimized hardware security modules, AI accelerators, and managed SIEM feeds. This shift allows SMEs to bypass large capital outlays, propelling a 43.11% CAGR for cloud deployment through 2030. Hybrid architectures gain traction where data-residency rules apply; firms maintain on-premises nodes for sensitive workloads while offloading analytics to the cloud.
The cloud segment further benefits from native support for containerized ZKP circuits and serverless evidence vaults. IBM’s Prove AI merges blockchain audit logs with AI governance, illustrating cross-domain synergies that cloud simplifies. On-premises and hybrid modes retain footholds among critical-infrastructure operators and defense contractors that require air-gapped setups or specialized compliance attestations, but the overarching trend favours managed-service economics that extend the blockchain-based security solutions market reach.
By Organization Size: SMEs Democratize Security Access
Large enterprises controlled 61% revenue in 2024, leveraging early pilots and in-house cryptography teams. Yet SMEs post a 45.04% CAGR because cloud delivery, pre-configured policy templates, and subscription pricing lower entry barriers. Standardized implementation guides and self-service dashboards enable resource-constrained firms to meet regulator expectations without full-time security engineers.
Managed security service providers (MSSPs) capitalize by offering turnkey blockchain threat-monitoring, incident response, and code-audit bundles tailored for SMEs. Workforce programs funded by governments and industry groups further ease talent shortages by certifying developers in Solidity, formal verification, and Web3 incident handling. This democratization enlarges the addressable base of the blockchain-based security solutions market even outside traditional finance, supporting adoption across e-commerce, creative industries, and regional supply networks.
By End-Use Industry: Financial Services Lead While Supply Chain Accelerates
Financial institutions retained 38% share in 2024, compelled by DORA, MiCA, and parallel US initiatives to document ICT resilience and consumer protection. Projects such as Citi’s Integrated Digital Assets Platform and JPMorgan’s Kinexys spotlight institutional demand for immutable ledgers, ZKP privacy, and post-trade visibility. Banks also embed security attestations into tokenized deposit offerings, increasing cumulative wallet-security spending.
Supply chain and logistics records the fastest expansion at 44.84% CAGR as manufacturers and freight operators tokenize bills of lading and provenance certificates. Pilot studies in food safety proved that private blockchain deployments reached 207 tps with zero data-integrity discrepancies over 50 days. Self-sovereign identity modules connect suppliers, carriers, and customs, mitigating fraud and recall costs. Energy, healthcare, and public-sector projects advance steadily, adopting specialized threat models such as grid-node consensus hardening and patient-data ZKP protections, collectively broadening the blockchain-based security solutions market footprint.
Geography Analysis
North America commanded 45% of the blockchain-based security solutions market in 2024 as stringent SEC guidance, venture funding, and NIST workforce programs cultivated a mature ecosystem. Institutional investors back multi-layer security stacks, and insurers bundle premium discounts with audited smart-contract coverage. The region also pioneer’s quantum-resilient cryptography pilots, which are now baseline requirements for federal procurement, driving steady vendor revenue.
Asia-Pacific exhibits the highest forecast CAGR at 46% through 2030. Singapore’s enhanced Payment Services Act and Project Guardian foster clarity on tokenized assets, prompting banks and asset managers to integrate ZKP audit rails and multi-party computation wallets. Japan’s Financial Services Agency released guidelines on cross-chain stable-coin issuance that implicitly require bridge audits, spurring demand for interoperability security. Meanwhile, South Korea’s conglomerates adopt blockchain-secured carbon-credit exchanges, pairing environmental reporting with tamper-proof data integrity.
Europe maintains sizable adoption anchored by DORA and MiCA. Harmonized rules encourage cross-border service provision under a single passport, leading to pan-EU deployments of cloud-based security hubs. Governments invest in ZKP research under Horizon Europe, positioning regional vendors to influence global standards. Elsewhere, Latin America pilots land-registry tokenization, and Gulf Cooperation Council states pursue oil-trade settlement on private ledgers, both creating early-stage but rapidly growing demand segments within the global blockchain-based security solutions market.

Competitive Landscape
The market shows moderate fragmentation. Specialist audit firms such as CertiK and Quantstamp dominate exploit identification, while enterprise cybersecurity incumbents expand into blockchain offerings. Start-ups such as Blockaid use large language models to scan 2.4 billion transactions and block 71 million attacks for exchanges, demonstrating AI-led security capabilities.[4]Sheldon Reback, "Blockchain Security Firm Blockaid Raises USD 50 Million," CoinDesk, coindesk.com Investment rounds above USD 50 million signal investor confidence in real-time threat-intelligence platforms that operate across chains.
Strategic moves emphasize platform consolidation. Vendors integrate runtime monitoring, formal verification, and ZKP modules into single dashboards, easing procurement complexity. Partnerships between hardware security module suppliers and ledger-analytics providers address quantum-resistance and key-management. SEALSQ allocated USD 35 million to build a post-quantum semiconductor center, signalling vertical integration trends that embed cryptography at the silicon layer. Talent acquisition remains central; firms establish academies or acquire boutique auditors to secure scarce expertise. Overall, competition accelerates around cross-chain security protocols and SME-focused managed services that broaden the blockchain-based security solutions market reach.
Blockchain-Based Security Solutions Industry Leaders
-
IBM Corporation
-
Guardtime OÜ
-
Microsoft Corporation
-
CertiK Ltd.
-
Quantstamp Inc.
- *Disclaimer: Major Players sorted in no particular order

Recent Industry Developments
- July 2025: SEALSQ Corp boosted its Quantum Investment Fund to USD 35 million, allocating USD 12 million for a post-quantum semiconductor center in Spain and USD 10 million for quantum-secured satellite communications.
- July 2025: U.S. Bancorp executed its first fully digital trade-finance transaction via the WaveBL platform, shortening settlement from days to seconds.
- February 2025: Blockaid raised USD 50 million in Series B funding to expand real-time on-chain threat detection.
- January 2025: The EU Digital Operational Resilience Act entered into force, mandating robust ICT risk management for financial entities.


Global Blockchain-Based Security Solutions Market Report Scope
| Smart-contract Audit and Formal-Verification Tools |
| Identity and Access-Management Ledgers |
| Immutable Data-Integrity / Confidential Ledger Platforms |
| Key-Management and HSM-as-a-Service |
| Zero-Knowledge Proof / Privacy-Preserving Middleware |
| Blockchain Security-as-a-Service (Monitoring and SIEM Nodes) |
| Tokenisation Risk-Management Platforms |
| Threat-Intelligence and Incident-Response Orchestrators |
| Cloud (SaaS / PaaS) |
| On-Premises Licensed |
| Hybrid (Cloud + On-Prem) |
| Edge / Decentralised Node |
| Large Enterprises (Less than 10,000 employees) |
| Medium Enterprises (500-9,999 employees) |
| Small and Micro Enterprises (More Than 500 employees) |
| Government and Public-Sector Agencies |
| Financial Services and Insurance |
| Government and Public Sector |
| Healthcare and Life Sciences |
| Supply-Chain and Logistics |
| Manufacturing and Industrial IoT |
| Retail, eCommerce and Consumer Goods |
| Telecom, Media and Technology |
| Energy and Utilities |
| North America | United States |
| Canada | |
| Mexico | |
| South America | Brazil |
| Argentina | |
| Chile | |
| Rest of South America | |
| Europe | Germany |
| United Kingdom | |
| France | |
| Italy | |
| Spain | |
| Russia | |
| Rest of Europe | |
| Asia Pacific | China |
| Japan | |
| India | |
| South Korea | |
| Australia and New Zealand | |
| Rest of Asia Pacific | |
| Middle East | Saudi Arabia |
| United Arab Emirates | |
| Turkey | |
| Israel | |
| Qatar | |
| Rest of Middle East | |
| Africa | South Africa |
| Nigeria | |
| Kenya | |
| Egypt | |
| Rest of Africa |
| By Solution Type | Smart-contract Audit and Formal-Verification Tools | |
| Identity and Access-Management Ledgers | ||
| Immutable Data-Integrity / Confidential Ledger Platforms | ||
| Key-Management and HSM-as-a-Service | ||
| Zero-Knowledge Proof / Privacy-Preserving Middleware | ||
| Blockchain Security-as-a-Service (Monitoring and SIEM Nodes) | ||
| Tokenisation Risk-Management Platforms | ||
| Threat-Intelligence and Incident-Response Orchestrators | ||
| By Deployment Mode | Cloud (SaaS / PaaS) | |
| On-Premises Licensed | ||
| Hybrid (Cloud + On-Prem) | ||
| Edge / Decentralised Node | ||
| By Organisation Size | Large Enterprises (Less than 10,000 employees) | |
| Medium Enterprises (500-9,999 employees) | ||
| Small and Micro Enterprises (More Than 500 employees) | ||
| Government and Public-Sector Agencies | ||
| By End-use Industry | Financial Services and Insurance | |
| Government and Public Sector | ||
| Healthcare and Life Sciences | ||
| Supply-Chain and Logistics | ||
| Manufacturing and Industrial IoT | ||
| Retail, eCommerce and Consumer Goods | ||
| Telecom, Media and Technology | ||
| Energy and Utilities | ||
| By Geography | North America | United States |
| Canada | ||
| Mexico | ||
| South America | Brazil | |
| Argentina | ||
| Chile | ||
| Rest of South America | ||
| Europe | Germany | |
| United Kingdom | ||
| France | ||
| Italy | ||
| Spain | ||
| Russia | ||
| Rest of Europe | ||
| Asia Pacific | China | |
| Japan | ||
| India | ||
| South Korea | ||
| Australia and New Zealand | ||
| Rest of Asia Pacific | ||
| Middle East | Saudi Arabia | |
| United Arab Emirates | ||
| Turkey | ||
| Israel | ||
| Qatar | ||
| Rest of Middle East | ||
| Africa | South Africa | |
| Nigeria | ||
| Kenya | ||
| Egypt | ||
| Rest of Africa | ||


Key Questions Answered in the Report
How big is the blockchain-based security solutions market in 2025?
The blockchain-based security solutions market size stood at USD 2.97 billion in 2025 and is projected to reach USD 15.06 billion by 2030.
What is the expected growth rate through 2030?
The market is forecast to expand at a 38.36% CAGR between 2025 and 2030.
Which solution segment grows fastest?
Zero-knowledge proof middleware is projected to register the highest CAGR at 42.01% through 2030.
Why are SMEs adopting blockchain security so rapidly?
Cloud-based delivery and standardized templates allow SMEs to access enterprise-grade protection without maintaining large in-house security teams, supporting a 45.04% CAGR for the segment.
Which region shows the highest future growth?
Asia-Pacific is expected to post a 46% CAGR through 2030, spurred by Singapore’s tokenization initiatives and evolving regional regulations.
How do regulations such as DORA affect adoption?
DORA mandates tamper-proof audit trails and resilience testing, driving European banks and fintechs to integrate ledger-based security modules, thereby boosting market demand.
Page last updated on:


