Software Defined Security Market Size and Share
Market Overview
| Study Period | 2020 - 2031 |
|---|---|
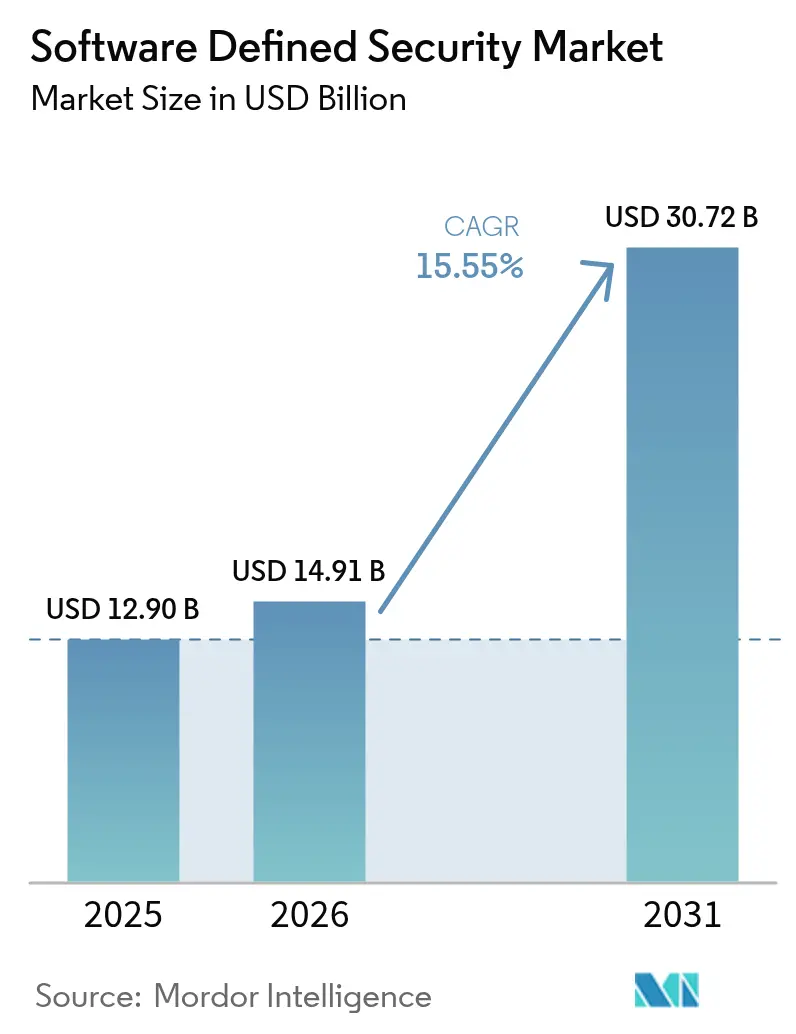
| Market Size (2026) | USD 14.91 Billion |
| Market Size (2031) | USD 30.72 Billion |
| Growth Rate (2026 - 2031) | 15.55% CAGR |
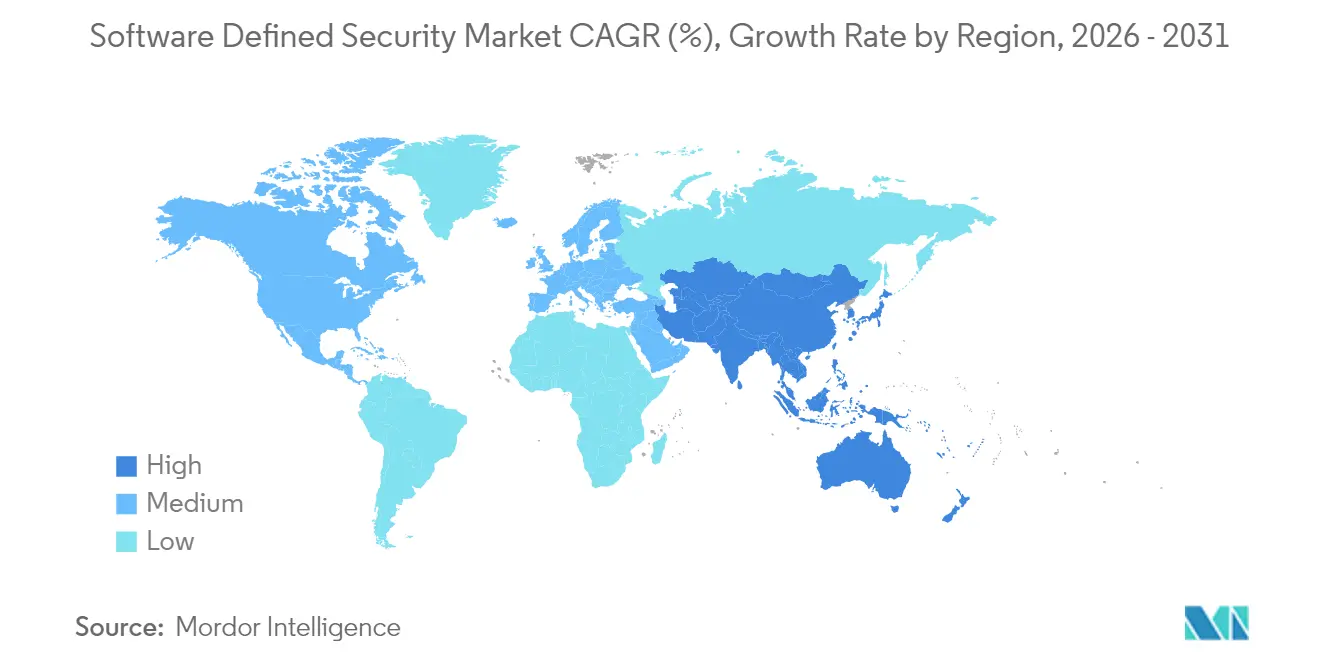
| Fastest Growing Market | Asia Pacific |
| Largest Market | North America |
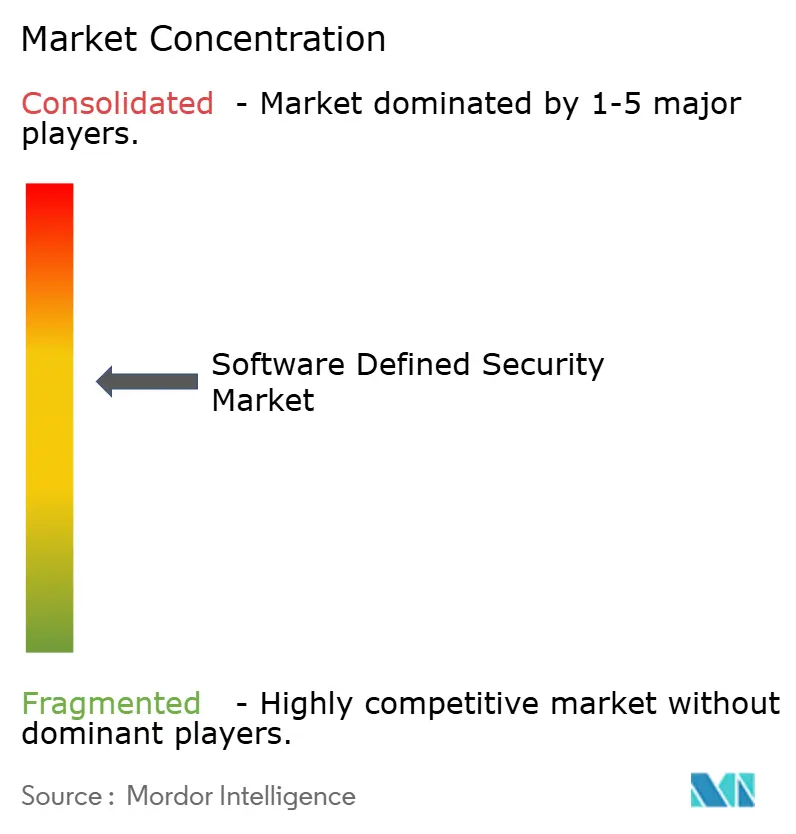
| Market Concentration | Medium |
Major Players *Disclaimer: Major Players sorted in no particular order Image © Mordor Intelligence. Reuse requires attribution under CC BY 4.0. | |
Software Defined Security Market Analysis by Mordor Intelligence
The software-defined security market size was valued at USD 12.9 billion in 2025 and estimated to grow from USD 14.91 billion in 2026 to reach USD 30.72 billion by 2031, at a CAGR of 15.55% during the forecast period (2026-2031). Most enterprises are moving away from perimeter-centric controls toward programmable architectures that follow workloads as they shift across data centers, multiple public clouds, and edge locations. Automated policy enforcement shortens incident-response cycles, while zero-trust principles embed continuous verification into everyday network operations. Regulatory deadlines such as the EU Cyber Resilience Act and the NIS2 Directive are converting discretionary spending into mandatory investments. At the same time, the rapid growth of containerized applications forces security teams to embrace granular micro-segmentation and runtime protection that only software-defined approaches can deliver. Together, these forces give the software-defined security market durable, double-digit momentum through the end of the decade.
Key Report Takeaways
- By component, software retained 62.35% of the software defined security market share in 2025; services are projected to expand at a 15.28% CAGR through 2031.
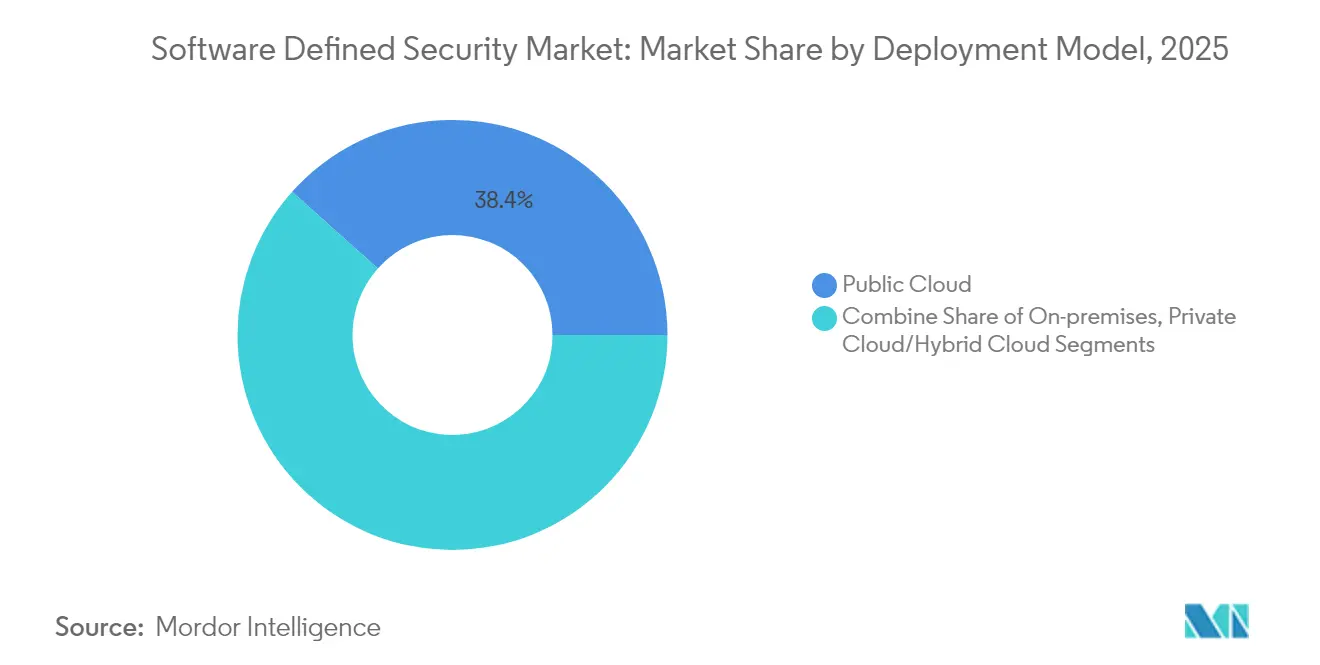
- By deployment model, public cloud held 38.40% revenue share in 2025; SaaS-only public cloud is expected to grow at an 17.65% CAGR to 2031.
- By security type, network security accounted for 39.20% of the software defined security market size in 2025, while cloud/container security leads growth at a 23.05% CAGR.
- By organization size, large enterprises commanded 57.10% share in 2025; small and medium enterprises are forecast to grow at a 13.55% CAGR.
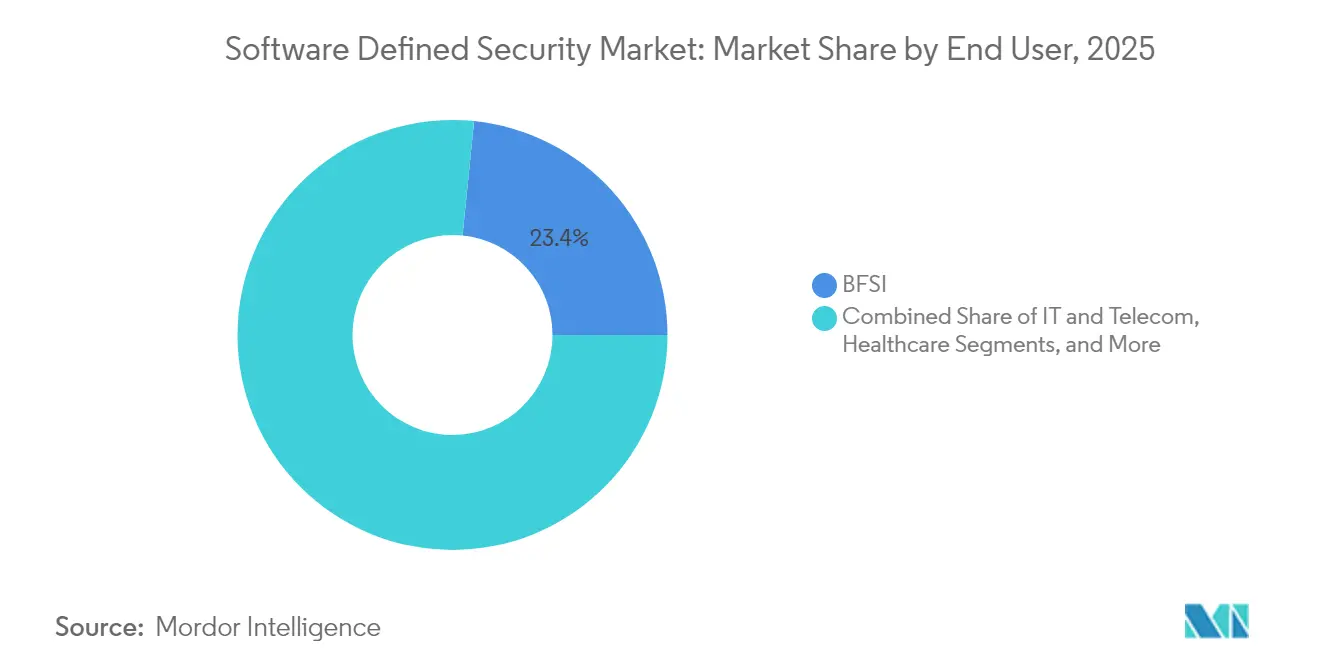
- By end user, BFSI led with 23.40% revenue share in 2025; healthcare is the fastest-growing vertical at a 16.10% CAGR.
- By geography, North America captured 37.25% of revenue in 2025; Asia–Pacific is poised to expand at a 14.55% CAGR through 2031.
Note: Market size and forecast figures in this report are generated using Mordor Intelligence’s proprietary estimation framework, updated with the latest available data and insights as of 2026.
Global Software Defined Security Market Trends and Insights
Drivers Impact Analysis*
| Driver | (~) % Impact on CAGR Forecast | Geographic Relevance | Impact Timeline |
|---|---|---|---|
| Requirement for quicker incident response and policy automation | +3.2% | Global, with concentration in North America & EU | Short term (≤ 2 years) |
| Rising adoption of multi-cloud & hybrid cloud architectures | +4.1% | Global, led by North America & APAC | Medium term (2-4 years) |
| Surge in container/Kubernetes security spend | +2.8% | APAC core, spill-over to North America & EU | Medium term (2-4 years) |
| Shift toward zero-trust & SASE convergence | +3.5% | Global, with early adoption in North America | Long term (≥ 4 years) |
| AI-driven threat-hunting reducing dwell time | +1.9% | North America & EU, expanding to APAC | Short term (≤ 2 years) |
| National cyber-resilience mandates after critical-infrastructure attacks | +2.7% | EU core, expanding globally | Long term (≥ 4 years) |
| Source: Mordor Intelligence | |||
Requirement for quicker incident response and policy automation
Mean time to detection must now be measured in minutes, not days. Coalition’s 2025 Cyber Threat Index found that 58% of ransomware intrusions began with compromised VPN devices, exposing the limits of manual responses. Enterprises therefore employ programmable security controls that auto-isolate endpoints once threat intelligence crosses defined risk thresholds. The financial stakes remain high: average breach costs in Canada reached USD 4.66 million and churn rates climbed to 38% among affected customers in 2025. Automated, software-defined playbooks let security teams scale without proportional head-count increases, aligning protection speed with adversary tempo. [1]Coalition, “Cyber Threat Index 2025 Finds Most Ransomware Incidents Start with Compromised VPN Devices,” coalitioninc.com
Rising adoption of multi-cloud and hybrid cloud architectures
Nutanix reports that 90% of global organizations now run a “cloud-smart” mix of private and multiple public clouds [nutanix.com]. Such diversity fragments visibility; 71% of teams acknowledge policy blind spots in at least one environment. Software-defined security platforms resolve that fragmentation by abstracting policy from the underlying infrastructure. Unified dashboards apply identical controls regardless of whether workloads run on-premises, AWS, Azure, or OCI, ensuring continuous compliance while giving developers freedom to place applications where they perform best. [2]Nutanix, “2025 Enterprise Cloud Index,” nutanix.com
Surge in container/Kubernetes security spend
Red Hat found that 67% of firms delayed production rollouts because container security gaps remained unresolved. Orchestrated microservices spin up and down in seconds, so legacy firewall rules cannot keep pace. Software-defined security tools discover ephemeral pods in real time, label them by function, and enforce micro-segmentation that follows every replica. As more enterprises push stateful services into Kubernetes, runtime protection and image-scanning features become non-negotiable budget items, lifting overall spend on software defined security market platforms.
National cyber-resilience mandates after critical-infrastructure attacks
The EU Cyber Resilience Act and NIS2 expand cybersecurity obligations across manufacturing, health, energy, and transport. Non-compliance can incur penalties up to 2.5% of worldwide turnover, so boards allocate new capital to programmable platforms capable of producing continuous audit trails. Similar supply-chain measures are under review in Japan, India, and Australia, suggesting a widening global pull for the software defined security market.
Restraints Impact Analysis*
| Restraint | (~) % Impact on CAGR Forecast | Geographic Relevance | Impact Timeline |
|---|---|---|---|
| Shortage of DevSecOps talent | -2.1% | Global, acute in North America and EU | Long term (≥ 4 years) |
| Legacy-system interoperability issues | -1.8% | Global, pronounced in established enterprises | Medium term (2-4 years) |
| Hidden performance overhead in east-west micro-segmentation | -1.3% | Global, critical in high-performance environments | Short term (≤ 2 years) |
| Concentration risk from single-vendor policy controllers | -0.9% | Global, regulatory focus in EU & North America | Long term (≥ 4 years) |
| Source: Mordor Intelligence | |||
Shortage of DevSecOps talent
O’Reilly’s 2024 survey shows 38.9% of organizations citing cloud security skills as their biggest gap. DevSecOps engineer salaries in the United States already average USD 140,000, pressuring budgets and project timelines. Many firms backfill the gap with managed service providers, which boosts the services segment but slows in-house adoption of advanced features.
Legacy-system interoperability issues
Public-sector agencies still operate mainframes written in COBOL. ACT-IAC notes that maintenance of such code consumes a large share of total IT budgets. Because older platforms lack modern APIs, teams must deploy middleware that maps static firewall lists to dynamic policy engines, raising integration complexity and cost.
*Our forecasts treat driver/restraint impacts as directional, not additive. The impact forecasts reflect baseline growth, mix effects, and variable interactions.
Segment Analysis
By Deployment Model: SaaS-Only Public Cloud Redefines Consumption
Public cloud continues to lead overall penetration, delivering 38.40% of 2025 revenue. Within that category, the SaaS-only slice is climbing fastest at an 17.65% CAGR. Smaller IT teams in particular prize the instant scaling and rolling updates that cloud-native vendors provide, since no on-premises appliances require patching. Larger enterprises also shift workloads into SaaS nodes to reduce capex and accelerate feature adoption as zero-trust frameworks mature.
On-premises deployments remain indispensable where sovereignty or latency mandates apply; however, hybrid designs increasingly route outbound traffic through SaaS secure web gateways. Combined, these trends move policy control toward the network edge and favour vendors that architect multi-tenant, elastic backplanes. The transition underscores the broader repositioning of the software defined security market from appliance sales to subscription revenue.


By Security Type: Cloud and Container Protection Becomes the Growth Engine
Network security still represents 39.20% of 2025 revenue, reflecting legacy firewall refresh cycles and software-defined wide-area network rollouts. The higher-growth story lies in cloud/container security, which will expand at a 23.05% CAGR through 2031. Development teams containerize monoliths into hundreds of microservices, so runtime controls must adapt in seconds as pods respawn. Continuous image scanning, admission-control hooks, and service-mesh encryption therefore top procurement lists.
Early adopters increasingly bundle container security with posture-management modules that inventory misconfigurations across AWS, Azure, and Google Cloud. This convergence further blurs lines between workload and configuration security, pushing vendors to integrate cloud-native application protection platforms directly into their broader software defined security market suites.
By Organization Size: Cloud-Native Delivery Opens the Door for SMEs
Large enterprises accounted for 57.10% of 2025 spend because distributed footprints demand complex segmentation and 24/7 monitoring. Yet small and medium enterprises will grow faster, at a 13.55% CAGR, as SaaS models democratize advanced capabilities. Subscription dashboards now auto-generate compliance evidence, freeing overstretched IT managers from manual log collection. Vendors also embed low-code policy builders, letting SMEs codify least-privilege rules without scripting knowledge.
Manufacturing SMEs in APAC illustrate the shift. Rockwell Automation’s 2025 survey found 35% naming cybersecurity as their top operational risk. As they digitize production lines, these firms purchase lightweight, agentless controls that secure both information-technology and operational-technology assets through a unified policy pane.
By End User: Healthcare Investment Rises After Repeated Breaches
BFSI retained leadership at 23.40% share in 2025 due to stringent data-protection mandates and the systemic importance of payment networks. Healthcare, however, will expand at a 16.10% CAGR, the fastest among tracked verticals. Following the Change Healthcare incident, 94% of hospitals surveyed by the American Hospital Association boosted cybersecurity budgets, prioritizing segmentation of clinical devices and continuous risk scoring of third-party vendors. Software-defined platforms fit these requirements by automating HIPAA audit evidence and dynamically isolating suspect endpoints without disrupting patient care.
Other sectors—telecommunications, retail, energy, and public services—continue to broaden adoption as 5G rollouts, e-commerce growth, and critical-infrastructure regulation sharpen the need for programmable defenses. Each new use case further expands the total addressable software defined security market.
By Component: Services Gain Momentum Amid Software Leadership
The software defined security market size for software platforms remained dominant at USD 8.04 billion in 2025, translating into a 62.35% revenue share. Yet the services sub-segment is set to advance at a 15.28% CAGR through 2031, outpacing core license growth. Enterprises recognize that policy automation, threat modelling, and infrastructure-as-code disciplines demand skills that internal teams often lack. As a result, managed detection-and-response specialists see surging demand for project staffing, continuous monitoring, and compliance documentation.
Professional services partners fill this gap by designing zero-trust blueprints, mapping business processes to micro-segmented networks, and coding workflow integrations that orchestrate incident response. Vendors such as Cisco deepened service portfolios when they closed the USD 28 billion Splunk acquisition in March 2025, merging analytics with hands-on advisory offerings. This pairing helps customers rationalize tool sprawl and keep pace with evolving regulations, further cementing the software defined security market’s service opportunity.
Geography Analysis
North America captured 37.25% of 2025 revenue, underpinned by decisive federal action. The U.S. Department of Defense allocated USD 504.9 million to DISA cyber operations for fiscal 2025, with a mandate to build zero-trust reference architectures that ripple into contractor ecosystems. Corporate boards mirror that urgency: overall cybersecurity spending in the region grew 15% year over year, buoyed by the White House’s executive orders that require software bills of materials and continuous monitoring across the federal supply chain.
Europe sits in second place but posts healthy acceleration as the software defined security market aligns with sweeping legislation. The Cyber Resilience Act coming into force in December 2027 obliges manufacturers to design products with security baked in from day one. Complementary measures such as the Digital Operational Resilience Act (for finance) and NIS2 (for essential services) extend similar obligations across the economy. Enterprises are therefore converging on programmable policy engines capable of proving compliance in real time to multiple supervisory bodies.
Asia–Pacific is the growth frontrunner, set to log a 14.55% CAGR through 2031. Manufacturing heavyweights in China, Japan, and South Korea pursue Industry 4.0 programs that expose operational-technology networks to internet threats. Governments respond with sector-specific frameworks that recommend micro-segmentation and zero-trust, propelling new projects. India’s Digital Personal Data Protection Act similarly raises bars for healthcare and e-commerce operators. Collectively, these moves expand the regional share of the global software defined security market.
The Middle East, Africa, and South America are emerging adopters. Energy exporters commission secure-by-design refinery control systems, while Brazilian financial regulators publish stringent open-banking security guidelines. Although absolute spend remains lower, high growth rates make these geographies attractive for cloud-native vendors seeking greenfield opportunities.

Regulatory Landscape
Regulation is increasingly tying software-defined security adoption to auditable controls, secure development practices, and mandatory reporting. In the United States, Executive Order 14144 (January 2025) reinforced software supply chain transparency and directed NIST to update Secure Software Development Framework (SSDF) practices, which lifts demand for SDS platforms that can enforce policy-as-code and generate continuous compliance evidence. In June 2026, National Security Presidential Memorandum NSPM-12 set NIST standards as the minimum baseline for National Security Systems and tasked CNSS with identifying revisions to cloud security policy (CNSSP-32) within 90 days. This strengthened federal procurement pull-through for zero-trust-aligned, software-defined control planes across agencies and contractors.
In Europe, the Cyber Resilience Act (Regulation (EU) 2024/2847) extends product security obligations for software and hardware with digital elements, including vulnerability handling and reporting requirements. The applicability milestones in 2026 (including Chapter IV provisions related to notification of conformity assessment bodies) and the CRA reporting obligations becoming applicable in 2026 under Article 14 create concrete compliance timelines that favor programmable security architectures capable of standardized evidence collection across multi-cloud and edge deployments. Alongside NIS2-driven supervisory scrutiny, these requirements shift security modernization into a governance obligation rather than an optional refresh cycle.
Value Chain Analysis
The software-defined security value chain starts with standards and assurance inputs (NIST guidance, EU cybersecurity legislation, and industry frameworks), then moves into core platform vendors that provide policy engines, telemetry collection, analytics, and orchestration, usually delivered as software or SaaS. Downstream, implementation partners and managed security service providers operationalize zero-trust designs, integrate SDS controls with IAM, SIEM/SOAR, and cloud platforms, and maintain compliance artifacts. This aligns with the market shift toward services as enterprises work through DevSecOps and cloud security skill gaps.
Interoperability and ecosystem partnerships act as value-chain multipliers because buyers run heterogeneous stacks across on-premises, public cloud, and Kubernetes. The February 2025 integration announced by Zero Networks and Palo Alto Networks links microsegmentation with next-generation firewall enforcement, illustrating that SDS outcomes increasingly depend on cross-vendor connectors rather than standalone tools. On the upstream trust layer, industry work on the Security Protocol and Data Model (SPDM) with post-quantum cryptography alignment (May 2025) and NIST consortium activity on DevSecOps and software supply chain practices (including draft guidance in 2025) supports a shift toward verifiable software provenance, SBOM-aligned operations, and automated policy enforcement that scales across distributed infrastructure.
Competitive Landscape
The software defined security market is moderately concentrated yet fiercely contested. Established networking players—Palo Alto Networks, Fortinet, Cisco, and Check Point—leverage proprietary ASICs and consolidated operating systems to bundle network, endpoint, and cloud controls under a unified license. Cisco’s 2025 integration of Splunk strengthens its analytics posture, pairing log ingestion with real-time automation hooks. Fortinet’s Security Fabric follows a similar path, anchoring zero-trust edges on homegrown silicon for high-throughput inspection.
Cloud-native challengers such as Zscaler, CrowdStrike, and Netskope differentiate through multi-tenant architectures that scale instantly without customer hardware. Zscaler’s FY 2025 roadmap emphasizes inline data-loss prevention and direct-to-cloud micro-segmentation. CrowdStrike extends Falcon modules into Kubernetes runtime visibility, translating endpoint telemetry into workload-specific policies.
Strategic acquisitions accelerate innovation cycles. Sophos’ late-2024 purchase of Secureworks broadens its managed detection portfolio, while Darktrace’s 2025 updates add self-healing network loops and risk-weighted visualization tools. Investors continue to fund point solution start-ups that fill gaps in identity-centric segmentation, cloud permissions management, and operational-technology threat hunting, ensuring a steady inflow of specialized features into broader suites.
Vendor differentiation now hinges less on raw detection accuracy and more on how seamlessly controls integrate into DevOps pipelines. Open REST APIs, Terraform providers, and workflow orchestration drive buyer preference. Over the forecast period, platformization is expected to consolidate market shares further as enterprises reduce tool sprawl, but ample niche space remains for innovators that address container isolation, machine-to-machine authentication, and post-quantum cryptography readiness.
Software Defined Security Industry Leaders
Palo Alto Networks
Cisco Systems
Fortinet
VMware (Broadcom)
Check Point Software
- *Disclaimer: Major Players sorted in no particular order

Market Opportunities and Future Outlook
A near-term opportunity sits at the intersection of zero-trust adoption and identity-centric access in distributed environments, where software-defined perimeter (SDP) patterns and policy automation reduce reliance on fixed perimeter controls. Standards activity offers a concrete pathway for repeatable implementations. The IETF Interface to Network Security Functions (i2nsf) work on data models for network security function interfaces, together with ITU-T recommendations such as X.1046 (software-defined security framework for SDN/NFV), provides common structures for defining and exchanging policy. This standardization supports multi-vendor deployments where buyers can avoid single-vendor controller lock-in by using consistent models across enforcement points.
Another whitespace area is software-defined security tied to virtualized telecom and edge. Open RAN security requirements and protocols (O-RAN ALLIANCE WG11) embed zero-trust architecture concepts and mandate controls such as mutual authentication and modern transport protections (for example, TLS and IPsec) across disaggregated components. As 5G core, RAN, and edge compute expand, SDS platforms that can translate these requirements into continuous, automated control enforcement and compliance artifacts across multi-cloud footprints gain advantage. NIST programs such as Advanced Security Architectures for Next Generation Wireless (ASA-NGW) reinforce the need for architecture-driven security in next-gen wireless stacks, which favors policy-driven, software-defined enforcement that can be updated as threats and cryptographic requirements evolve.
Recent Industry Developments
- July 2026: Cisco completed the acquisition of Astrix Security Ltd. to address non-human identities used by AI agents and automated workflows. The deal expands Cisco security coverage beyond users and endpoints into machine and service identities, reinforcing software-defined policy controls that can be enforced consistently across cloud and enterprise environments.
- April 2026: Palo Alto Networks completed its acquisition of Koi to build a new Agentic Endpoint Security (AES) category. This adds software-defined runtime controls tailored to AI-driven and autonomous endpoint activity, tightening integration between endpoint posture, automated response, and broader platform policy orchestration.
- May 2025: Cisco introduced Instant Attack Verification and automated XDR forensics and expanded integration with ServiceNow to connect security signals to enterprise workflows. The updates improve closed-loop automation from detection to remediation, supporting faster incident response and more consistent enforcement in software-defined security deployments.


Research Methodology Framework and Report Scope
Market Definition and Coverage
For this study, the software-defined security market covers security controls delivered, managed, or enforced through software and centralized policy, rather than being tied to a fixed physical appliance. It includes solutions and related services used to protect workloads, users, and traffic across on-premises environments and cloud setups.
Scope exclusions: Physical, hardware-only security appliances that do not offer software-based policy control and automation are excluded.
Segmentation Overview
- By Component
- Software
- Services
- By Deployment Model
- On-premises
- Public Cloud
- Private Cloud
- Hybrid Cloud
- By Security Type
- Network Security
- Endpoint Security
- Application Security
- Cloud / Container Security
- Others
- By Organization Size
- Small and Medium Enterprises
- Large Enterprises
- By End User
- BFSI
- Telecommunications and IT
- Healthcare
- Government and Defense
- Retail and eCommerce
- Energy and Utilities
- Others
- By Geography
- North America
- United States
- Canada
- Mexico
- Europe
- United Kingdom
- Germany
- France
- Italy
- Rest of Europe
- APAC
- China
- Japan
- India
- South Korea
- Rest of APAC
- Middle East
- Israel
- Saudi Arabia
- United Arab Emirates
- Turkey
- Rest of Middle East
- Africa
- South Africa
- Egypt
- Rest of Africa
- South America
- Brazil
- Argentina
- Rest of South America
- North America
Data Sources, Market Sizing, and Validation
Desk Research
Desk research was used to map the demand context, define what counts as software-defined security, and collect reference data series that can be checked over time. We leaned on public and official sources such as NIST publications, CISA advisories, NVD vulnerability statistics, FCC communications industry datasets, and OECD digital economy indicators, since these help explain adoption pressure and security risk levels.
We also reviewed company filings, earnings call transcripts, investor decks, product documentation, and reputable press to understand how vendors describe software-delivered enforcement, orchestration, and policy management. To keep the market model consistent, company financials and news intelligence subscriptions were used for structured revenue cues and timeline checks. These desk sources are not exhaustive, and many other public materials were referenced for data collection, validation, and clarification.
Primary Interviews and Surveys
Primary work focused on validating what buyers count as software-defined security in budgets, and what is treated as adjacent spend that should not be mixed in. We spoke with a mix of solution providers, channel and integrator teams, and end-user security and network leaders across APAC, EMEA, and the Americas so assumptions on adoption timing, pricing, and replacement cycles could be cross-checked.
Distribution of primary research fieldwork respondents
| Company type | Respondent position | Region |
|---|---|---|
| Top tier: 36% | CXOs: 18% | APAC: 47% |
| Mid tier: 43% | Functional/Unit leaders: 25% | EMEA: 32% |
| Smaller Players: 21% | Managers: 57% | Americas: 21% |
Market-Sizing & Forecasting
Sizing starts with a top-down build where security software and services spend is reconstructed by region using IT spending indicators, cloud workload growth, and enterprise security adoption signals, and then filtered to the share that is actually software-defined in delivery and control. When the spend pool is shaped, it is corroborated using selective bottom-up approximations like sampled vendor revenue splits, channel checks on deal mix, and a simple ASP times volume logic for common deployments.
Inputs used in the model include public cloud adoption and workload migration pace, reported cybersecurity budgets by industry, enterprise headcount and device density trends, vulnerability and incident intensity signals, and the shift toward zero-trust and policy automation in procurement discussions. For forecasting, scenario analysis is applied so the model can reflect different adoption speeds for software-based enforcement, cloud security architectures, and compliance-driven timelines. Where bottom-up detail is not available for smaller providers, gaps are handled through peer-based ratios that are then tested in interviews and adjusted if the implied penetration looks unrealistic.
Data Validation & Update Cycle
Model outputs are checked against independent indicators such as cloud workload growth, security spending momentum, and typical contract sizes discussed in interviews, so totals stay aligned with a real demand pool. If a region or year shows an unusual jump, the assumptions behind adoption, pricing, and mix are rechecked and the outlier is reviewed in a second analyst pass before sign-off.
Reports are refreshed annually, and interim updates are made when material events change the outlook, such as major regulatory deadlines or sharp shifts in enterprise IT spending. Before delivery, a final review is performed so the published numbers reflect the latest available public data and the most recent expert feedback.
Mordor Intelligence's Software Defined Security Market Size Measured Against Other Published Estimates
Published market sizes for software-defined security can look far apart, even when they are talking about the same general theme. The gaps usually come from what is counted inside the market, the base year and currency timing, and how fast pricing and adoption are assumed to move as cloud and zero-trust programs expand.
Some sources bundle broad cybersecurity categories like general network security and endpoint security into the total, even when those products are not managed through software-defined policy and orchestration. For Mordor Intelligence, revenue is counted only when security is delivered or enforced through software-based control and automation across on-premises and cloud environments, and hardware-only appliance revenue without that control layer is kept out.
Benchmark comparison
| Source | Market Size | Gaps in Research Methodology |
|---|---|---|
| Mordor Intelligence | USD 14.91 B (2026) | |
| Industry Publisher A | USD 12.24 B (2024) | Uses an earlier base year and a broader enforcement-point view, which can mix in security spend that is not consistently software-defined in control and policy management, and it also applies a long-horizon growth path that can lift totals quickly. |
| Pricing-led Tracker B | USD 10.67 M (2030) | Built as a sales-revenue tracker with a narrower vendor and application cut, so parts of the services layer and certain enterprise deployment mixes can be undercounted, which compresses the market size versus wider coverage approaches. |
The table shows that year selection and what gets treated as truly software-defined are the main drivers of spread. By tying the estimate to clear inclusion rules, and then stress-testing adoption and pricing assumptions with interview feedback, the final figure stays traceable to practical inputs that can be reviewed and repeated.


Key Questions Answered in the Report
What is the current size of the software defined security market?
It is valued at USD 14.91 billion in 2026 and is projected to reach USD 30.72 billion by 2031.
Which component segment grows fastest?
Services, expanding at a 15.28% CAGR as firms seek external expertise to operationalize zero-trust and multi-cloud policies.
Why is Asia–Pacific the fastest-growing region?
Manufacturing digitalization, national cyber-security strategies, and rapid cloud adoption lift regional demand, driving a 14.55% CAGR.
How does zero-trust architecture influence purchasing decisions?
It requires continuous verification and granular segmentation, both of which favor programmable security platforms over traditional appliances.
What skills gap challenges deployment?
A shortage of DevSecOps professionals raises project costs and slows rollouts, prompting many organizations to hire managed service providers.
Which vertical is expected to see the highest growth through 2031?
Healthcare, at a 16.10% CAGR, as hospitals harden defenses after high-profile breaches.
Page last updated on:


