Network Security Market Size and Share
Market Overview
| Study Period | 2020 - 2031 |
|---|---|
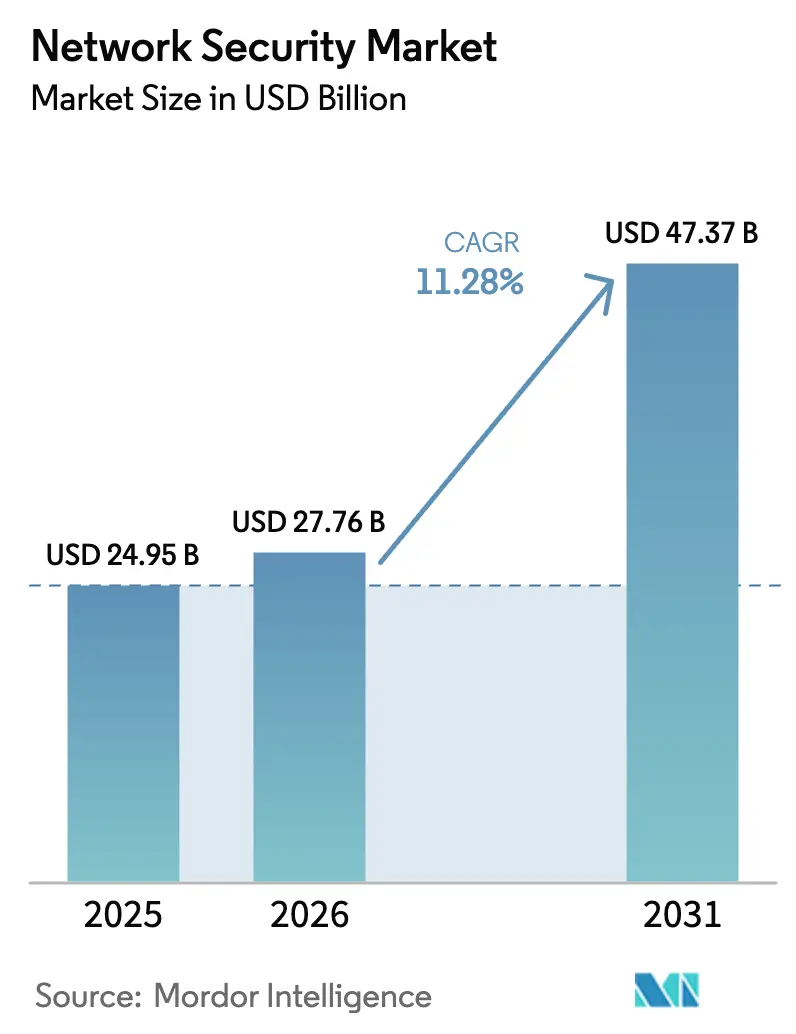
| Market Size (2026) | USD 27.76 Billion |
| Market Size (2031) | USD 47.37 Billion |
| Growth Rate (2026 - 2031) | 11.28% CAGR |
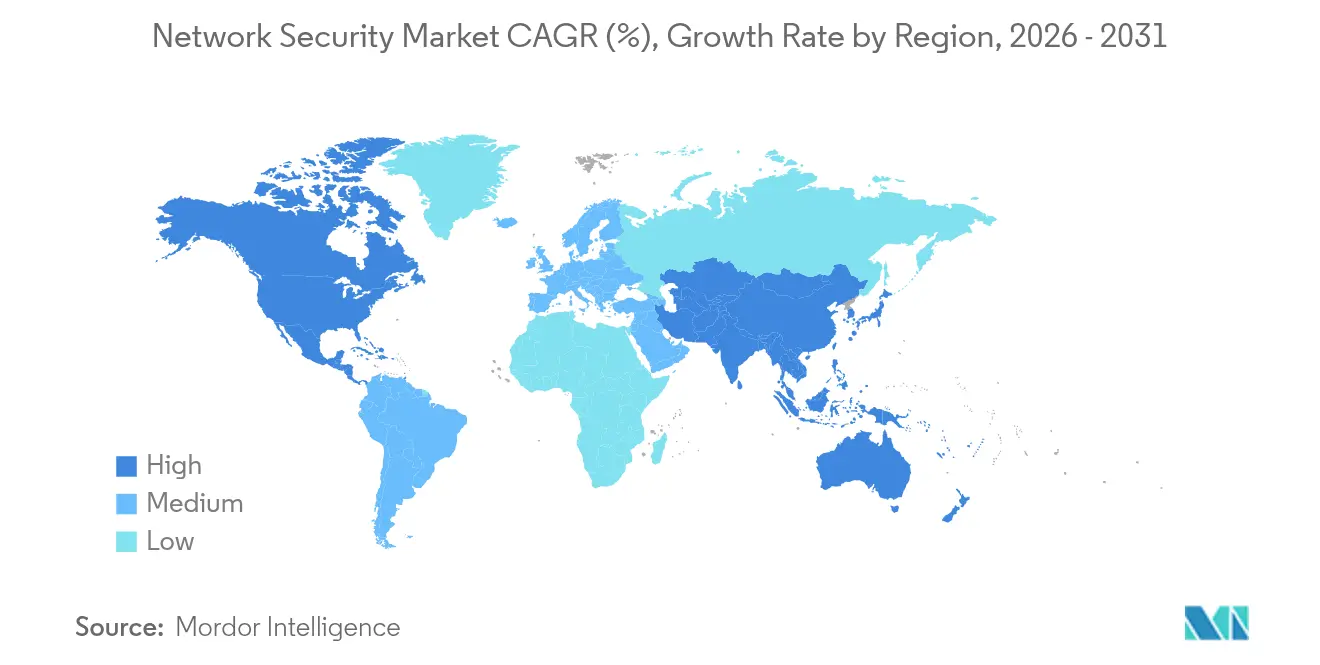
| Fastest Growing Market | Asia Pacific |
| Largest Market | North America |
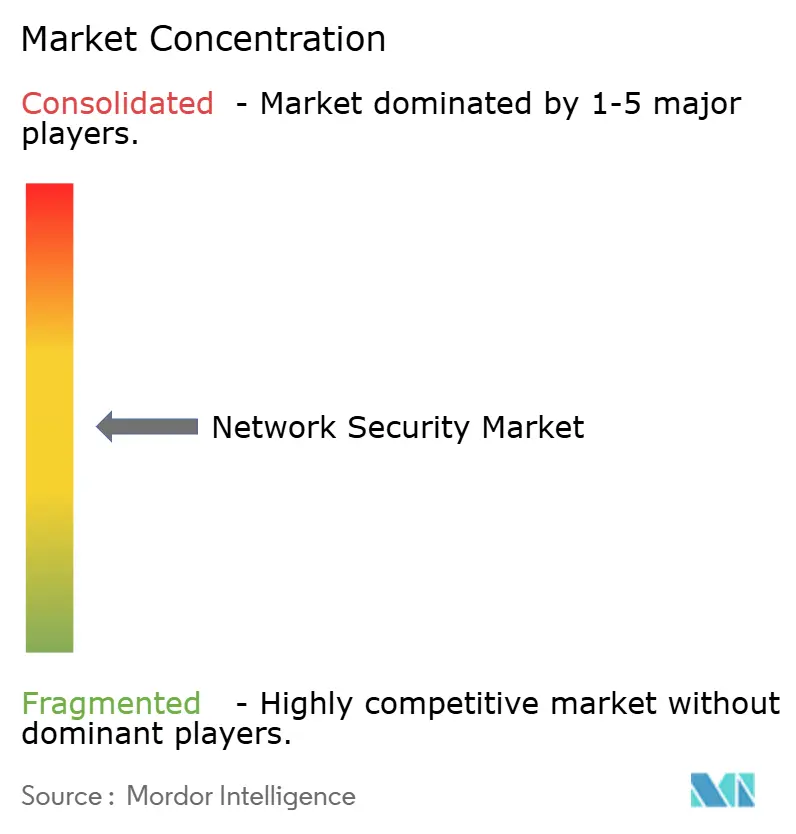
| Market Concentration | Medium |
Major Players *Disclaimer: Major Players sorted in no particular order Image © Mordor Intelligence. Reuse requires attribution under CC BY 4.0. | |
Network Security Market Analysis by Mordor Intelligence
The network security market size is expected to grow from USD 24.95 billion in 2025 to USD 27.76 billion in 2026 and is forecast to reach USD 47.37 billion by 2031 at 11.28% CAGR over 2026-2031. Heightened attack sophistication, the rise of ransomware-as-a-service, and compliance mandates such as software bill-of-materials rules are accelerating enterprise investment in comprehensive, cloud-centric defenses. Organizations are re-architecting networks around zero-trust and secure access service edge (SASE) frameworks to protect distributed users and workloads. Vendors that can combine threat intelligence, micro-segmentation, and AI-driven analytics within a unified platform continue to capture a larger share. Services enjoy the fastest growth because talent shortages prompt companies to adopt managed detection and response, while cloud deployment dominates as firms modernize their branches and extend protection to multi-cloud estates.
Key Report Takeaways
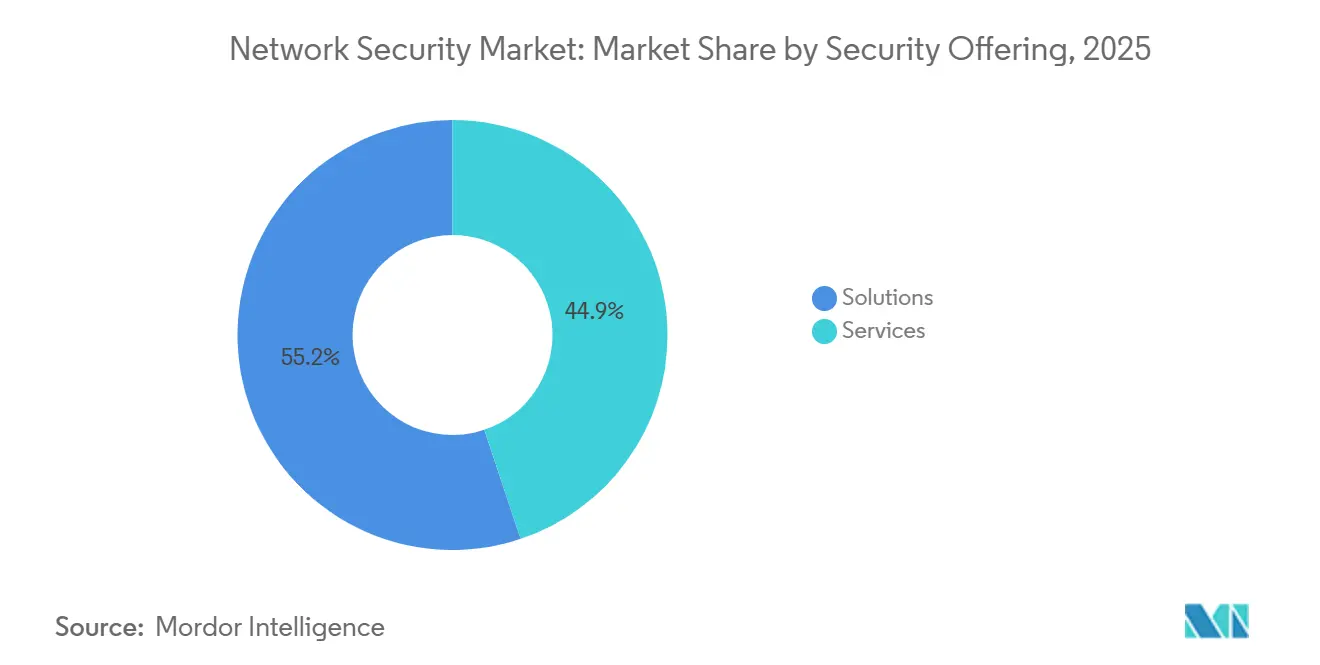
- By security offering, solutions retained 55.15% revenue share in 2025, while services are projected to grow at 14.55% CAGR through 2031.
- By deployment mode, cloud held 52.35% of the network security market share in 2025 and is forecast to expand at 15.5% CAGR to 2031.
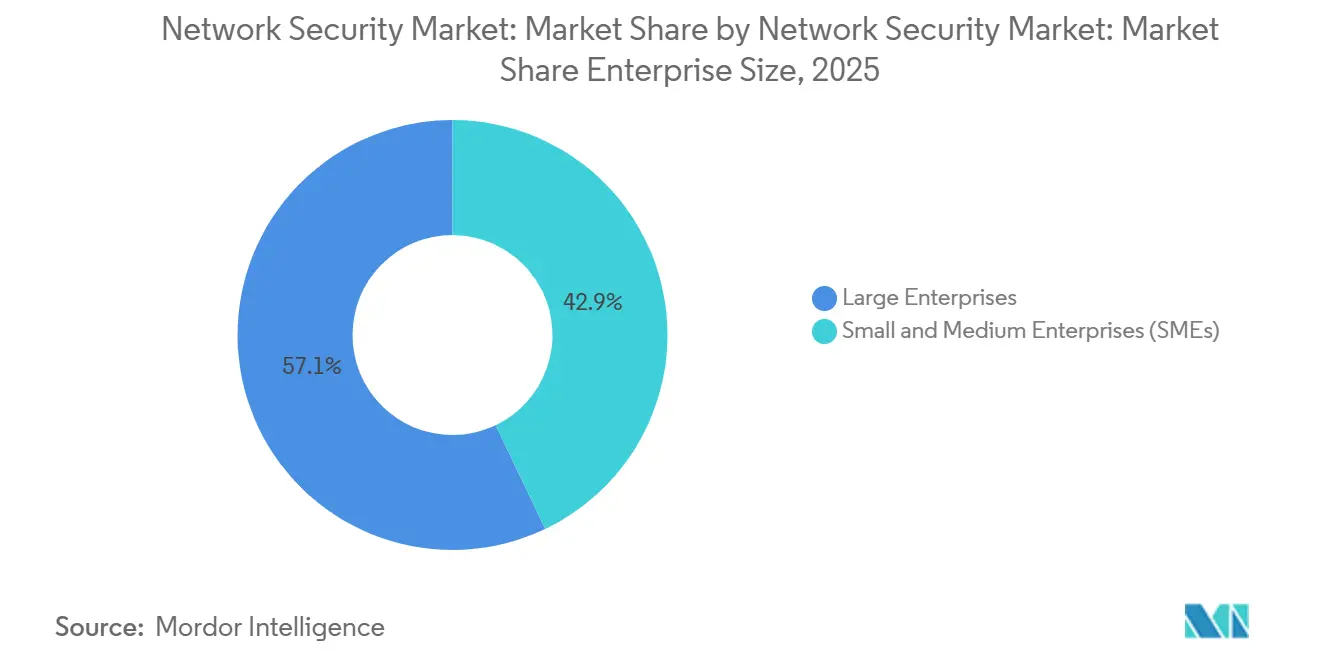
- By enterprise size, large enterprises commanded 57.10% share of the network security market size in 2025; SMEs are growing faster at 14.12% CAGR.
- By end-user industry, the BFSI segment led with a 23.55% market share in the network security market in 2025, whereas the healthcare segment is projected to post the highest CAGR of 15.48% from 2025 to 2031.
- By geography, North America contributed 35.10% revenue in 2025; Asia-Pacific is advancing at 12.05% CAGR through 2031.
Note: Market size and forecast figures in this report are generated using Mordor Intelligence’s proprietary estimation framework, updated with the latest available data and insights as of 2026.
Market Trends and Insights
Drivers Impact Analysis of Network Security Market*
| Driver | (~) % Impact on CAGR Forecast | Geographic Relevance | Impact Timeline |
|---|---|---|---|
| Escalating sophistication of ransomware-as-a-service | +2.8% | North America, Europe | Short term (≤ 2 years) |
| Rapid cloud migration expanding threat surface | +2.1% | North America, Asia-Pacific | Medium term (2–4 years) |
| Proliferation of IoT/OT devices needing segmentation | +1.9% | Asia-Pacific, Europe | Long term (≥ 4 years) |
| Adoption of SASE and thin-branch refreshes | +1.6% | North America, expanding in Asia-Pacific | Medium term (2–4 years) |
| Mandatory SBOM rules for anomaly detection | +1.4% | North America, Europe | Short term (≤ 2 years) |
| Telco security-as-a-service for 5G private networks | +1.2% | Asia-Pacific, selective European markets | Long term (≥ 4 years) |
| Source: Mordor Intelligence | |||
Escalating sophistication of ransomware-as-a-service
Service-based ransomware kits now bundle reconnaissance and lateral-movement tools, forcing companies to build zero-trust network architectures that inspect east-west traffic and apply real-time micro-segmentation. CrowdStrike reported that modern RaaS groups target network vulnerabilities more than endpoints, prompting purchases of analytics that spotlight suspicious internal flows. Arctic Wolf found that 72% of successful ransomware intrusions in 2024 originated from unsegmented networks, reinforcing the demand for behavior-based detection that minimizes blast radius. [1]Arctic Wolf Labs, “Ransomware Trends Report 2024,” Arctic Wolf, arcticwolf.comThe economic fallout extends beyond ransom; boards now budget for resilience investments that maintain uptime even during attack recovery.
Rapid cloud migration expanding threat surface
With 95% of enterprises using at least one public cloud, policy sprawl poses a challenge to traditional perimeter tools. Palo Alto Networks observed that 70% of firms cannot enforce uniform rules across hybrid estates, motivating the adoption of cloud-native firewalls and SASE overlays. Menlo Security attributes 65% of data-exposure incidents to cloud misconfigurations, an issue addressed by platforms that auto-detect risky settings and provide integrated remediation across workloads. These capabilities differentiate vendors able to deliver elastic protection without infrastructure bottlenecks.
Proliferation of IoT/OT devices requiring network segmentation
Industry 4.0 initiatives connect sensors and controllers that rarely ship with embedded security. Dragos reports 80% of industrial control systems remain vulnerable to network-based exploits, driving orders for OT-aware firewalls and anomaly-detection engines. [2]Dragos OT-CERT, “2025 Industrial Control System Vulnerability Analysis,” Dragos, dragos.comCisco integrates ruggedized security appliances that interpret industrial protocols and apply enterprise-class analytics at the edge. Nozomi Networks notes that manufacturers implementing OT segmentation cut incident response times by 60%, underscoring operational ROI
Adoption of SASE driving thin-branch refreshes
Secure Access Service Edge converges networking and security in the cloud, reducing on-site hardware while improving distributed workforce protection. Hughes Network Systems logged a 45% jump in SASE projects during 2024 as businesses sought simpler branch deployments. Palo Alto Networks’ SASE revenue climbed 36% year-over-year, evidencing enterprise confidence in cloud-delivered inspection that scales with remote-access demands. Mid-market firms gain enterprise-grade defenses without standing up dedicated security teams.
Restraints Impact Analysis of Network Security Market*
| Restraint | (~) % Impact on CAGR Forecast | Geographic Relevance | Impact Timeline |
|---|---|---|---|
| Shortage of skilled cyber-security professionals | –1.8% | North America, Europe | Long term (≥ 4 years) |
| High capex for next-gen ASIC appliances | –1.2% | Global, mid-market enterprises most affected | Medium term (2–4 years) |
| Performance trade-offs of full TLS 1.3 inspection | –0.9% | Markets with legacy infrastructure | Short term (≤ 2 years) |
| Vendor API lock-in hindering best-of-breed choice | –0.7% | North America, Europe | Medium term (2–4 years) |
| Source: Mordor Intelligence | |||
Shortage of skilled cyber-security professionals
ISC2 cites a 4.8 million-person global talent gap, with 90% of employers anticipating staff shortfalls that directly affect protection quality. NIST lists over 663,000 unfilled US cyber roles, inflating salaries for network specialists and pushing companies toward automated platforms and managed detection services. AI-driven monitoring tools that reduce manual tuning gain traction, yet the skill deficit continues to limit rollout speed of complex zero-trust projects
High capex for next-gen ASIC-based appliances
Custom silicon accelerates packet inspection but raises unit cost. TD Securities estimates development expenses for advanced networking ASICs are 40% higher than in 2024, partly due to supply-chain constraints. Cisco’s 400G ASIC program exemplifies multi-billion-dollar outlays that flow into product pricing, prompting mid-market buyers to evaluate software-defined alternatives running on commodity hardware. Longer proof-of-concept cycles can delay purchase decisions, dampening short-term revenue.
*Our forecasts treat driver/restraint impacts as directional, not additive. The impact forecasts reflect baseline growth, mix effects, and variable interactions.
Network Security Market Segment Analysis
By Security Offering:
Services Accelerate Through Managed ExpertiseSolutions retained 55.15% share of the network security market in 2025, but Services are poised for a brisk 14.55% CAGR to 2031. Demand for external expertise arises because threat actors now weaponize AI, forcing enterprises to outsource 24/7 monitoring and incident response. Professional services consultancies win projects designing zero-trust blueprints, while managed security service providers (MSSPs) secure recurring contracts to operate those environments. Cisco doubled security revenue to USD 2.02 billion in Q1 2025 after folding Splunk analytics into its portfolio and layering managed offerings atop the combined stack.
Vendor pricing models are shifting from perpetual licenses to outcome-based subscriptions tied to risk-reduction KPIs, locking in predictable annuities. Baseline tools such as network access control and DDoS protection continue to sell steadily, yet the fastest-rising solution is Zero Trust Network Access, which operates natively in cloud and edge contexts. The network security market benefits as buyers bundle consulting, integration, and ongoing management into a single contract that simplifies budgeting and accountability.


By Deployment Mode:
Cloud-Native Architectures Drive TransformationCloud deployments commanded 52.35% of the network security market share in 2025 and are expected to compound at 15.5% annual growth rate through 2031, as enterprises retire their appliance stacks. Uniform policy enforcement across on-prem, public cloud, and edge requires centralized orchestration rather than siloed firewall rules. The network security market size for cloud controls is projected to expand during the forecast period, reflecting the adoption of inspection points embedded in SaaS, PaaS, and container workloads.
Europe’s NIS2 Directive obligates critical infrastructure operators to demonstrate consistent protection and reporting, a task simplified by centrally managed cloud security dashboards. Even air-gapped industrial sites now employ hybrid models, where analytics and patch intelligence are delivered from the cloud, while data planes remain on-site. Palo Alto Networks’ 36% jump in cloud security revenue underscores market confidence that virtualized enforcement can equal or surpass the performance of bespoke hardware.
By Enterprise Size:
SMEs Embrace Democratized SecurityLarge Enterprises represented 57.10% of 2025 revenue, yet SMEs will outpace them with a 14.12% CAGR as democratized defenses become affordable. Subscription-priced SASE and AI-driven firewalls let small firms tap the same threat feeds used by global banks without buying data centers. The network security market size for SME solutions is rising in tandem with managed service adoption that offloads complexity and talent acquisition.
Fortinet tailors simplified dashboards and bundled support aimed at sub-1,000-employee organizations, aligning billing to monthly cash flows. While large corporations embark on multi-year zero-trust migrations that require deep professional services, mid-market buyers gravitate to turnkey packages configurable in hours. As higher-end capabilities trickle down, the network security industry gains a broader revenue base and reduces reliance on a handful of marquee accounts.
By End-user Industry:
Healthcare Accelerates Digital ProtectionBFSI held 23.55% network security market share in 2025, reflecting banks’ long-standing regulatory obligations, but Healthcare will log the fastest 15.48% CAGR through 2031. Clinical digitization, tele-medicine, and connected devices enlarge the attack surface, and ransomware campaigns increasingly target hospitals. Consequently, the network security market size for healthcare controls is anticipated to double over the forecast horizon.
Manufacturing sustains momentum as Industry 4.0 converges IT and OT. Segmentation tools that understand Modbus or PROFIBUS traffic safeguard uptime without interrupting production. Government, defense, and telecom segments remain heavy spenders, the latter embedding security into 5G core networks and private wireless deployments to meet ultra-low-latency demands.
Geography Analysis
North America Network Security Market
North America generated 35.10% of network security market revenue in 2025, underpinned by stringent mandates such as the SEC’s cyber-incident disclosure rule and a mature ecosystem of vendors and MSSPs. Spending is concentrated among Fortune 1000 enterprises that are refreshing their architectures around zero-trust and observability convergence. The region also pilots emerging technologies, including AI-based anomaly scoring and post-quantum cryptography inspection.
APAC Network Security Market
The Asia-Pacific region is expected to register a 12.05% CAGR through 2031, the fastest growth rate worldwide. The public cloud's uptake, e-commerce expansion, and manufacturing digitalization create fertile ground for modern defenses. Singapore demonstrates the pattern; its cybersecurity outlays are projected to reach USD 2 billion to USD 2.5 billion by 2026, buoyed by a national strategy that funds workforce development and sector-specific guidelines. Local telcos bundle security with 5G private networks, enabling factories to adopt automation without compromising safety.
Europe Network Security Market
Europe delivers steady growth anchored by the NIS2 Directive, which broadens coverage to 18 critical sectors and imposes stiff fines for non-compliance. ENISA states security budgets now account for 9% of total IT expenditures, with median spending per organization doubling compared with 2023. Cross-border data residency and sovereignty concerns boost demand for solutions that support regional cloud zones while offering harmonized dashboards for multinationals.

Competitive Landscape
The network security market is moderately consolidated. Leading infrastructure vendors consolidate capabilities via multi-billion-dollar deals, while focused specialists innovate in AI detection and OT protection. Cisco’s USD 28 billion acquisition of Splunk merges network telemetry with observability analytics, positioning the company to deliver an end-to-end detection stack that spans packets, logs, and cloud events. Palo Alto Networks continues to maintain an active M&A cadence, from acquiring Protect AI to integrating IBM QRadar assets, thereby stitching together machine-learning defenses with SIEM workflows.
MSSPs, telecom operators, and hyperscale clouds intensify rivalry by embedding security into connectivity bundles, appealing to customers who prefer single-invoice solutions. Industrial OT vendors, such as Nozomi Networks and Claroty, carve out niches by decoding proprietary control-system protocols and offering deterministic anomaly detection that is suited to plant-floor latency constraints. The market recorded 362 cybersecurity acquisitions worth USD 49.9 billion in 2024, underscoring the premium placed on platform breadth and cross-domain analytics.
Differentiation now hinges on automation depth and ecosystem openness. Buyers favor vendors that expose APIs for threat-intel sharing yet avoid lock-in through standards-based policy orchestration. As the zero-trust paradigm matures, partnerships between identity, endpoint, and network providers multiply, aiming to supply a cohesive user-to-app enforcement chain without duplicative agents or consoles. Vendors that deliver measurable risk reduction with minimal operational friction will out-pace slower appliance-centric peers.
Network Security Industry Leaders
Check Point Software Technologies Ltd.
Cisco Systems, Inc.
Fortinet, Inc.
Palo Alto Networks, Inc.
Juniper Networks, Inc.
- *Disclaimer: Major Players sorted in no particular order
Network Security Market Companies Covered in this Report
- Cisco Systems, Inc.
- Palo Alto Networks, Inc.
- Fortinet, Inc.
- Check Point Software Technologies Ltd.
- Juniper Networks, Inc.
- Trend Micro Incorporated
- Cloudflare, Inc.
- Zscaler, Inc.
- Sophos Limited
- Barracuda Networks, Inc.
- WatchGuard Technologies, Inc.
- F5, Inc.
- Arista Networks, Inc. (Awake Security)
- Akamai Technologies, Inc.
- Forcepoint LLC
- Ivanti Software, Inc. (Pulse Secure)
- Dell Technologies Inc. (SonicWall)
- Hewlett Packard Enterprise Development LP (Aruba)
- Broadcom Inc. (Symantec Enterprise)
- Proofpoint, Inc.
- CrowdStrike Holdings, Inc.
- Elastic N.V. (Endgame)
- Darktrace plc
- Nozomi Networks, Inc.
- Radware Ltd.

Recent Industry Developments in Network Security Market
- June 2025: Cisco introduced network security infrastructure tailored for Agentic AI workloads, adding safeguards for autonomous systems across hybrid clouds.
- June 2025: Keysight Technologies launched AppFusion, allowing third-party security tools from Forescout, Instrumentix, and Nozomi Networks to integrate directly with its network packet brokers, streamlining NetOps/SecOps costs.
- March 2025: Verizon Business unveiled Trusted Connection, a network-native Zero Trust Network Access service embedded in customer networks for continuous device, user, and application verification.
- February 2025: NTT DATA and Palo Alto Networks rolled out a managed private 5G security service uniting next-generation firewall functions with industrial network design expertise.


Network Security Market Report Scope and Research Methodology
Market Definition and Coverage
According to Mordor Intelligence, the network security market covers all hardware, software, and cloud-native controls that inspect, segment, and safeguard enterprise IP traffic as it flows between data centers, branch locations, users, and connected devices. The study tracks revenue that vendors earn from purpose-built firewalls, intrusion detection or prevention systems, secure web gateways, zero-trust network access, distributed denial-of-service protection, and managed security services that monitor the same stack.
Scope exclusion: consumer antivirus suites aimed at single-user laptops or smartphones are intentionally left out.
Segments Covered in This Report
- By Security Offering
- Solutions
- Network Firewall
- Intrusion Detection and Prevention Systems (IDPS)
- Secure Web Gateway
- Unified Threat Management (UTM)
- Distributed Denial-of-Service (DDoS) Protection
- Zero Trust Network Access (ZTNA)
- Network Access Control (NAC)
- Other Solutions
- Services
- Professional Services
- Managed Security Services
- Solutions
- By Deployment Mode
- Cloud
- On-Premises
- Hybrid
- By Enterprise Size
- Small and Medium Enterprises (SMEs)
- Large Enterprises
- By End-user Industry
- IT and Telecom
- BFSI
- Government and Defense
- Healthcare
- Manufacturing
- Retail and E-commerce
- Energy and Utilities
- Other End-user Industries
- By Geography
- North America
- United States
- Canada
- Mexico
- South America
- Brazil
- Argentina
- Rest of South America
- Europe
- Germany
- United Kingdom
- France
- Italy
- Spain
- Rest of Europe
- Asia-Pacific
- China
- Japan
- India
- South Korea
- Australia and New Zealand
- Rest of Asia-Pacific
- Middle East and Africa
- Middle East
- Saudi Arabia
- UAE
- Turkey
- Rest of Middle East
- Africa
- South Africa
- Nigeria
- Egypt
- Rest of Africa
- Middle East
- North America
Data Sources, Market Sizing, and Validation
Primary Research
Multiple structured interviews were completed with chief information security officers, telecom MSSP architects, appliance channel partners, and regional regulators in North America, Europe, Asia-Pacific, and the Gulf. Their insights tested early assumptions, filled unit price gaps for next-gen firewalls, and confirmed adoption curves for SASE and zero-trust projects before numbers were finalized.
Desk Research
We began with public datasets from agencies such as NIST, ENISA, ITU, the US FCC, and national CERT portals, which reveal breach volumes, protocol adoption, and compliance deadlines that shape spending. Trade association white papers, listed vendor 10-Ks, and investor presentations supplied shipment counts and average selling prices for major appliance classes. Paid access to D&B Hoovers and Dow Jones Factiva then helped our analysts cross-check revenue splits, contract awards, and M&A signals across regions. The sources listed are illustrative only; many additional references guided data gathering and clarification.
Market-Sizing & Forecasting
A top-down model starts by rebuilding global security outlays from government ICT spend, listed vendor revenue, and regulatory compliance cost pools, which are then split by device class, deployment mode, and buyer size. Select bottom-up checks, sampled appliance shipments times blended ASPs and cloud contract scans, help us refine totals. Key variables include: 1) enterprise bandwidth growth, 2) share of TLS 1.3 traffic, 3) installed base refresh cycles, 4) breach notification counts, and 5) public cloud workload penetration. Multivariate regression links these drivers to historical revenue so a five-year forecast can be run under a base, cautious, and accelerated scenario. Where input gaps appear, proxy ratios from similar geographies are applied and revisited with subject-matter experts.
Data Validation & Update Cycle
Each draft model passes automated variance tests against historical vendor filings, import shipment data, and contract trackers. Senior analysts then investigate anomalies and rerun sensitivities. Reports refresh once a year, with interim updates triggered by material events such as landmark regulations or multi-billion-dollar acquisitions, ensuring clients receive a current view.
How Mordor Intelligence's Network Security Market Size Compares to Other Published Estimates
Published values often differ because firms choose unique scope boundaries, timing, and uplift factors. Our disciplined definitions, annual refresh cadence, and transparent driver set reduce that spread and make our baseline easier to reuse in budgeting conversations.
Key gap drivers include whether services revenue is counted, how hybrid cloud controls are allocated, currency conversion timing, and the aggressiveness of SASE ramp-up assumptions.
Benchmark comparison
| Market Size | Anonymized source | Primary gap driver |
|---|---|---|
| USD 24.95 B (2025) | Mordor Intelligence | |
| USD 24.55 B (2024) | Global Consultancy A | Merges endpoint and network layers, then applies a steeper 14% growth uplift |
| USD 27.11 B (2024) | Global Consultancy B | Includes physical security gateways and uses previous-year average FX rates |
| USD 22.90 B (2024) | Industry Association C | Tracks software only, excluding managed and professional services |
Taken together, the comparison shows that Mordor's numbers sit within the observed band yet stand apart because every assumption is explicitly tied to measurable drivers and repeatedly cross-checked with market practitioners. Decision-makers therefore gain a balanced, transparent starting point for strategy.


Key Questions Answered in the Report
What is the current size of the network security market and how fast is it growing?
The market is valued at USD 27.76 billion in 2026 and is projected to reach USD 47.37 billion by 2031, registering an 11.28% CAGR.
Why are services growing faster than products in network security?
A global shortage of 4.8 million cybersecurity professionals is pushing enterprises to outsource 24/7 monitoring and incident response, driving the Services segment’s 14.55% CAGR.
How important is cloud deployment for future network-security strategies?
Cloud deployments already account for 52.35% market share and will expand at 15.5% CAGR as organizations adopt SASE to secure hybrid and multi-cloud estates.
Which industry vertical is expected to grow the fastest?
Healthcare is forecast to post a 15.48% CAGR because ransomware attacks and digital-health initiatives demand stronger network defenses.
What geographic region offers the highest growth potential?
Asia-Pacific is set to advance at 12.05% CAGR through 2031, propelled by rapid digitization and government-backed cyber-readiness programs.
Page last updated on:


