Vulnerability Management Solutions Market Size and Share
Market Overview
| Study Period | 2019 - 2030 |
|---|---|
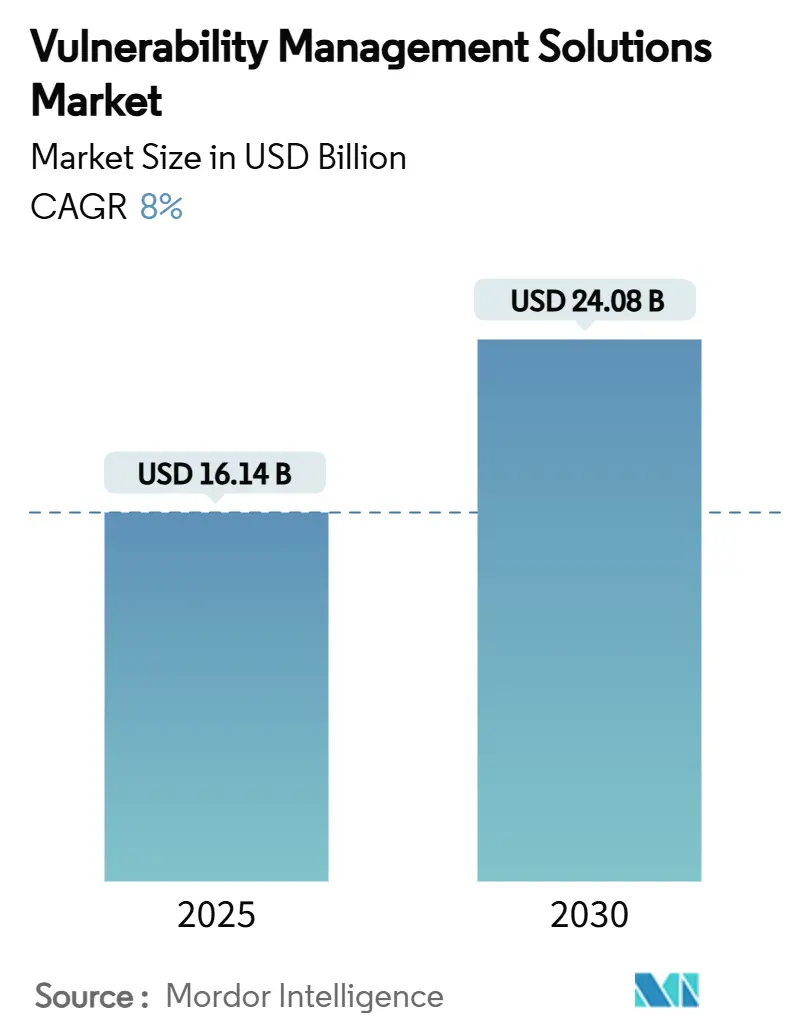
| Market Size (2025) | USD 16.14 Billion |
| Market Size (2030) | USD 24.08 Billion |
| Growth Rate (2025 - 2030) | 8.00% CAGR |
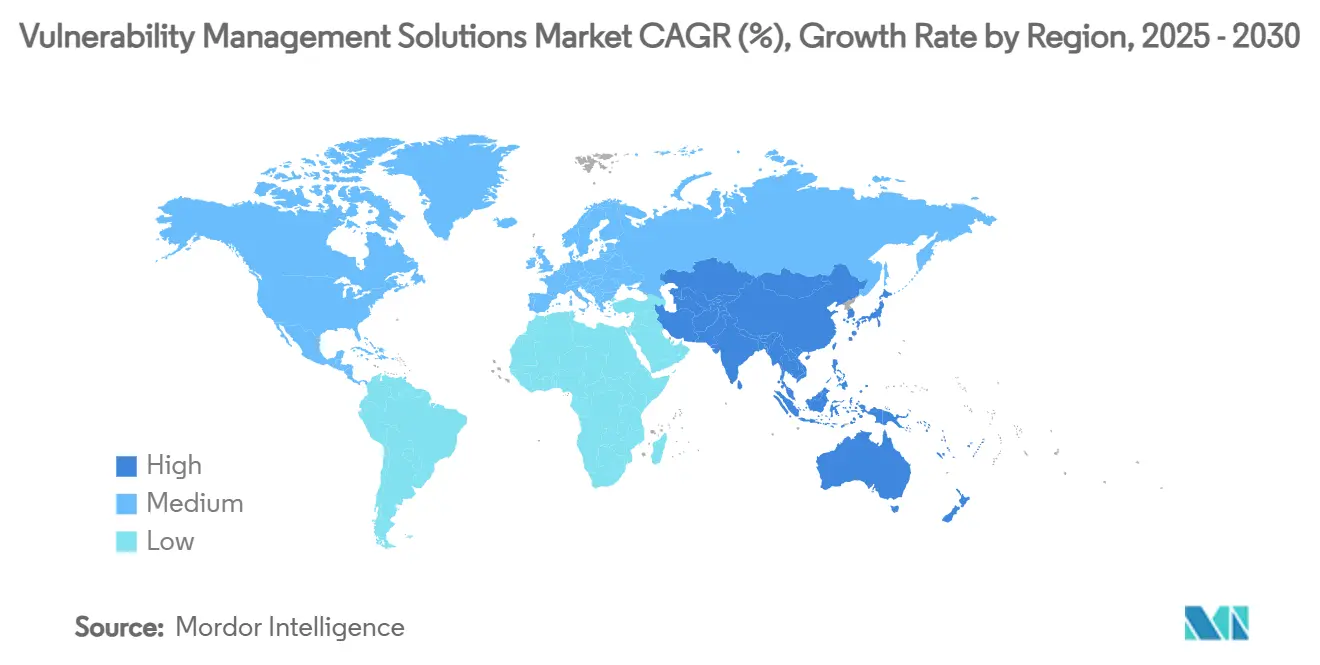
| Fastest Growing Market | Asia Pacific |
| Largest Market | North America |
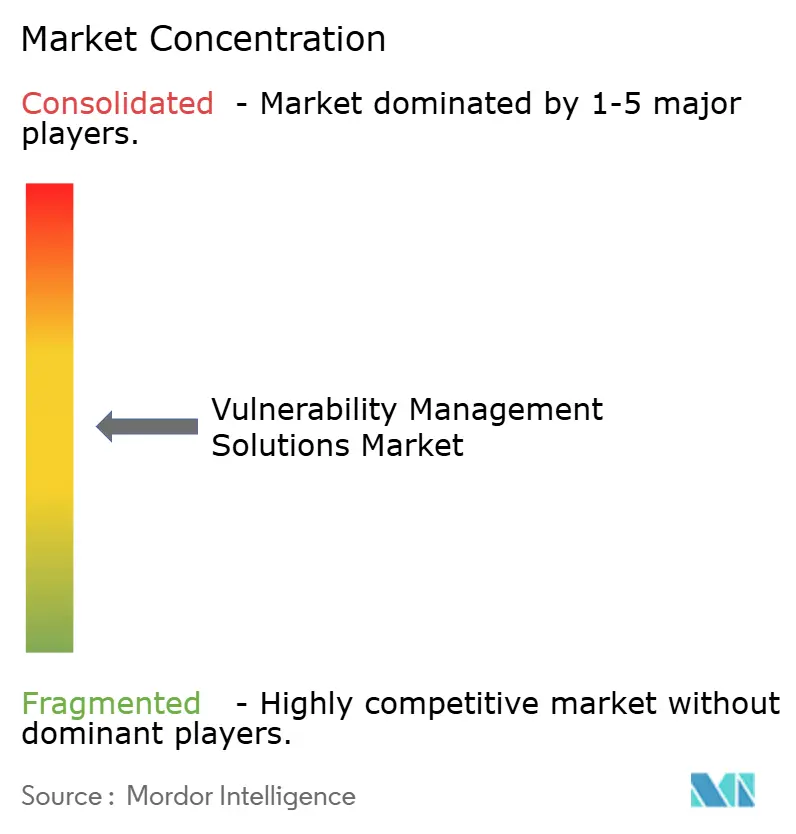
| Market Concentration | Medium |
Major Players *Disclaimer: Major Players sorted in no particular order Image © Mordor Intelligence. Reuse requires attribution under CC BY 4.0. | |
Vulnerability Management Solutions Market Analysis by Mordor Intelligence
The vulnerability management solutions market size is valued at USD 16.14 billion in 2025 and is projected to reach USD 24.08 billion by 2030, tracking an 8.0% CAGR through the period. Escalating AI-enabled threat sophistication, converging regulatory mandates, cloud-native architectures, and the ever-expanding IoT/OT attack surface fuel enterprise demand for continuous risk visibility and remediation. Platform convergence through high-value acquisitions is accelerating as vendors race to integrate exposure management, automated remediation, and risk quantification in a single stack. Healthcare, manufacturing, and government entities are tightening cyber-insurance underwriting requirements, while the shift to hybrid and multi-cloud environments is rewriting deployment priorities. Demand from small and medium enterprises (SMEs) is rising sharply as managed service providers democratize advanced tooling and offset global talent shortages.[1]ISC2, “Employers Must Act as Cybersecurity Workforce Growth Stalls and Skills Gaps Widen,” isc2.org
Key Report Takeaways
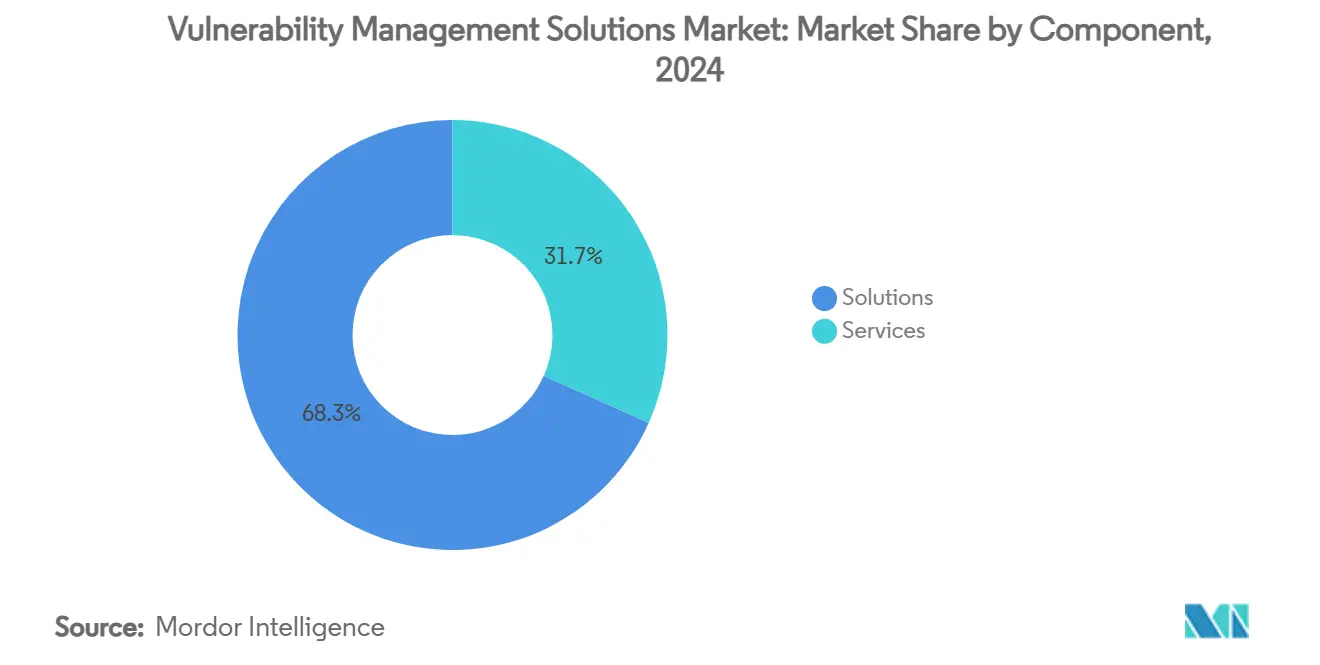
- By component, solutions led with 68.3% revenue share of the vulnerability management solutions market in 2024, whereas services are projected to expand at an 11.6% CAGR to 2030.
- By deployment mode, on-premises commanded a 60.3% share of the vulnerability management solutions market size in 2024, while cloud-based offerings are advancing at a 14.1% CAGR through 2030.
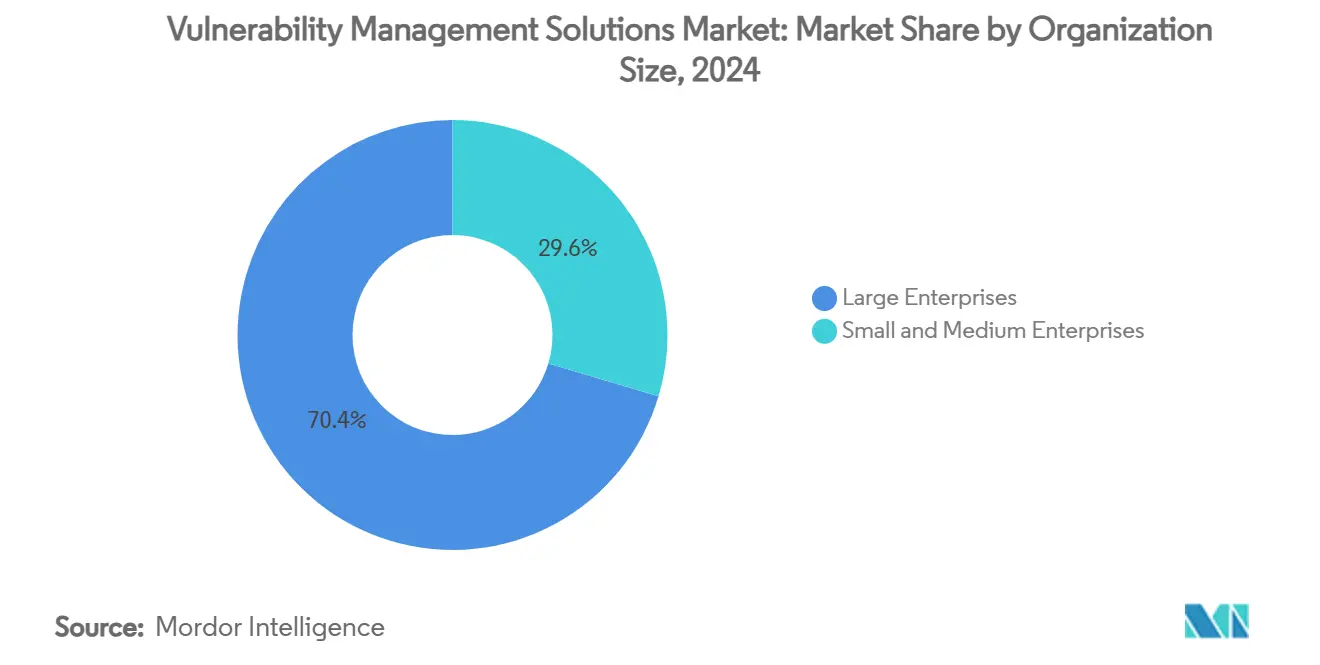
- By organization size, large enterprises accounted for 70.4% share of the vulnerability management solutions market size in 2024, and SMEs are poised to grow at a 12.1% CAGR between 2025–2030.
- By end-user industry, BFSI held 22.1% of the vulnerability management solutions market share in 2024; healthcare is forecast to register the fastest 13.3% CAGR to 2030.
- By geography, North America captured 38.2% of the vulnerability management solutions market in 2024, whereas Asia-Pacific is projected to rise at a 12.6% CAGR to 2030.
Global Vulnerability Management Solutions Market Trends and Insights
Drivers Impact Analysis*
| Driver | (~) % Impact on CAGR Forecast | Geographic Relevance | Impact Timeline |
|---|---|---|---|
| Rising frequency and sophistication of cyber-attacks | +2.1% | Global, with heightened impact in North America and Asia-Pacific | Short term (≤ 2 years) |
| Stringent regulatory compliance mandates | +1.8% | Europe and North America primary, expanding to Asia-Pacific | Medium term (2-4 years) |
| Cloud-native and DevOps adoption are driving continuous scanning | +1.5% | Global, led by North America and Europe | Medium term (2-4 years) |
| Expanding IoT/OT attack surface | +1.2% | Global, with manufacturing-heavy regions most affected | Long term (≥ 4 years) |
| Cyber-insurance underwriting requirements | +0.9% | North America and Europe, and emerging in the Asia-Pacific | Medium term (2-4 years) |
| Risk-quantification integration at the C-suite level | +0.7% | Primarily developed markets, expanding globally | Long term (≥ 4 years) |
| Source: Mordor Intelligence | |||
Rising Frequency and Sophistication of Cyber-Attacks
AI-powered phishing campaigns and deep-fake social engineering attacks targeted global financial institutions in 2024, bypassing legacy detection and underscoring the need for continuous assessment of new threat vectors. The operational technology sector logged 68 incidents with physical consequences in 2023, up 19% year-on-year, inflicting production losses that exceeded USD 450 million.[2]Waterfall Security Solutions, “2024 Threat Report,” waterfall-security.com Enterprise security budgets are rising 15% in 2025 to reach USD 212 billion, reflecting the consensus that reactive security models no longer protect dynamic digital estates. Adversarial use of generative AI has drastically lowered the cost of attack customization; converged vulnerability management, threat intelligence, and automated remediation are therefore moving from best practice to baseline.
Stringent Regulatory Compliance Mandates
The United States Securities and Exchange Commission now requires public companies to disclose material cybersecurity incidents promptly, converting vulnerability management into a board-level obligation. Europe’s DORA and NIS2 frameworks demand documented testing, regular vulnerability disclosure, and regulated remediation timelines for financial and essential services entities. Similar statutes—Malaysia’s Cyber Security Act 2024 and Hong Kong’s Critical Infrastructure Protection Bill—are proliferating across the Asia-Pacific. These laws collectively reposition continuous vulnerability assessment from optional control to mandatory compliance deliverable across BFSI, healthcare, and energy verticals.
Cloud-Native and DevOps Adoption Driving Continuous Scanning
Organizations deploying zero-trust architectures and DevSecOps pipelines—61% adoption in 2024—require platforms able to scan containers, serverless functions, and infrastructure-as-code on every commit. Migration to hybrid and multi-cloud models intensifies the need for unified asset discovery and risk scoring that spans AWS, Azure, and private clouds. Continuous integration/continuous deployment (CI/CD) frequencies of multiple releases per day render periodic scans obsolete, pushing vendors to embed APIs, shift-left plugins, and automated ticketing that provide developers with near-real-time feedback.
Expanding IoT/OT Attack Surface
Industrial firms integrating legacy programmable logic controllers with enterprise networks are exposing devices never designed for internet connectivity. Post-quantum cryptography issues further complicate remediation roadmaps for long-lifecycle industrial equipment. Skill shortages in combined OT and cyber domains force manufacturers to adopt managed vulnerability assessment services and segmented network architectures. Industry 5.0 initiatives linking human-machine collaboration and sustainability targets add privacy and data-integrity requirements to already complex industrial environments.
Restraints Impact Analysis*
| Restraint | (~) % Impact on CAGR Forecast | Geographic Relevance | Impact Timeline |
|---|---|---|---|
| Shortage of skilled cybersecurity professionals | -1.4% | Global, most acute in Asia-Pacific and emerging markets | Long term (≥ 4 years) |
| High total cost of ownership for large roll-outs | -0.8% | Cost-sensitive markets, SME segments globally | Medium term (2-4 years) |
| Alert fatigue and false-positive abandonment | -0.6% | Primarily developed markets with mature SOCs | Short term (≤ 2 years) |
| Data-sovereignty limits on centralized scanning | -0.4% | Europe, China, and emerging regulatory jurisdictions | Medium term (2-4 years) |
| Source: Mordor Intelligence | |||
Shortage of Skilled Cybersecurity Professionals
The global shortfall climbed to 4.8 million unfilled roles in 2024, constraining vulnerability management program scale-up and daily operations. Workforce growth stalled at 0.1% despite surging demand, leaving 28% of positions vacant and pushing salaries beyond many mid-market budgets. Industrial and healthcare sectors feel the pinch most acutely because they require rare dual-discipline expertise across OT systems and clinical devices. Burnout compounds the deficit—two-thirds of security leaders report high stress linked to excessive workloads, creating a cyclical drain on retention and productivity.
Alert Fatigue and False-Positive Abandonment
Mature security operations centers ingest millions of events daily, yet false-positive rates exceeding 70% desensitize analysts and elongate mean-time-to-respond. Tool sprawl aggravates overload by generating duplicative or conflicting alerts without unified prioritization. AI-augmented correlation engines promise relief but themselves introduce training challenges and new false-alert classes. The operational cost is dual: wasted analyst hours and missed true positives that slip through under-triaged queues, eroding stakeholder confidence in vulnerability management ROI.
*Our forecasts treat driver/restraint impacts as directional, not additive. The impact forecasts reflect baseline growth, mix effects, and variable interactions.
Segment Analysis
By Component: Services Gain Momentum in a Tool-Centric Landscape
Solutions retained 68.3% of the vulnerability management solutions market share in 2024, anchoring enterprise demand for comprehensive platforms that integrate scanning, prioritization, and orchestrated remediation.[3]Tenable Holdings, “Tenable Completes Acquisition of Vulcan Cyber,” tenable.com The segment-level vulnerability management solutions market size is projected to expand consistently on account of AI-enabled analytics, risk quantification dashboards, and rich ecosystem integrations. Services, however, are accelerating at an 11.6% CAGR to 2030 as organizations outsource to managed security providers to offset staffing gaps and guarantee program outcomes. Managed service contracts—spanning continuous assessment, compliance reporting, and incident response—are becoming embedded in long-term security budgets, shifting procurement conversations from product features to measurable resilience.
Second-order effects reinforce service adoption. Tenable’s USD 147 million Vulcan Cyber acquisition in 2025 illustrates the race to embed remediation orchestration within exposure-management offerings, thereby allowing service partners to deliver closed-loop risk-reduction SLAs. Platform complexity, meanwhile, fuels consulting demand for tool rationalization, workflow customization, and executive translation of technical findings into board-relevant risk metrics.


By Deployment Mode: Cloud Trajectory Accelerates Despite On-Premises Inertia
On-premises deployments held 60.3% of the vulnerability management solutions market size in 2024, anchored by data sovereignty, legacy tooling, and stringent regulatory constraints in the BFSI and government sectors. Yet cloud-based offerings are advancing at a 14.1% CAGR, reflecting enterprise migration toward SaaS consumption, elastic scalability, and rapid feature releases. Hybrid deployment flexibility is bridging the gap: platforms now offer on-premises scanners feeding anonymized metadata into cloud analytics engines to satisfy localization statutes such as the European Union’s evolving cloud certification regime.
Cost calculus is shifting as well. Cloud subscription models flatten capital expenditure and accelerate time-to-value, benefits especially attractive to SMEs and high-growth digital natives. Vendors differentiate via FedRAMP or ISO 27001 certifications and regionally partitioned data centers that reconcile performance with compliance.
By Organization Size: SME Uptake Democratizes Risk Visibility
Large enterprises accounted for 70.4% of revenue in 2024, leveraging mature security operations centers and regulatory obligations to justify investment in advanced analytics, risk scoring, and orchestration. However, SME adoption is rising at a 12.1% CAGR, signaling democratization of sophisticated capabilities once reserved for Fortune 1000 peers. Cloud-native SaaS delivery, freemium entry tiers, and cyber-insurance mandates are catalyzing adoption even where internal security teams remain skeletal. Platform vendors are simplifying dashboards, automating patch workflows, and bundling cyber-insurance premium discounts to court this long-tail opportunity.
By End-User Industry: Healthcare Surges While BFSI Remains Anchored
BFSI retained 22.1% of the vulnerability management solutions market in 2024, fueled by zero-tolerance risk postures, PCI-DSS 4.0 compliance, and high asset criticality. Healthcare’s 13.3% forecast CAGR makes it the fastest-growing vertical, as ransomware linked to patient-impact events prompts regulators and hospital boards to elevate vulnerability management budgets. Medical IoT devices, electronic health record migration, and telemedicine workflows demand asset discovery and continuous assessment well beyond traditional endpoints. Manufacturing, energy and utilities, and government segments contribute steady growth through OT convergence and critical-infrastructure directives.
Geography Analysis
North America led with a 38.2% share of the vulnerability management solutions market in 2024 on the back of mature regulatory frameworks, large-scale digital estates, and a dense vendor ecosystem. High-profile breaches and SEC disclosure rules keep boardroom urgency elevated, sustaining double-digit budget growth. Europe maintained solid demand as GDPR, NIS2, and DORA drive continuous scanning mandates across financial, energy, and healthcare sectors, yet sovereignty debates over centralized cloud scanning spur hybrid architectures.[4]John Salmon, Louise Crawford, Lavan Thasarathakumar, Daniel Lee, Alex Nicol, and Joyce Hoi Wun Leung, “EUCS: Controversial Sovereignty Issues Continue to Drive Debate for Cloud Services,” Hogan Lovells, hoganlovells.com
Asia-Pacific is projected to outpace other regions at a 12.6% CAGR, buoyed by rapid cloud adoption, e-commerce expansion, and new legislation such as Malaysia’s Cyber Security Act 2024. The region’s cyber-insurance market is growing nearly 50% annually, and carriers increasingly condition coverage on verifiable vulnerability management programs. Government-led Industry 4.0 subsidies in Japan, South Korea, and Singapore further expand the addressable base among manufacturing and critical-infrastructure operators.
The Middle East and Africa are emerging growth theaters as smart-city investments, energy diversification projects, and sovereign cloud strategies take hold. Large state-owned enterprises prioritize risk quantification and OT asset protection, creating lighthouse deployments that regional mid-market firms emulate. Latin America follows a similar pattern; large financial institutions adopt continuous scanning to meet cross-border compliance, while fintech startups leverage cloud-native platforms for speed and cost efficiency.

Competitive Landscape
The vulnerability management solutions market is moderately consolidated yet highly dynamic. Tenable, Qualys, and Rapid7 remain core exposure-management incumbents, competing on scan accuracy, unified asset inventory, and AI-driven prioritization. Cisco’s USD 28 billion integration of Splunk fuses network visibility with SIEM/SOAR analytics, enlarging the attack-surface management value proposition. Palo Alto Networks’ purchase of IBM’s QRadar cloud assets underscores incumbents’ push into converged security operations platforms that encompass vulnerability data.
Strategic differentiation pivots around three axes: 1) embedded risk quantification that translates CVE counts into financial exposure, 2) autonomous remediation via ticketing and patch orchestration, and 3) OT and cloud-native posture management depth. Vendor roadmaps now extend beyond quarterly vulnerability scans toward continuous exposure management aligned with cyber-insurance and regulatory attestations. Disruptors target cloud container security, attack-path analysis, and AI explainability, often licensing engines to larger platforms hungry for specialized capabilities. Market entry barriers remain moderate due to open-source scanners, but scaling requires expansive vulnerability intelligence and partner ecosystems.
Acquisition activity will likely persist as platform vendors plug capability gaps and private-equity funds consolidate niche players. Given that the top five providers collectively hold roughly 45% of global revenue, the market garners a concentration score of 5, denoting a competitive yet not fragmented landscape.
Vulnerability Management Solutions Industry Leaders
Tenable Holdings Inc.
Qualys Inc.
Rapid7 Inc.
Skybox Security Inc.
Tripwire Inc. (Belden)
- *Disclaimer: Major Players sorted in no particular order

Recent Industry Developments
- June 2025: Tenable announced plans to acquire AI startup Apex Security to widen coverage of AI-driven attack surfaces.
- February 2025: Tenable completed its acquisition of Vulcan Cyber for USD 147 million, adding AI-powered risk prioritization and automated remediation workflows.
- January 2025: Tenable agreed to buy CNAPP vendor Ermetic, extending multi-cloud protection across containers and serverless workloads.
- October 2024: Tenable reported Q3 2024 revenue of USD 227.1 million, up 13% year-on-year, and unveiled AI Aware for detecting AI-related vulnerabilities.


Global Vulnerability Management Solutions Market Report Scope
| Solutions |
| Services |
| On-premise |
| Cloud-based |
| Small and Medium Enterprises |
| Large Enterprises |
| BFSI |
| IT and Telecom |
| Healthcare |
| Government and Defense |
| Retail and E-commerce |
| Energy and Utilities |
| Manufacturing |
| North America | United States | |
| Canada | ||
| Mexico | ||
| South America | Brazil | |
| Argentina | ||
| Rest of South America | ||
| Europe | United Kingdom | |
| Germany | ||
| France | ||
| Italy | ||
| Spain | ||
| Russia | ||
| Rest of Europe | ||
| Asia-Pacific | China | |
| Japan | ||
| India | ||
| South Korea | ||
| ASEAN | ||
| Rest of Asia-Pacific | ||
| Middle East and Africa | Middle East | Saudi Arabia |
| United Arab Emirates | ||
| Turkey | ||
| Rest of Middle East | ||
| Africa | South Africa | |
| Egypt | ||
| Rest of Africa | ||
| By Component | Solutions | ||
| Services | |||
| By Deployment Mode | On-premise | ||
| Cloud-based | |||
| By Organization Size | Small and Medium Enterprises | ||
| Large Enterprises | |||
| By End-user Industry | BFSI | ||
| IT and Telecom | |||
| Healthcare | |||
| Government and Defense | |||
| Retail and E-commerce | |||
| Energy and Utilities | |||
| Manufacturing | |||
| By Geography | North America | United States | |
| Canada | |||
| Mexico | |||
| South America | Brazil | ||
| Argentina | |||
| Rest of South America | |||
| Europe | United Kingdom | ||
| Germany | |||
| France | |||
| Italy | |||
| Spain | |||
| Russia | |||
| Rest of Europe | |||
| Asia-Pacific | China | ||
| Japan | |||
| India | |||
| South Korea | |||
| ASEAN | |||
| Rest of Asia-Pacific | |||
| Middle East and Africa | Middle East | Saudi Arabia | |
| United Arab Emirates | |||
| Turkey | |||
| Rest of Middle East | |||
| Africa | South Africa | ||
| Egypt | |||
| Rest of Africa | |||


Key Questions Answered in the Report
What is the projected value of the vulnerability management solutions market in 2030?
The market is forecast to reach USD 24.08 billion by 2030.
Which region will grow the fastest through 2030?
Asia-Pacific is expected to register a 12.6% CAGR, the fastest worldwide.
Why are services expanding faster than solutions?
Organizations rely on managed security services to offset talent shortages and secure outcome-based vulnerability reduction.
How are regulatory changes influencing adoption?
New mandates such as SEC incident-disclosure rules and Europe’s DORA elevate continuous vulnerability management from optional to compulsory control.
Which end-user vertical is poised for the highest growth?
Healthcare is projected to grow at a 13.3% CAGR due to patient-safety imperatives and stringent privacy regulations.
What drives the shift toward cloud-based deployments?
Hybrid and multi-cloud strategies require scalable, SaaS-delivered scanning with unified visibility across distributed assets.
Page last updated on:


