Size and Share of Big Data Analytics Market In Manufacturing Industry
Market Overview
| Study Period | 2019 - 2030 |
|---|---|
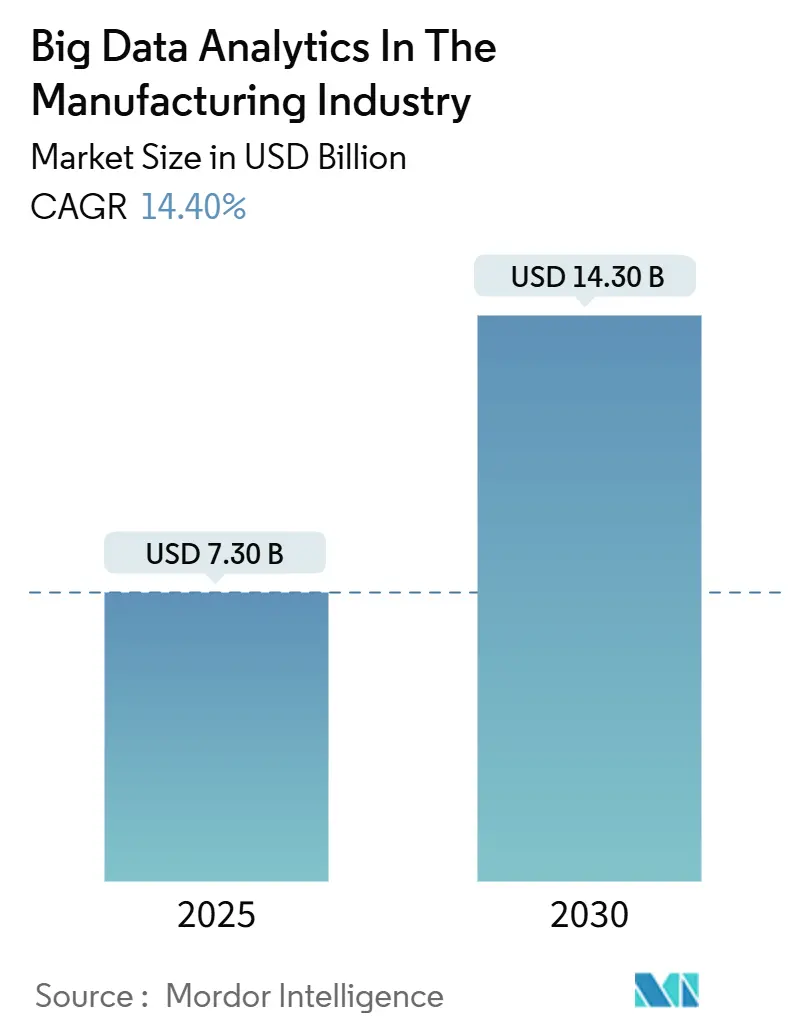
| Market Size (2025) | USD 7.30 Billion |
| Market Size (2030) | USD 14.30 Billion |
| Growth Rate (2025 - 2030) | 14.40% CAGR |
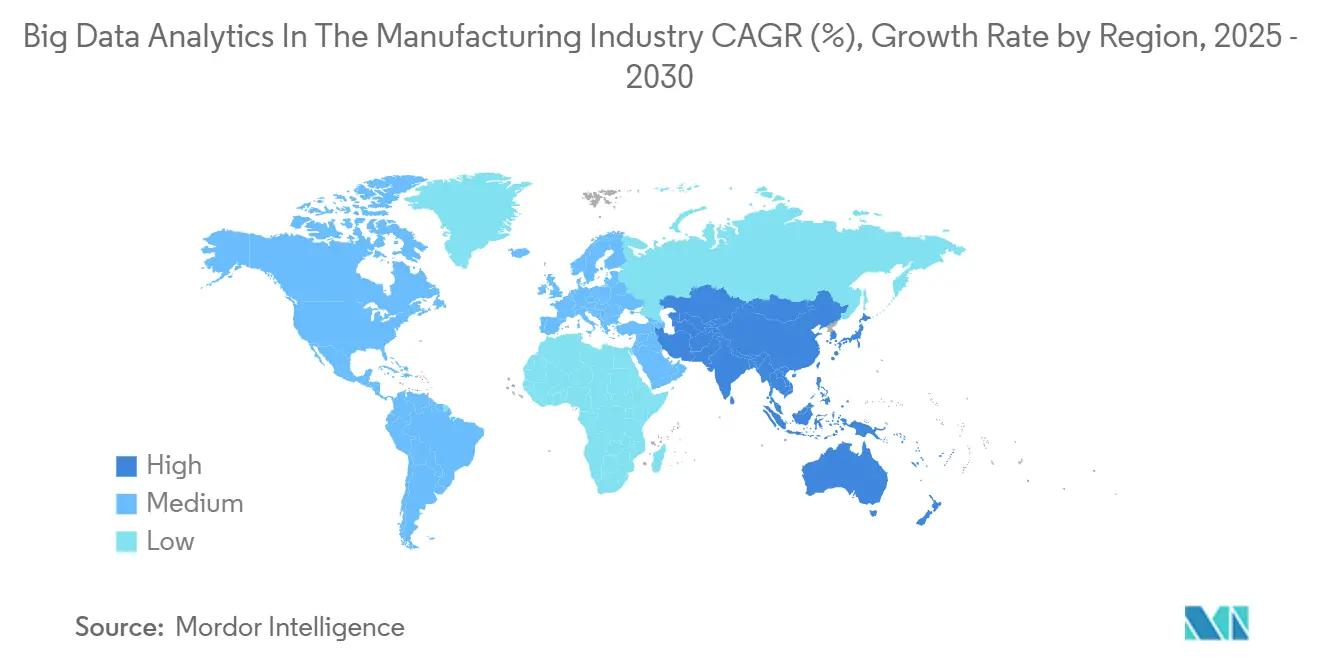
| Fastest Growing Market | Asia Pacific |
| Largest Market | North America |
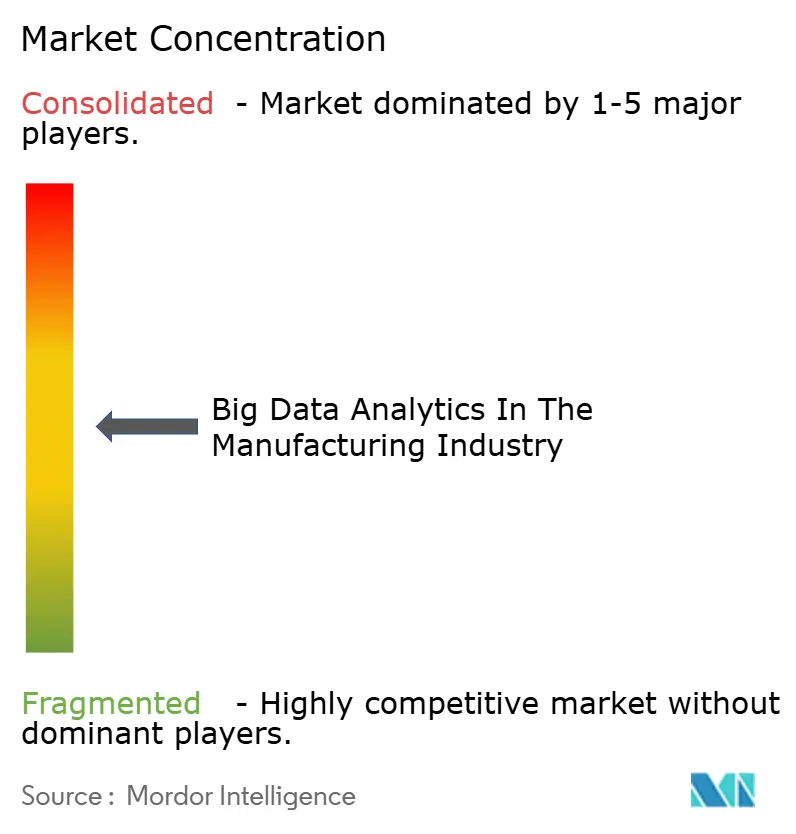
| Market Concentration | Medium |
Major Players *Disclaimer: Major Players sorted in no particular order Image © Mordor Intelligence. Reuse requires attribution under CC BY 4.0. | |
Analysis of Big Data Analytics Market In Manufacturing Industry by Mordor Intelligence
The big data analytics in the manufacturing industry market stood at USD 7.30 billion in 2025 and is forecast to reach USD 14.30 billion by 2030, registering a 14.40% CAGR. The market size expansion mirrors manufacturers’ urgency to convert shop-floor data into real-time intelligence that trims downtime, raises yield, and cushions raw-material volatility. Much of the momentum comes from the convergence of Industrial Internet of Things (IIoT) sensors, edge computing nodes, and AI algorithms that shift analytics from the cloud toward the production line itself. Investments in software-defined control, digital twins, and zero-touch quality inspection are accelerating, while ongoing supply-chain shocks since 2024 keep analytics high on the C-suite agenda. At the same time, geopolitical re-shoring programs are prompting factories to automate faster to counter labor constraints and rising energy costs.
Key Report Takeaways
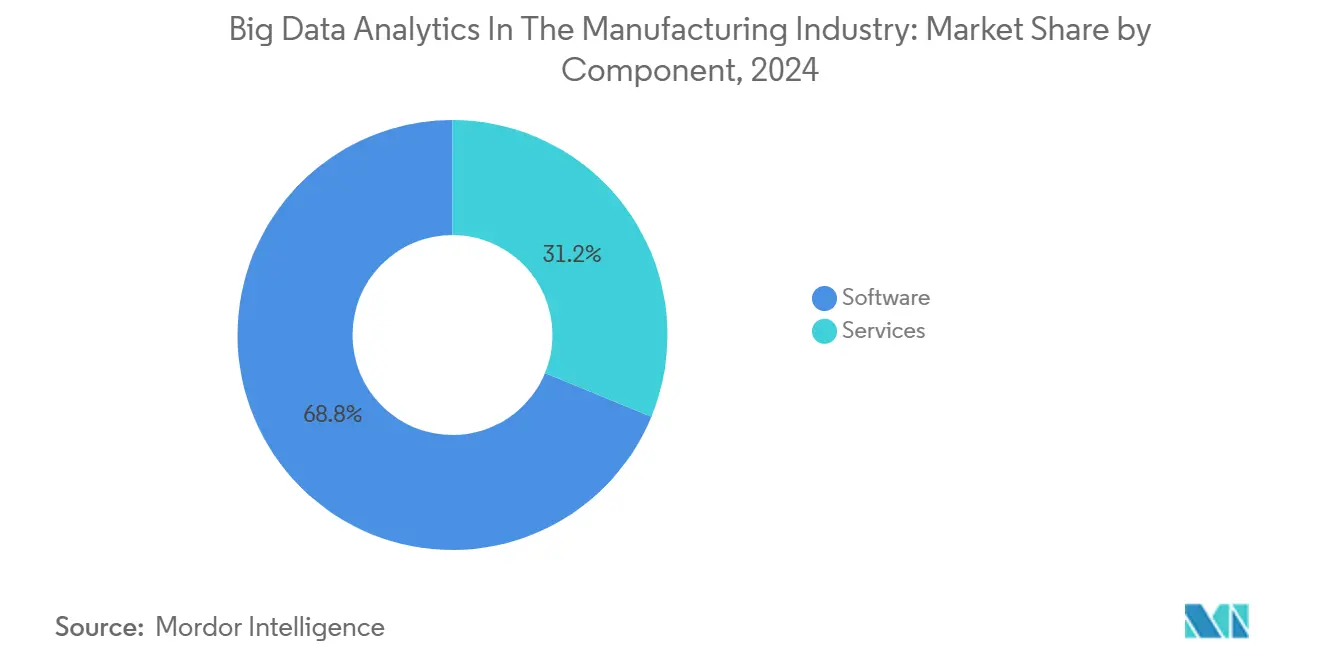
- By component, software captured 68.8% of the big data analytics in the manufacturing industry market share in 2024, whereas services are projected to post the fastest 16.2% CAGR to 2030.
- By deployment mode, on-premise solutions held 52.6% of the big data analytics in the manufacturing industry market size in 2024, while cloud deployments are forecast to expand at a 16.7% CAGR through 2030.
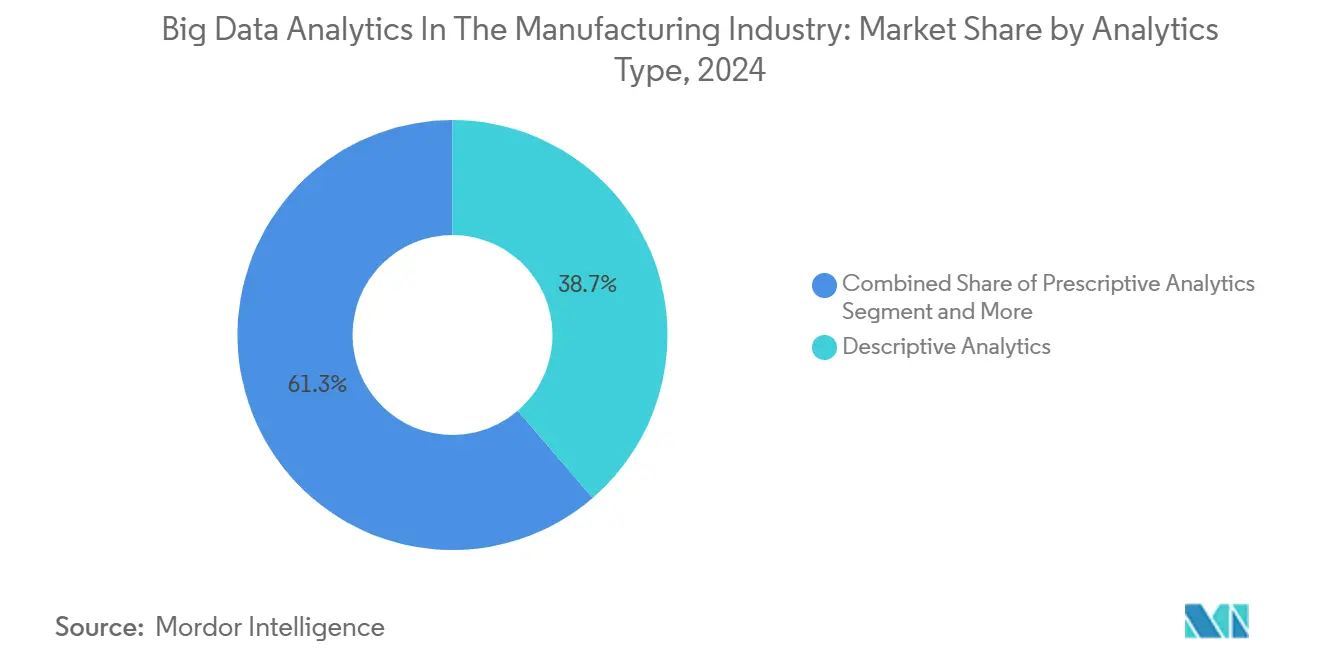
- By analytics type, descriptive analytics commanded 38.7% revenue share of the big data analytics in the manufacturing industry in 2024; prescriptive analytics leads growth at a 15.4% CAGR to 2030.
- By data type, structured data accounted for 58.7% of the big data analytics in the manufacturing industry market size in 2024, and unstructured data is advancing at a 15.7% CAGR through 2030.
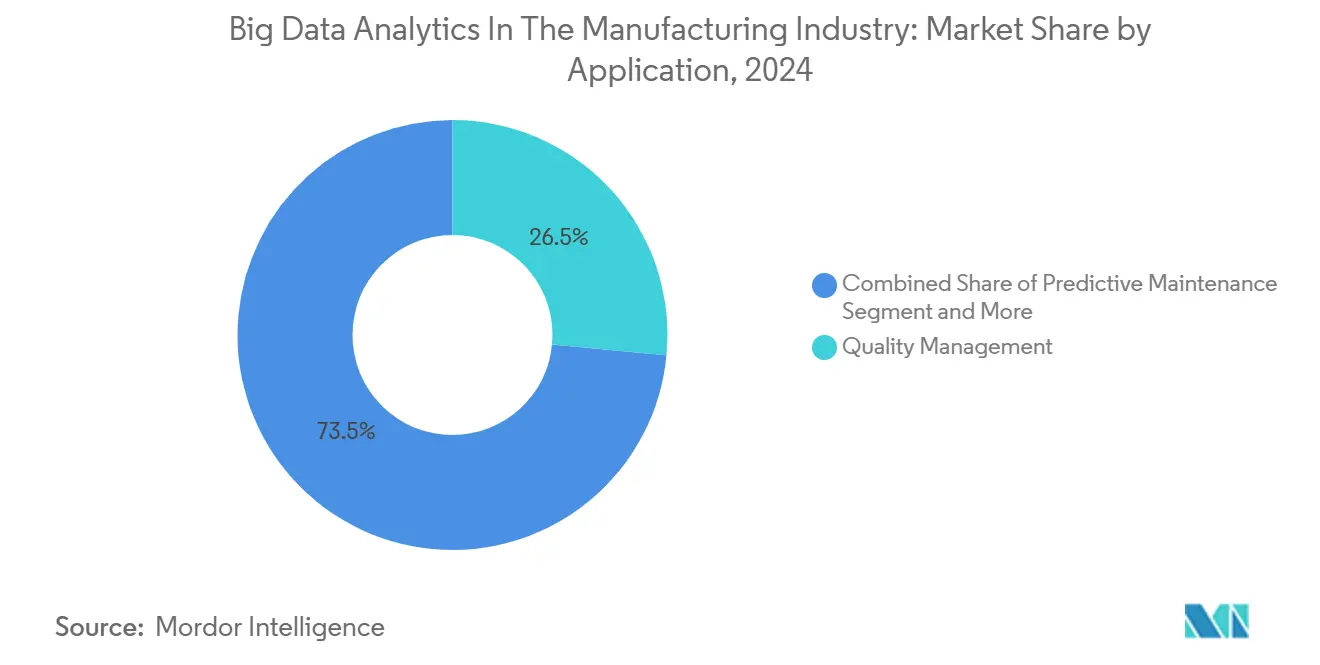
- By application, quality management led with 26.5% revenue share of the big data analytics in the manufacturing industry in 2024; predictive maintenance is projected to rise at a 15.1% CAGR to 2030.
- By end-user, automotive held 28.5% of the big data analytics in the manufacturing industry market size in 2024, whereas semiconductor and electronics will record the fastest 15.3% CAGR to 2030.
- By geography, North America dominated with 38.8% revenue share of the big data analytics in the manufacturing industry in 2024; Asia-Pacific is forecast to progress at a 15.2% CAGR through 2030.
Insights and Trends of Big Data Analytics Market In Manufacturing Industry
Drivers Impact Analysis*
| Driver | (~) % Impact on CAGR Forecast | Geographic Relevance | Impact Timeline |
|---|---|---|---|
| Technology-centric value chain integration | +2.8% | North America and Europe | Medium term (2-4 years) |
| Rapid Industry 4.0 automation | +3.2% | Asia-Pacific core; spill-over worldwide | Long term (≥4 years) |
| IIoT-enabled edge analytics uptake | +2.5% | Developed markets globally | Short term (≤2 years) |
| Digital twin adoption | +1.9% | North America and Europe; expanding Asia-Pacific | Medium term (2-4 years) |
| Smart-sensor proliferation | +2.1% | Global manufacturing hubs | Short term (≤2 years) |
| OEM data-as-a-service models | +1.5% | North America and Europe | Long term (≥4 years) |
| Source: Mordor Intelligence | |||
Evolving Technology-Centric Value Chain
Manufacturers are pivoting from discrete automation islands toward unified, asset-centric data fabrics that stitch engineering, production, and after-sales insights into one continuous loop. Siemens’ 2024 launch of the Simatic Automation Workstation lets plants replace fixed hardware PLCs with containerized software logic, unifying IT and operational technology while lowering changeover time.[1]Siemens, “Simatic Automation Workstation,” siemens.com Automotive early adopter Ford demonstrated software-defined assembly cells that swap vehicle variants in minutes instead of hours, reducing tooling inventory and enabling bespoke production runs. Such integration fuels predictive maintenance programs that stretch equipment life and defer large capital outlays. Simultaneously, circular-economy mandates are nudging OEMs to capture lifecycle data for remanufacturing revenue, turning analytics platforms into profit centers rather than cost items.
Rapid Industrial Automation Led by Industry 4.0
Asia-Pacific factories are spearheading full-scale Industry 4.0 rollouts as wage inflation compresses traditional cost advantages. Hyundai’s Chennai plant reported a 5% cut in unplanned maintenance hours after fitting AI-ready smart sensors across machining centers. India’s national Manufacturing 4.0 roadmap projects productivity gains of 1.4% each year and savings equivalent to 749 billion work-hours once 64% of repetitive tasks are automated. Similar momentum in Vietnam and Thailand underscores a regional shift from labor-arbitrage toward technology-arbitrage, spawning demand for cloud-native analytics suites that orchestrate thousands of cyber-physical assets while satisfying export-market traceability norms.
Growing Proliferation of IIoT-Enabled Edge Analytics
Edge compute nodes are overtaking centralized cloud stacks for mission-critical analytics that cannot tolerate WAN latencies. TDK’s ultracompact i3 Micro Module embeds vibration, temperature, and current sensors alongside an ARM-based AI core, enabling condition-based maintenance on battery-powered assets without wired power or networking.[2]TDK Corporation, “Predicting Anomalies Before Breakdowns Occur: Ultracompact Sensor Module Redefines the Status Quo of Equipment Maintenance,” tdk.com Rockwell Automation’s 2025 Embedded Edge Compute Module adds REST, OPC UA, and MQTT pathways so plant operators can federate edge insights into enterprise historians without rewriting code. Manufacturers cite lower bandwidth fees, enhanced IP protection, and deterministic millisecond response as top benefits, especially in industries like packaging, where a 200-millisecond delay can jam a high-speed line.
Rise of Digital Twins Driving Data Granularity
Digital twins have matured from CAD-linked 3D models into high-fidelity process simulators that forecast yield swings under thousands of variable permutations. A large Indian fiber-cement producer integrated its kiln, grinder, and packaging lines into a cloud-hosted twin that slashed energy use and stabilized clinker composition despite volatile limestone quality. Such hyper-granular visibility elevates decision-making from reactive adjustments to scenario-tested optimizations that save raw-material spend, accounting for 80% of cost of goods sold. In North America, chemicals majors deploy twins to rehearse catalyst changes virtually, trimming pilot-plant timelines by months and reducing off-spec outputs.
Restraints Impact Analysis*
| Restraint | (~) % Impact on CAGR Forecast | Geographic Relevance | Impact Timeline |
|---|---|---|---|
| Cyber-security concerns and limited awareness | -1.8% | Emerging markets | Short term (≤2 years) |
| Shortage of data-science talent | -2.1% | Developed economies | Medium term (2-4 years) |
| Legacy equipment and data silos | -1.5% | North America and Europe | Long term (≥4 years) |
| Rising cloud egress charges | -0.9% | Global | Short term (≤2 years) |
| Source: Mordor Intelligence | |||
Lack of Awareness and Cyber-Security Concerns
Manufacturing ranked as the most-attacked vertical in 2024, accounting for 68% of all industrial cyber incidents. Average breach costs touched USD 4.88 million, prompting board-level caution toward cloud or remote connectivity projects. One-third of plant executives cite fear of exposing operational technology (OT) networks as the primary reason for delaying analytics deployments. Vendors respond with zero-trust architectures, encrypted data pockets, and sovereign-cloud instances, yet many small plants still view cybersecurity budgets as discretionary.
Shortage of Data-Science Talent with Domain Expertise
The U.S. alone may see 2.1 million unfilled manufacturing posts by 2030, many tied to analytics and automation roles. Pure data scientists often lack a contextual grasp of takt-time, overall equipment effectiveness, or regulatory validation, resulting in models that miss shop-floor realities. Upskilling programs with community colleges and vendor academies are expanding, yet pipeline growth lags market demand. Consequently, managed-service contracts flourish as factories outsource algorithm tuning and model retraining to specialist partners.
*Our forecasts treat driver/restraint impacts as directional, not additive. The impact forecasts reflect baseline growth, mix effects, and variable interactions.
Segment Analysis
By Component: Services Rise as Deployment Complexity Grows
Software kept its 68.8% revenue lead in 2024, anchored by historians, data-integration hubs, and AI platforms embedded within the big data analytics in the manufacturing industry market. Yet services will grow fastest at 16.2% CAGR as factories seek domain specialists to stitch these tools into legacy MES and SCADA stacks. Consulting engagements now span value-stream mapping, sensor placement, and model governance, reflecting recognition that out-of-the-box software cannot deliver sustainable value alone. Managed services for digital twin upkeep and predictive algorithms are gaining traction under outcome-based pricing, especially among tier-2 suppliers lacking analytics headcount.
A telling indicator is multiyear transformation deals where service revenue exceeds license fees by the third contract year. Systems integrators bundle cybersecurity hardening, edge-node orchestration, and continuous model monitoring, reducing total integration risk. Vendors quick to offer co-innovation labs and joint proof-of-concept funding are capturing wallet share as customers move from single-use pilot projects to plant-wide rollouts.


By Deployment Mode: Hybrid Edges Out Pure On-Premise
On-premise deployments retained a 52.6% share in 2024, cementing their role for deterministic control and intellectual-property protection within the big data analytics in the manufacturing industry market. However, cloud-native deployments will rise 16.7% annually on the back of elastic GPU availability for complex model training. Most manufacturers are converging on hybrid topologies: latency-sensitive workloads run on edge servers or local micro-data centers, while long-horizon planning and cross-site benchmarking run in regional clouds. This architecture offers the best of both—local autonomy and global coordination.
Cloud providers, meanwhile, introduce sector-specific regions with compliance templates such as ITAR or GxP, easing regulatory qualms in aerospace and pharmaceuticals. Simultaneously, cloud-delivered low-code AI pipelines shrink model-development cycles, encouraging smaller plants to migrate test-and-learn experiments to off-premise sandboxes before back-hauling distilled inference engines to edge gateways.
By Analytics Type: Prescriptive Becomes the New North Star
Descriptive dashboards anchored 38.7% of 2024 revenue, but prescriptive engines are pacing ahead with a 15.4% CAGR through 2030 as the big data analytics in the manufacturing industry market evolves from what-happened to what-should-happen. Diagnostic and predictive tiers remain stepping-stones; yet factories increasingly budget directly for prescriptive pilots that auto-tune oven set-points, adjust robot speeds, or reorder consumables without human touch. Hindustan Zinc’s ore-beneficiation line, for instance, embedded AI agents that continually balance reagent mix against throughput, lifting recovery yield and trimming reagent spend. Success stories like this legitimize prescriptive ROI among finance controllers skeptical of soft-metric paybacks.
Algorithm transparency is rising too: vendors expose cause-and-effect graphs rather than black-box outputs, easing operator trust and regulatory validation. Continuous-learning pipelines retrain models on live edge data, keeping recommendations fresh amid SKU proliferation or material changes.

By Data Type: Unstructured Signals Move Center Stage
Structured sensor tags still dominate with 58.7% share, yet unstructured content, images, audio, and free-text maintenance notes, will register a 15.7% CAGR. Advances in industrial computer vision and natural-language processing unlock latent value once trapped in paper logs or human visual inspection. For example, high-resolution camera arrays spot micron-level solder defects invisible to human inspectors running at 400 boards per minute, thereby preventing downstream RMA costs.
The shift pushes storage architectures toward object stores capable of petabyte-scale video retention, while edge GPUs compress images for bandwidth-friendly summary analytics. Text-mining of operator shift notes uncovers chronic stoppage causes, feeding continuous-improvement Kaizen boards with data-backed evidence rather than anecdotal observations.
By Application: Predictive Maintenance Complements Quality Leadership
Quality management remained the top use case at 26.5% share during 2024, given regulatory and warranty imperatives. Predictive maintenance, however, is set to jump ahead at a 15.1% CAGR—evidence of boardroom appetite to slash unplanned downtime that can cost USD 220,000 per hour on an automotive paint line. Augury’s 2024 Edge-AI machine-health sensor demonstrated bearing-failure alerts seven days in advance on a plastics extruder, sparing expensive overtime shifts. Energy-intensive industries pair predictive insights with process-optimization modules that schedule maintenance during low-tariff periods, magnifying savings.
Inventory and supply-chain optimization use cases are also scaling fast amid post-pandemic raw-material shocks. AI-assisted forecasts cut buffer stock yet maintain service levels, releasing working capital for other digital initiatives.
By End-User Industry: Semiconductor Drives Next Wave
Automotive sustained a 28.5% share in 2024, anchoring its dominance in the big data analytics in the manufacturing industry market due to long-running telematics and Six-Sigma culture. Still, semiconductor and electronics will grow 15.3% annually as wafer fabs chase sub-10 nm yields requiring atomic-level process control. GlobalFoundries’ 2025 earnings showed a 45% revenue lift in datacenter chiplets, partly attributed to analytics that optimize lithography parameters across multiphase etch sequences. Elsewhere, aerospace primes deploy digital twins for engine-health prediction synced to in-flight sensor feeds, while food and beverage plants harness computer vision to assure label integrity and allergen compliance.
Regulated sectors like pharmaceuticals integrate analytics into quality-by-design frameworks, with batch-record digitization paving the path for lights-out manufacturing suites that meet stringent validation rules.
Geography Analysis
North America dominated the big data analytics in the manufacturing industry market with 38.8% revenue share in 2024. U.S. aerospace, chemicals, and heavy-equipment makers continue to pilot edge AI for zero-defect programs, while Canadian miners adopt energy-optimization analytics to offset carbon-pricing schemes. Mexico’s export-oriented auto assemblers deploy real-time SPC dashboards to meet OEM just-in-time mandates, cementing the region’s high-value manufacturing position.
Asia-Pacific is poised for the quickest expansion, recording a forecast 15.2% CAGR to 2030. India’s Manufacturing 4.0 policy offers tax credits on connected machinery, spurring adoption even among tier-3 suppliers. Chinese smart-factory subsidies accelerate 5G and edge rollouts, letting factories run closed-loop quality control off private networks. Japan applies analytics to precision machining, where micron-level deviations jeopardize reputation. Singapore and Malaysia, meanwhile, brand themselves as analytics hubs, hosting regional IIoT sandboxes tied to semiconductor giants.
Europe remains a stronghold courtesy of Germany’s Industrie 4.0 leadership and stringent sustainability directives. Bosch earmarked EUR 2.5 billion for AI over three years, channeling funds into plant-wide digital twins that curb scrap and energy usage.[3]Bosch, “Bosch Invests EUR 2.5 Billion in AI,” bosch.com UK manufacturers post-Brexit leverage analytics for productivity offsets, whereas Italian luxury-goods workshops employ computer vision for artisanal quality checks. Nordic foundries use real-time emissions dashboards to meet EU carbon border adjustment proposals, showcasing analytics’ role in regulatory agility.

Competitive Landscape
The competitive terrain is fragmented, with the top five suppliers controlling a significant share of global revenue, leaving ample whitespace for niche innovators. Siemens, Rockwell Automation, and ABB utilize installed OT footprints to cross-sell analytics suites, bundling secure gateways and digital service agreements. Microsoft and Oracle pitch hyperscale AI models fine-tuned for process data, while IBM integrates quantum-inspired optimizers for complex production scheduling.
Partnerships highlight an architectural pivot toward edge-first strategies. Qualcomm’s 2025 alliance with Palantir embeds ontology-driven knowledge graphs into 5G industrial gateways, allowing algorithm training at the asset layer.[4]Qualcomm, “Qualcomm & Palantir Expand AI and Ontology for Edge Industrial IoT,” qualcomm.comMeanwhile, Emerson’s Test and Measurement acquisition bolsters signal-analysis depth for high-speed rotating equipment.
Consolidation is anticipated as OT and IT vendors vie to own the unified data backbone. Acquisition multiples hover near 7 times forward revenue for AI-native firms with proven reference customers, urging early movers to lock in positions before valuations climb further. Vendors able to demonstrate integration speed, cyber-resilience, and transparent ROI are poised to outpace pure-play analytics startups that lack domain expertise.
Leaders of Big Data Analytics Market In Manufacturing Industry
ABB Ltd.
Alteryx Inc.
Altair Engineering Inc. (RapidMiner)
Aspen Technology Inc.
Bosch Rexroth AG
- *Disclaimer: Major Players sorted in no particular order

Recent Industry Developments
- March 2025: Qualcomm and Palantir broadened their edge-AI pact to embed ontology-based context models in industrial gateways, targeting sub-second decision loops.
- February 2025: Siemens closed a USD 10 billion buyout of Altair Engineering to fuse simulation and analytics into its Xcelerator portfolio.
- January 2025: Emerson reported FY 2024 net sales of USD 17.492 billion after integrating Test and Measurement assets that strengthen analytics depth.
- December 2024: ABB rolled out a software suite that marries big-data analytics with legacy automation, easing contextualized data integration.
- November 2024: Augury debuted the first edge-AI-native machine-health sensor, providing sub-second vibration analysis without cloud dependency.


Scope of Report on Big Data Analytics Market In Manufacturing Industry
| Software | Data Management and Integration Platforms |
| Advanced Analytics Platforms | |
| Services | Professional Services |
| Managed Services |
| On-premise |
| Cloud |
| Edge/Fog |
| Descriptive Analytics |
| Diagnostic Analytics |
| Predictive Analytics |
| Prescriptive Analytics |
| Structured |
| Unstructured |
| Semi-Structured |
| Quality Management |
| Condition Monitoring |
| Predictive Maintenance |
| Inventory and Supply-chain Optimization |
| Energy Management |
| Production Planning and Scheduling |
| Process Optimization |
| Automotive |
| Semiconductor and Electronics |
| Aerospace and Defense |
| Food and Beverage |
| Chemicals and Materials |
| Pharmaceuticals and Life Sciences |
| Heavy Machinery and Equipment |
| Other End-user Industries |
| North America | United States | |
| Canada | ||
| Mexico | ||
| South America | Brazil | |
| Argentina | ||
| Chile | ||
| Rest of South America | ||
| Europe | Germany | |
| United Kingdom | ||
| France | ||
| Italy | ||
| Spain | ||
| Rest of Europe | ||
| Asia-Pacific | China | |
| Japan | ||
| India | ||
| South Korea | ||
| Australia | ||
| Singapore | ||
| Malaysia | ||
| Rest of Asia-Pacific | ||
| Middle East and Africa | Middle East | Saudi Arabia |
| United Arab Emirates | ||
| Turkey | ||
| Rest of Middle East | ||
| Africa | South Africa | |
| Nigeria | ||
| Rest of Africa | ||
| By Component | Software | Data Management and Integration Platforms | |
| Advanced Analytics Platforms | |||
| Services | Professional Services | ||
| Managed Services | |||
| By Deployment Mode | On-premise | ||
| Cloud | |||
| Edge/Fog | |||
| By Analytics Type | Descriptive Analytics | ||
| Diagnostic Analytics | |||
| Predictive Analytics | |||
| Prescriptive Analytics | |||
| By Data Type | Structured | ||
| Unstructured | |||
| Semi-Structured | |||
| By Application | Quality Management | ||
| Condition Monitoring | |||
| Predictive Maintenance | |||
| Inventory and Supply-chain Optimization | |||
| Energy Management | |||
| Production Planning and Scheduling | |||
| Process Optimization | |||
| By End-user Industry | Automotive | ||
| Semiconductor and Electronics | |||
| Aerospace and Defense | |||
| Food and Beverage | |||
| Chemicals and Materials | |||
| Pharmaceuticals and Life Sciences | |||
| Heavy Machinery and Equipment | |||
| Other End-user Industries | |||
| By Geography | North America | United States | |
| Canada | |||
| Mexico | |||
| South America | Brazil | ||
| Argentina | |||
| Chile | |||
| Rest of South America | |||
| Europe | Germany | ||
| United Kingdom | |||
| France | |||
| Italy | |||
| Spain | |||
| Rest of Europe | |||
| Asia-Pacific | China | ||
| Japan | |||
| India | |||
| South Korea | |||
| Australia | |||
| Singapore | |||
| Malaysia | |||
| Rest of Asia-Pacific | |||
| Middle East and Africa | Middle East | Saudi Arabia | |
| United Arab Emirates | |||
| Turkey | |||
| Rest of Middle East | |||
| Africa | South Africa | ||
| Nigeria | |||
| Rest of Africa | |||


Key Questions Answered in the Report
What is the forecast value for big data analytics in manufacturing by 2030?
The big data analytics in the manufacturing industry market is projected to reach USD 14.30 billion by 2030.
Which region will grow fastest through 2030?
Asia-Pacific is expected to post the quickest 15.2% CAGR thanks to large-scale Industry 4.0 rollouts and government incentives.
Which application area is growing most rapidly?
Predictive maintenance leads growth with a 15.1% CAGR as factories seek to curb costly unplanned downtime.
Why are services outpacing software growth?
Deployment complexity, legacy-system integration, and ongoing model maintenance push manufacturers to seek consulting and managed-services expertise.
What deployment model is gaining momentum?
Hybrid architectures that pair local edge processing with cloud-based analytics are overtaking pure on-premise setups due to latency and scalability needs.
How concentrated is the competitive landscape?
The market scores a 5 on a 1-10 scale, indicating moderate concentration with significant opportunities for niche vendors.
Page last updated on:


