
Customer Analytics Market Size and Share
Market Overview
| Study Period | 2020 - 2031 |
|---|---|
| Market Size (2026) | USD 17.58 Billion |
| Market Size (2031) | USD 41.28 Billion |
| Growth Rate (2026 - 2031) | 18.62 % |
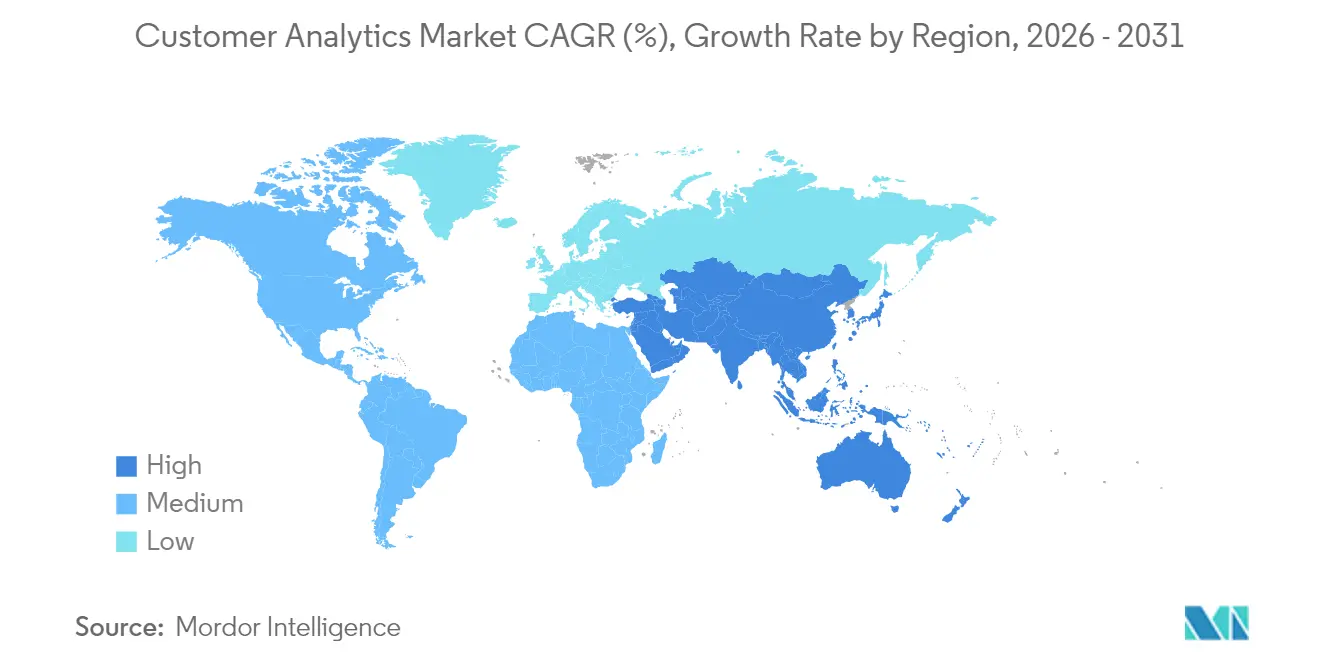
| Fastest Growing Market | Asia Pacific |
| Largest Market | North America |
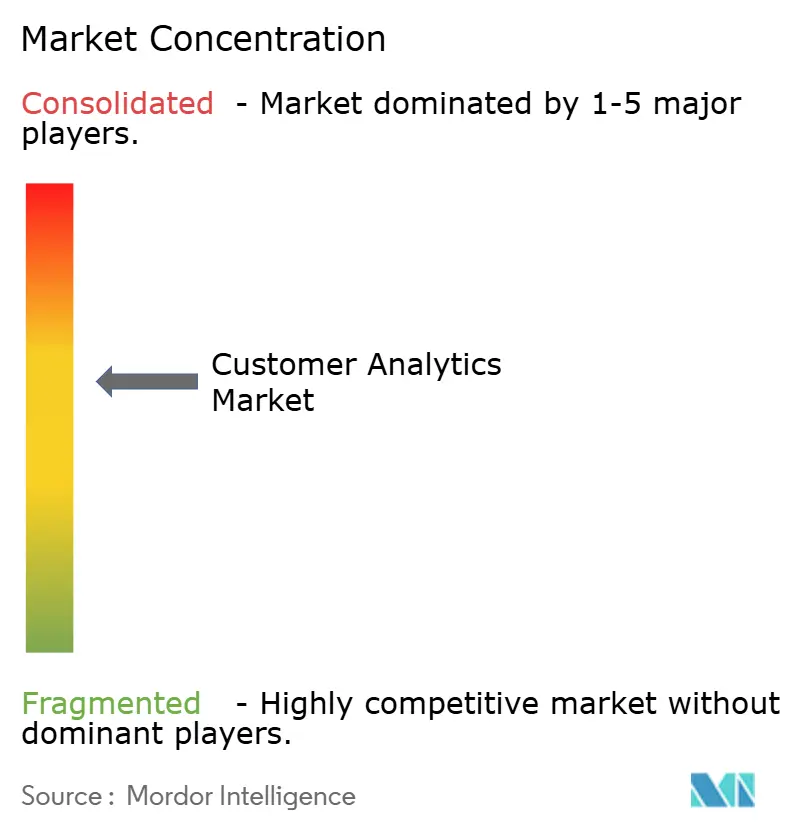
| Market Concentration | Medium |
Major Players *Disclaimer: Major Players sorted in no particular order Image © Mordor Intelligence. Reuse requires attribution under CC BY 4.0. | |
Customer Analytics Market Analysis by Mordor Intelligence
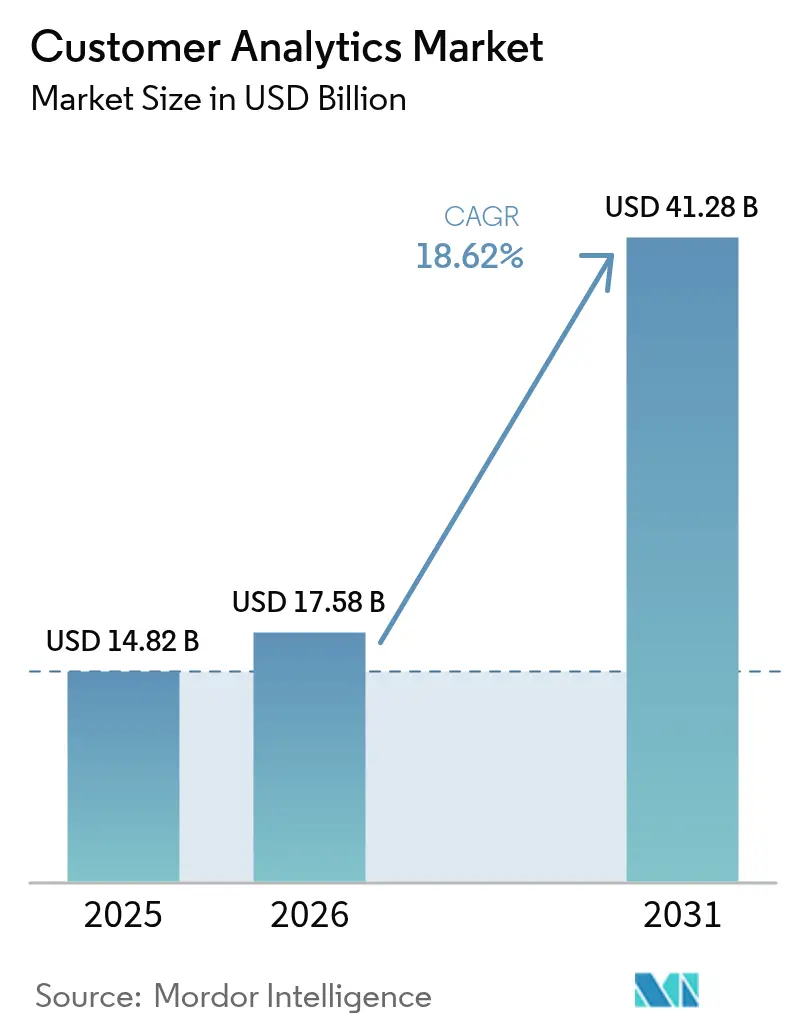
Customer analytics market size in 2026 is estimated at USD 17.58 billion, growing from 2025 value of USD 14.82 billion with 2031 projections showing USD 41.28 billion, growing at 18.62% CAGR over 2026-2031. Adoption accelerates as enterprises pivot toward data-driven engagement, replace high-cost mass marketing, and synchronize fragmented digital touchpoints. Cloud deployment remains the primary architecture because firms prefer scalable pay-as-you-go models that avoid capital outlays, while AI-augmented modules gain traction as organizations demand automated insight production. Vertical expansion continues beyond retail into highly regulated sectors such as healthcare, where analytics supports compliance and personalised care delivery. Competitive intensity rises as platform vendors embed analytics inside existing applications to lock in customers and defend share against smaller specialists. At the same time, data-sovereignty regulations and talent shortages temper short-term expansion by forcing businesses to re-engineer architectures and source external expertise.
Key Report Takeaways
- By deployment type, cloud-based solutions led with 61.35% of customer analytics market share in 2025; on-premises deployments lag with single-digit growth.
- By solution, dashboard and reporting tools held 26.60% revenue in 2025, while AI-augmented modules are projected to expand at a 23.70% CAGR through 2031.
- By organisation size, large enterprises controlled 63.20% of the customer analytics market in 2025; small and medium enterprises are growing at 19.25% annually as cloud lowers total cost of ownership.
- By service, managed services captured 54.40% of revenue in 2025, whereas professional services are forecast to rise at a 23.10% CAGR to 2031.
- By end-user industry, retail commanded 20.70% of revenue in 2025, and healthcare is expected to post the fastest 21.90% CAGR to 2031.
- Salesforce, Microsoft, Oracle and IBM together accounted for 42.60% of 2025 vendor revenue, reflecting moderate concentration across integrated platform providers.
Note: Market size and forecast figures in this report are generated using Mordor Intelligence’s proprietary estimation framework, updated with the latest available data and insights as of 2026.
Market Trends and Insights
Drivers Impact Analysis of Customer Analytics Market*
| Driver | % Impact on CAGR Forecast | Geographic Relevance | Impact Timeline |
|---|---|---|---|
| Rising demand for hyper-personalised CX | 4.20% | Global, with APAC leading adoption | Medium term (2-4 years) |
| Cloud-native analytics lowers TCO for SMEs | 3.80% | North America and EU, expanding to APAC | Short term (≤ 2 years) |
| AI-augmented self-service analytics democratises insights | 5.10% | Global, concentrated in developed markets | Medium term (2-4 years) |
| Customer Data Platforms bundled into mar-tech suites | 2.90% | North America and EU primarily | Short term (≤ 2 years) |
| Retail media networks opening first-party data pipes | 1.80% | Global, led by North America | Long term (≥ 4 years) |
| Embedded analytics inside SaaS workflows | 2.40% | Global, with enterprise focus | Medium term (2-4 years) |
| Source: Mordor Intelligence | |||
Rising Demand for Hyper-Personalised Customer Experience
Escalating acquisition costs force firms to prioritise retention, elevating personalisation from marketing goal to core operating principle. Adobe found 71% of consumers expect brands to anticipate needs, yet fewer than 40% of companies deliver at scale. Streaming providers illustrate impact: Netflix attributes roughly 80% of viewer engagement to its data-driven recommendation engine that adapts to real-time behavioural signals. Hospitality operators mirror this shift, with nearly nine in 10 hotels deploying AI-enhanced guest interactions that command premium room rates. The linkage between insight quality and revenue uplift encourages cross-industry investment in advanced segmentation, propensity modelling and next-best-action engines, fuelling growth across the customer analytics market.
Cloud-Native Analytics Lowers TCO for SMEs
Small and medium enterprises increasingly adopt cloud services because subscription models remove large capital outlays and shorten deployment cycles. US surveys show annual technology spending for many SMEs falls between USD 10,000 and USD 49,000, making scalable pay-per-use analytics financially attractive. Public cloud providers anticipate spending to top USD 1 trillion by 2028, and enterprise architects report that 85% of new workloads will follow cloud-first principles by 2025. For European mid-sized firms, 40% cite financial uncertainty as a barrier to digital projects—a gap that cloud platforms close by converting fixed costs into operating expenses. [1]Asha Istrate, “Do You Know the Digitalization Struggles of Medium-Sized Companies in Western Europe?” ASSIST Software, assist-software.net
AI-Augmented Self-Service Analytics Democratises Insights
Generative AI enables employees without coding skills to interrogate data through natural-language interfaces. Snowflake’s Cortex Analyst lets users pose questions and receive visualisations without SQL or Python knowledge. Internal metrics from large enterprises show decision cycle times falling from weeks to hours when business users can explore customer signals directly rather than queue tasks with central analytics teams. The embrace of self-service tools spreads across finance, operations and HR, driving broader platform utilisation and supporting the customer analytics market’s double-digit expansion. [2]Alex Clayton, “Cortex Analyst: Paving the Way to Self-Service Analytics with AI,” Snowflake, snowflake.com
Customer Data Platforms Bundled into Mar-Tech Suites
Software vendors embed customer data platform (CDP) functions into existing marketing clouds to address integration pain points and simplify governance. Oracle’s CX Unity streams profile, transaction and behavioural data into its CRM-native environment, helping marketers activate personalised campaigns at scale. Integration inside familiar workflows boosts utilisation: technology suppliers report that fewer than one in five standalone CDPs are fully leveraged, whereas bundled versions achieve higher activation rates because they avoid duplicative interfaces and overlap with incumbent systems. This trend reinforces platform stickiness and pushes point-solution vendors toward vertical specialisation.
Restraints Impact Analysis of Customer Analytics Market*
| Restraint | % Impact on CAGR Forecast | Geographic Relevance | Impact Timeline |
|---|---|---|---|
| Data-sovereignty laws fragment global roll-outs | -2.80% | Global, with EU and US leading restrictions | Short term (≤ 2 years) |
| Shortage of composable data-product talent | -1.90% | Global, acute in developed markets | Medium term (2-4 years) |
| Shadow-IT sprawl creates duplicate customer IDs | -1.20% | Global, concentrated in large enterprises | Medium term (2-4 years) |
| Ad-tech signal loss after third-party cookie deprecation | -1.50% | Global, impacting digital advertising | Short term (≤ 2 years) |
| Source: Mordor Intelligence | |||
Data-Sovereignty Laws Fragment Global Rollouts
Governments tighten control over personal data storage and cross-border transfers, forcing multinationals to build region-specific stacks and duplicate data pipelines. The US Department of Justice rule blocking access to sensitive American data by countries of concern exemplifies this shift and adds compliance overhead starting April 2025. Organisational architects must balance GDPR, the Cloud Act and divergent APAC residency mandates, often choosing to localise processing rather than centralise, which delays unified customer-view projects and slows customer analytics market adoption in complex operating models. [3]Merritt Maxim, “Preventing Access to U.S. Sensitive Personal Data and Government Related Data by Countries of Concern,” Federal Register, federalregister.gov
Shortage of Composable Data-Product Talent
Demand for engineers who can orchestrate modular pipelines, govern distributed models and operationalise AI exceeds supply. Academic reviews find graduate programmes still weighted toward classical statistics rather than machine-learning engineering and data-product development. APAC surveys indicate that 41% of healthcare organisations lack qualified AI practitioners, compelling them to outsource or postpone analytics initiatives. Scarcity inflates salary expectations and lengthens hiring cycles, elevating professional-services demand but restraining platform expansion inside resource-constrained enterprises.
*Our forecasts treat driver/restraint impacts as directional, not additive. The impact forecasts reflect baseline growth, mix effects, and variable interactions.
Customer Analytics Market Segment Analysis
By Deployment Type:
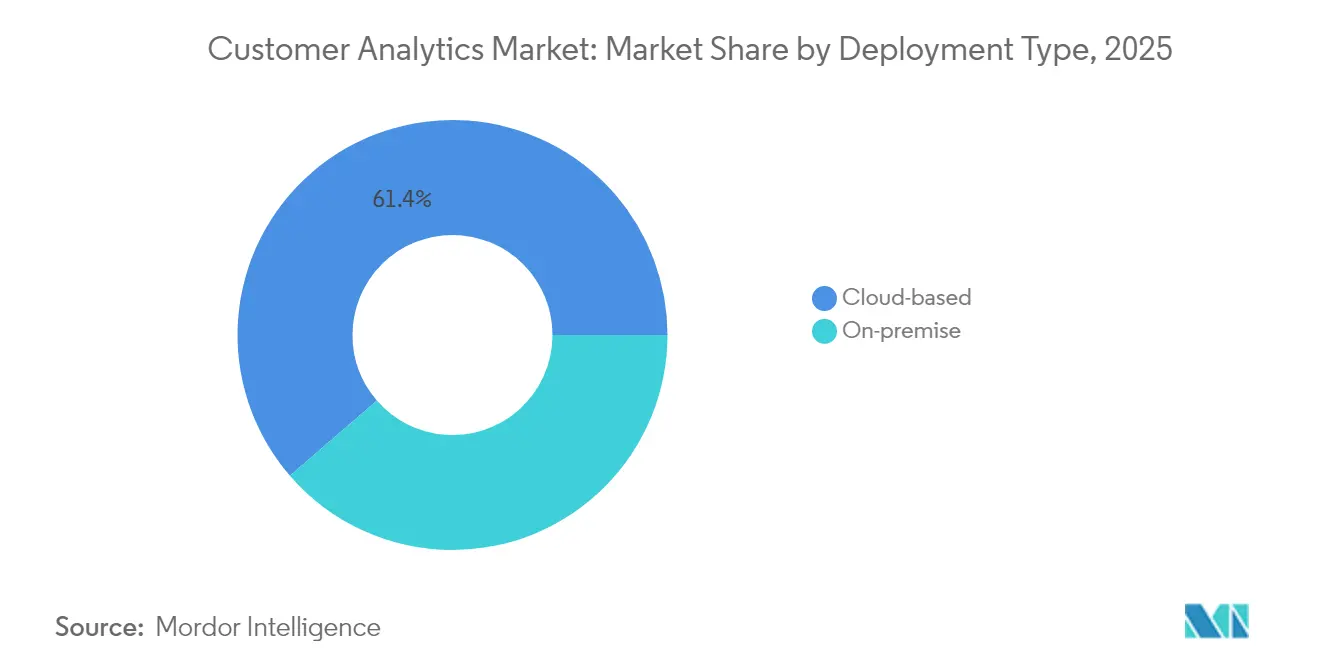
Cloud Accelerates Beyond InfrastructureCloud solutions account for 61.35% of 2025 revenue and are projected to grow at a 20.85% CAGR through 2031 as firms prefer elastic scaling and reduced maintenance overhead. In many cases the customer analytics market size for cloud deployments is expected to exceed USD 28.3 billion by 2031 at segment level. On-premises environments persist in finance and public-sector contexts that enforce tight latency or residency controls, yet investment concentrates on hybrid approaches that keep sensitive data local while offloading heavy computation to public clouds. Microsoft reported Azure growth of 35% in Q3 2025, attributing almost half the incremental revenue to AI services that power real-time segmentation and propensity modelling. Oracle’s multicloud pact with AWS demonstrates how previously rival platforms now interconnect to meet enterprise demand for flexible analytics migration paths.
Enterprises that shift to cloud note faster experimentation cycles: data teams spin up sandbox environments within minutes and de-commission them once models are validated, a process that once required weeks of procurement and installation when hardware was on-premises. Subscription pricing converts large upfront investments into operational expense, easing budget approvals especially for SMEs. As vendors introduce industry-specific compliance blueprints, regulated sectors increasingly migrate analytical workloads, further broadening the customer analytics market.



By Solution:
AI-Augmented Modules Disrupt Traditional ToolsDashboard and reporting software still represents 26.60% of 2025 revenue because visual summaries remain the gateway for non-technical managers. Yet AI-augmented modules are expanding at a 23.70% CAGR to 2031, positioning them as the fastest-growing layer of the customer analytics market. These engines automate feature engineering, model selection and scenario analysis, thereby shortening the path from raw data to actionable insight. Adobe integrated generative AI across its Digital Experience suite and generated USD 5.37 billion in 2024, validating appetite for embedded intelligence.
Voice-of-Customer, social-media and web-analytical applications continue carving out specialised use cases, but they are converging under broader customer-data-platform umbrellas that centralise schema, consent and identity resolution. ETL tools evolve from batch integrations into real-time pipelines that refresh feature stores in seconds, enabling content and pricing engines to react to customer context during live engagements. Suppliers that automate data quality and governance directly within these flows differentiate strongly amid growing privacy scrutiny.
By Organisation Size:
SME Growth Challenges Enterprise DominanceLarge enterprises retained 63.20% revenue share in 2025 owing to complex omnichannel footprints that generate high data volumes and necessitate advanced AI. However, SMEs are expanding at 19.25% annually, narrowing capability gaps as cloud subscriptions remove heavy infrastructure costs. The customer analytics market size for SMEs is forecast to cross USD 15.2 billion by 2031, reflecting sustained double-digit growth among firms with fewer than 1,000 employees. Adoption patterns differ SMEs value packaged dashboards and prescriptive recommendations, whereas corporations build bespoke models that incorporate loyalty data, call-centre transcripts and IoT touchpoints.
Vendors respond with tiered offerings: enterprise editions emphasise open APIs, DevOps integration and governance frameworks, whereas SME bundles prioritise templated journeys and guided onboarding. Training and support modalities also diverge. Large organisations contract multi-year managed-service agreements to cover complex data-ops requirements; SMEs lean on community forums and quick-start playbooks to control costs. This segmentation allows providers to align margin structures with varying willingness to pay.
By End-User Industry:
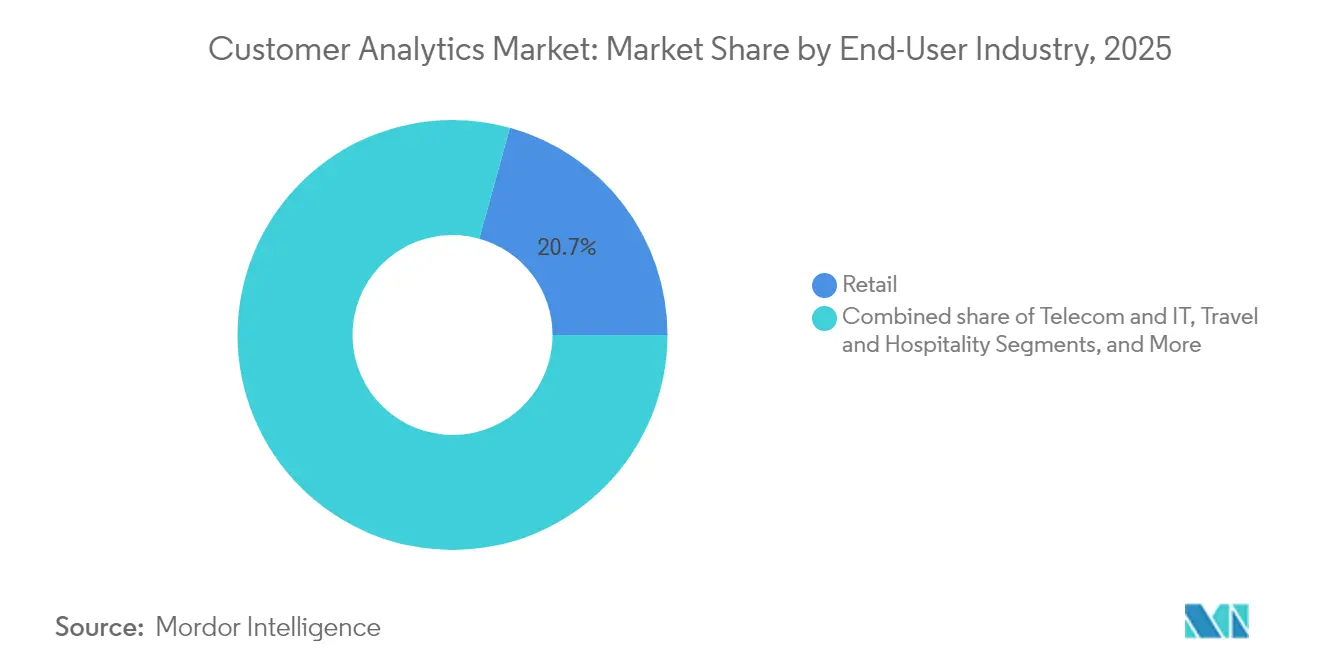
Healthcare Leads Digital TransformationRetail remained the largest adopter with 20.70% revenue in 2025 thanks to e-commerce personalisation and the rapid proliferation of retail-media networks that monetise first-party data. Healthcare is set to be the fastest-growing vertical at 21.90% CAGR because predictive insights improve patient engagement, reduce readmission costs and support value-based care. Definitive Healthcare projects AI in health systems to approach USD 173 billion by 2029, underlining runway for analytics adoption.
Manufacturing firms invest in predictive maintenance and quality inspection analytics as part of USD 3.7 trillion digital transformation spending expected by 2027. Hospitality brands allocate budgets to tailor guest journeys, leveraging data from booking engines, mobile apps and smart-room sensors. BFSI institutions focus on next-best-offer decisioning and fraud detection, while telecom carriers monetise contextual network usage patterns to fuel cross-selling plays. The diversity of use cases anchors broad-based demand, reinforcing multilayered growth across the customer analytics market.
By Service:
Professional Services Drive Implementation SuccessManaged services captured 54.40% of 2025 revenue because many companies prefer outsourcing day-to-day optimisation to partners that guarantee uptime, security and continuous improvement. Professional services, however, are set to outpace at a 23.10% CAGR as firms tackle green-field deployments, schema redesign and AI-model operationalisation. The shift toward composable architectures opens fresh consulting opportunities around micro-service orchestration, message-bus design and real-time governance.
Talent shortages intensify demand: telecommunications operators alone predict a deficit of more than 100,000 analytics-skilled professionals by 2025, pushing them to co-innovate with system integrators. Vendors increasingly package workshops, data-ethics assessments and change-management playbooks inside software subscriptions, creating blended commercial models that align incentives for sustained value realisation. The approach reduces project failure risk while raising average contract value.
Geography Analysis
North America Customer Analytics Market
North America dominates spending owing to deep cloud penetration, mature data-science talent pools and strong venture funding that topped USD 109.1 billion for AI start-ups in 2024. Vendors leverage dense data-centre footprints across the United States and Canada to deliver low-latency inference for real-time personalisation campaigns. Regulatory policy remains comparatively flexible, though state-level privacy acts require region-specific consent controls. Mexico’s emerging e-commerce ecosystems create incremental demand as retailers seek insight into omnichannel buyer behaviour.
Europe Customer Analytics Market
Europe follows closely as organisations comply with GDPR, driving uptake of privacy-by-design analytics frameworks. Germany and the United Kingdom lead adoption, supported by manufacturing and financial-services modernisation, while France and Italy accelerate digital programmes through government-backed stimulus. Data-localisation mandates compel vendors to operate multi-region clusters, increasing operating costs yet boosting trust among privacy-sensitive customers. EU initiatives around trusted-cloud labels and secure analytics sandboxes further influence architectural decisions.
APAC Customer Analytics Market
APAC represents the fastest-expanding region, with 43% of enterprises planning >20% AI budget increases over the coming year. China scales domestic large-language models to serve local regulations, prompting parallel ecosystems distinct from Western platforms. India’s BFSI and telecom sectors invest heavily in data platforms to reach mobile-first users. Japan and South Korea emphasise omnichannel retail analytics, and Australia maintains steady growth on the back of strong cloud infrastructure and favourable currency trends. Overall, regional AI expenditure could exceed USD 110 billion by 2028, sustaining robust expansion of the customer analytics market.

Regulatory Landscape
Customer analytics deployments increasingly sit at the intersection of privacy law and AI governance, which pushes vendors and adopters to embed consent, auditability, and profiling controls into data pipelines. In the European Union, the AI Act (Regulation (EU) 2024/1689) sets harmonized obligations for AI systems, with major high-risk requirements becoming enforceable in August 2026. Enterprises are therefore expected to document training and decision logic, strengthen human oversight, and operationalize risk assessments alongside GDPR controls.
In the United States, privacy compliance remains fragmented across state regimes and emerging AI rules. California Consumer Privacy Act regulations, as amended, took effect on January 1, 2026, and they introduce additional requirements affecting sensitive personal information and automated decision-making technology. Connecticut expanded its Data Privacy Act via Public Act 25-113 effective July 1, 2026, adding profiling-related assessment requirements with follow-on milestones in August 2026. At the federal level, lawmakers introduced the Consumer Data Privacy and Security Act of 2026 (S. 4211) in March 2026, indicating continued movement toward baseline national privacy and security program expectations for covered entities.
Value Chain Analysis
The customer analytics value chain starts with data generation and capture across digital and physical touchpoints, including web, mobile, contact center, commerce, and product usage. It then moves through ingestion and identity resolution to create governed customer profiles. Platform layers typically cover data storage and processing (cloud data platforms, lakehouse/warehouse), analytics and AI modeling (segmentation, propensity, next-best-action), and activation connectors into marketing, service, and sales workflows. Services that implement, operate, and optimize these deployments align with managed services holding 54.40% of revenue in 2025.
Partnership activity shows how value is created by embedding analytics into operational systems and multi-enterprise networks, rather than treating analytics as a standalone tool. In 2025, Kinaxis partnered with Databricks to connect its Maestro orchestration platform with the Databricks Data Intelligence Platform, targeting reduced data silos and more predictive AI across planning and execution. FedEx Dataworks and ServiceNow also expanded collaboration to bring FedEx network and disruption data into the ServiceNow AI Platform for sourcing and procurement workflows. Dot Foods partnered with Crisp to deliver supplier analytics with SKU-level dashboards, illustrating how distributors and logistics data owners increasingly act as upstream signal providers for customer-facing analytics and decisioning.
Competitive Landscape
The marketplace exhibits moderate consolidation. Salesforce, Microsoft, Oracle and IBM collectively hold an estimated 43% of global revenue, leveraging deep install bases and cross-suite bundling strategies. Salesforce generated USD 900 million in Data Cloud and AI annual recurring revenue in fiscal 2025, a 120% year-over-year surge, underlining customer appetite for embedded intelligence. Microsoft’s cloud division reported USD 42.4 billion revenue in Q3 2025, with AI services contributing significantly to Azure expansion, reinforcing platform lock-in for analytics workloads.
Specialist vendors differentiate through vertical use-case depth, for instance, patient-risk scoring in healthcare or predictive maintenance in manufacturing. The rise of composable architectures levels integration barriers, enabling smaller providers to interoperate with large platforms via open APIs and pre-built connectors. Strategic partnerships have intensified: Oracle and AWS now co-market database services to meet hybrid requirements, while IBM’s acquisition of DataStax enhances unstructured data processing essential for generative AI. Competitive factors increasingly revolve around low-code model development, governance automation and responsible-AI tooling rather than core analytics functionality alone.
Customers weigh vendor roadmaps for privacy compliance, deployment flexibility and total cost of ownership. Switching costs remain high once data models, identity graphs and activation channels are embedded, reinforcing incumbent positions yet still leaving room for innovation where domain-specific pain points persist. The ongoing wave of acquisitions and alliances suggests further consolidation over the next three years.
Customer Analytics Industry Leaders
Adobe
IBM
Oracle
Salesforce
SAS Institute
- *Disclaimer: Major Players sorted in no particular order
Customer Analytics Market Companies Covered in this Report
- Adobe
- Alteryx
- Angoss Software Corp.
- Axtria
- Bridgei2i (Accenture)
- IBM
- Manthan Software
- Microsoft
- NGDATA
- Oracle
- Pitney Bowes
- Salesforce
- SAS Institute
- TEOCO
- Aruba Networks (HPE)

Market Opportunities and Future Outlook
Agentic and conversational analytics is creating whitespace for platforms that can turn governed first-party data into actions inside marketing, commerce, and service workflows with less analyst effort. Databricks introduced CustomerLake in June 2026 as an agentic CDP built on the lakehouse and governed by Unity Catalog, while Celebrus launched Celebrus AI in June 2026 to apply conversational analytics to real-time, identity-resolved behavioral data. Together, these moves support demand for faster time-to-insight paired with controls that satisfy consent and profiling requirements.
Composable CDP and cloud data platform modernization is also opening opportunities in regulated and complex, multi-market enterprises that need real-time decisioning but cannot centralize all data because of sovereignty constraints. Fastweb and Vodafone, for example, are migrating connected data workflows to Google Cloud for real-time customer insights (January 2026), and Transavia reported 4x faster personalization with a 40% reduction in license costs after moving to a composable CDP on Databricks (January 2026). Cross-channel execution and partner ecosystem consolidation further expand the addressable footprint as suites combine data, decisioning, and orchestration, including BlueConic acquiring Blueshift in June 2026 to integrate execution and AI decisioning into its customer growth engine.
Recent Industry Developments in Customer Analytics Market
- July 2026: Stirista acquired Alesco Data to combine identity-driven marketing capabilities with consumer data assets and customer intelligence. The deal strengthens Stirista's ability to support richer audience enrichment and activation use cases that depend on unified identity and data breadth across channels.
- June 2026: Databricks announced CustomerLake, positioning an agentic customer data platform natively on the Databricks lakehouse and governed by Unity Catalog. The launch aligns customer analytics workflows more tightly with cloud data platform governance and reduces friction between data engineering, modeling, and activation teams.
- February 2025: IBM closed the acquisition of DataStax, integrating AstraDB with watsonx to support generative AI and data workloads. This expanded IBM's tooling for handling large-scale, unstructured and operational data foundations that underpin advanced customer analytics and AI-assisted insight generation.


Customer Analytics Market Report Scope and Research Methodology
Market Definition and Coverage
The customer analytics market is counted as revenue earned from software and managed services that collect and organize customer data, run analytical models, and produce usable insights for teams that manage marketing, sales, service, and experience across channels.
Scope exclusions: We do not count generic business intelligence tools, data-warehouse hardware, or one-time consulting projects that are not sold as repeatable customer analytics offerings.
Segments Covered in This Report
- By Deployment Type
- On-premise
- Cloud-based
- By Solution
- Social-Media Analytical Tools
- Web Analytical Tools
- Dashboard and Reporting Tools
- Voice of Customer (VoC)
- ETL (Extract-Transform-Load)
- Advanced Analytical Modules
- By Organisation Size
- SMEs
- Large Enterprises
- By End-user Industry
- Telecommunications and IT
- Travel and Hospitality
- Retail
- BFSI
- Media and Entertainment
- Healthcare
- Transportation and Logistics
- Manufacturing
- Other Industries
- By Service
- Managed Service
- Professional Service
- By Geography
- North America
- United States
- Canada
- Mexico
- South America
- Brazil
- Argentina
- Rest of South America
- Europe
- United Kingdom
- Germany
- France
- Italy
- Rest of Europe
- Asia-Pacific
- China
- Japan
- India
- South Korea
- Rest of Asia-Pacific
- Middle East and Africa
- Middle East
- Israel
- Saudi Arabia
- UAE
- Turkey
- Rest of Middle East
- Africa
- South Africa
- Egypt
- Rest of Africa
- Middle East
- North America
Data Sources, Market Sizing, and Validation
Desk Research
Desk work starts with building a clean view of demand signals and the rules that shape data use, because customer analytics depends heavily on data availability and consent. Public sources such as the US Bureau of Labor Statistics for analytics and data roles, the US Federal Trade Commission for privacy guidance, the European Commission and EDPB publications for GDPR interpretation, and NIST references for security controls help keep assumptions realistic.
We also refer to sources such as SEC filings, annual reports, investor presentations, product documentation pages, and credible press coverage to understand how buyers describe budgets and what vendors bundle into subscriptions. Where available, we use paid subscriptions that support company financials and business intelligence, news and financials tracking, and patent databases to confirm product direction and timing. These examples are illustrative only, and many other public sources were reviewed during data collection, validation, and clarification.
Primary Interviews and Surveys
Primary discussions were used to test what is actually purchased as customer analytics versus adjacent categories, and to confirm typical pricing logic for cloud subscriptions and related integration services. We spoke with a mix of solution providers, system integrators, and enterprise users across APAC, EMEA, and the Americas so adoption, replacement cycles, and usage intensity assumptions could be stress-tested before finalizing the model.
Distribution of primary research fieldwork respondents
| Company type | Respondent position | Region |
|---|---|---|
| Top tier: 31% | CXOs: 16% | APAC: 47% |
| Mid tier: 47% | Functional/Unit leaders: 39% | EMEA: 29% |
| Smaller Players: 22% | Managers: 45% | Americas: 24% |
Market-Sizing & Forecasting
Sizing is built using top-down logic, where overall analytics and software spending is reconstructed into a customer-analytics demand pool using adoption and usage indicators, then split by region and industry using observable enterprise digital activity. To avoid over-counting, results are cross-checked with selective bottom-up approximations, such as sampled vendor pricing ranges multiplied by estimated customer counts and typical module attach rates.
Key inputs that steer the model include cloud versus on-premises mix, the share of analytics projects moving into recurring subscriptions, average contract value progression, identity resolution and data-unification intensity, and privacy and data-sovereignty constraints that slow deployments in some countries. Forecasts are produced using scenario analysis, where growth paths are tied to expected AI-assisted analytics uptake, consent-driven data availability, and budget sensitivity discussed by interviewees. When bottom-up views have gaps, missing pieces are bridged using conservative range assumptions that are kept consistent across regions and reviewed during validation.
Data Validation & Update Cycle
Outputs are validated by comparing totals and growth rates against independent signals, such as enterprise software spend direction, cloud migration pace, and reported subscription growth patterns in relevant filings. Variance checks are run for unusually high regional shares, abrupt year over year jumps, and implausible price or adoption combinations, and then the model is reviewed in more than one analyst pass before sign-off.
The study is refreshed annually, and interim updates are triggered when material events occur, such as regulatory changes, major product bundling shifts, or large M&A activity that changes reported revenue lines. Before delivery, a fresh review is completed so the final version reflects the latest data and any new confirmation received from expert re-contacts.
Mordor Intelligence's Customer Analytics Market Size Measured Against Other Published Estimates
Published market sizes for customer analytics often differ because each publisher draws the line differently between core customer analytics, adjacent marketing suites, and general data tools, and they also choose different base years and currency handling. Differences can also come from how subscription services are treated, how integration revenue is counted, and how quickly assumptions are updated after product bundling changes.
The main gap comes from what gets bundled into the counted spend, where Mordor Intelligence includes customer analytics software plus related managed services, but excludes generic BI tools, data-warehouse hardware, and one-off consulting, which shifts totals versus estimates that roll these items together or assume broader activation tooling is always included.
Benchmark comparison
| Source | Market Size | Gaps in Research Methodology |
|---|---|---|
| Mordor Intelligence | USD 17.58 B (2026) | |
| Global Research Outlet A | USD 16.98 B (2024) | Uses a 2024 base year and a component scope that explicitly lists ETL and dashboard/reporting tools, which can pull in general analytics spend that is not always used for customer-specific decisioning. |
| Data Publisher B | USD 15.98 B (2024) | Runs a broader application framework that can mix campaign management and adjacent marketing activities into customer analytics, and the longer forecast window raises sensitivity to aggressive adoption assumptions. |
The spread across the table is mainly explained by scope and base-year choices, not a disagreement on growth direction. When we keep the model tied to repeatable customer-analytics revenue streams, then verify assumptions with buyer and provider feedback, the market size becomes easier to trace back to clear drivers such as adoption, contract values, and service attachment.


Key Questions Answered in the Report
What is the current value of the customer analytics market?
The customer analytics market is valued at USD 17.58 billion in 2026
How fast is the customer analytics market expected to grow?
It is projected to expand at a 18.62% CAGR, reaching USD 41.28 billion by 2031.
Which deployment model leads the market?
Cloud-based deployment leads with 61.35% revenue share in 2025 and is forecast to grow at 20.85% annually.
Which industry will experience the fastest adoption of customer analytics solutions?
Healthcare is forecast to grow at a 21.90% CAGR through 2031 as providers leverage analytics for patient engagement and regulatory compliance.
Why are SMEs adopting customer analytics platforms more rapidly now?
Cloud-native pricing eliminates large upfront costs and simplifies implementation, enabling SMEs to access enterprise-grade capabilities at manageable operating expenses.
What key factor restrains global rollouts of unified analytics platforms?
Divergent data-sovereignty regulations force multinationals to localise storage and processing, increasing complexity and slowing deployment.
Page last updated on:





