Supply Chain Analytics Market Size and Share
Market Overview
| Study Period | 2020 - 2031 |
|---|---|
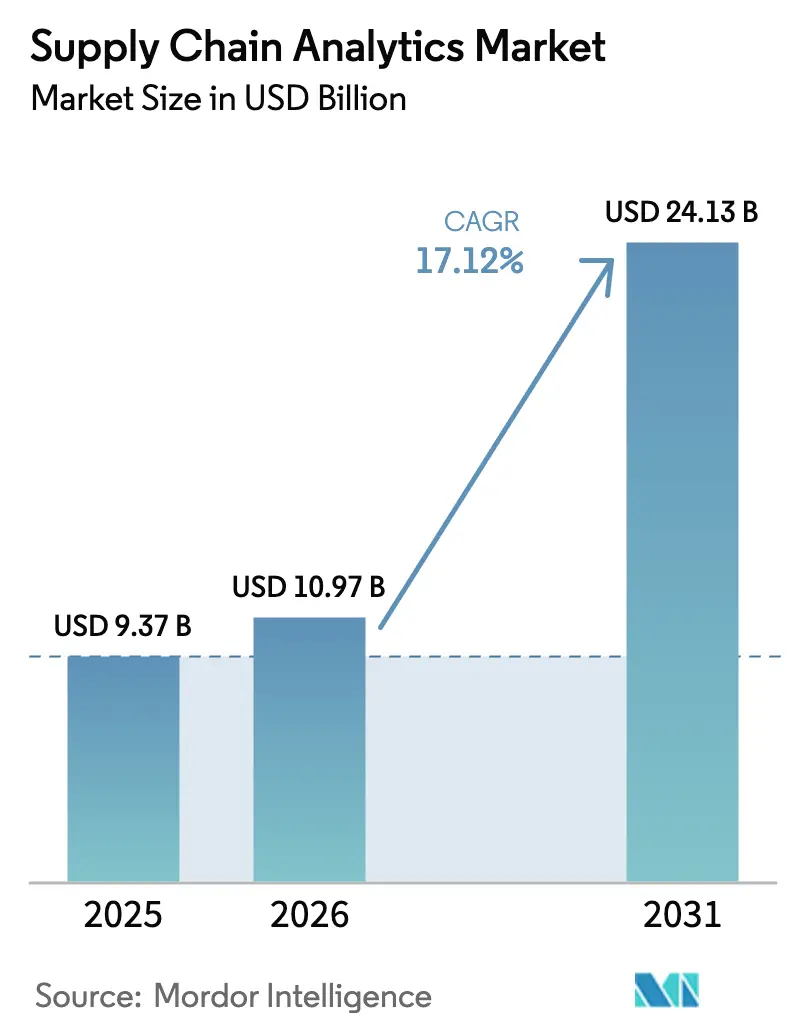
| Market Size (2026) | USD 10.97 Billion |
| Market Size (2031) | USD 24.13 Billion |
| Growth Rate (2026 - 2031) | 17.12% CAGR |
| Fastest Growing Market | Asia Pacific |
| Largest Market | North America |
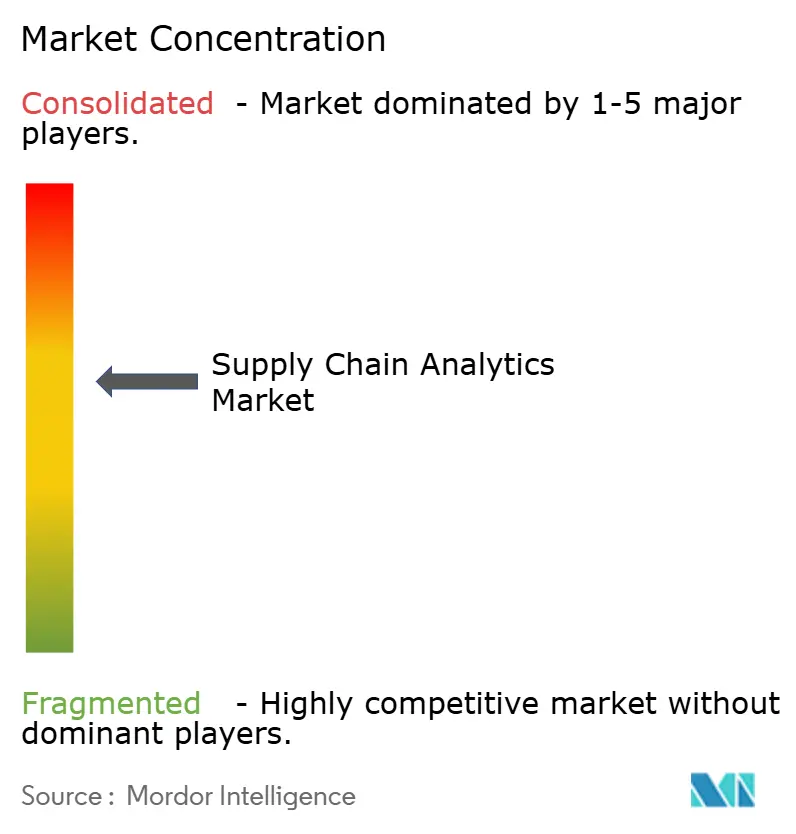
| Market Concentration | Medium |
Major Players *Disclaimer: Major Players sorted in no particular order Image © Mordor Intelligence. Reuse requires attribution under CC BY 4.0. | |
Supply Chain Analytics Market Analysis by Mordor Intelligence
Supply chain analytics market size in 2026 is estimated at USD 10.97 billion, growing from 2025 value of USD 9.37 billion with 2031 projections showing USD 24.13 billion, growing at 17.12% CAGR over 2026-2031. This acceleration reflects the shift from reactive, siloed processes toward predictive, network-wide visibility that can avert delays and material shortages before they cascade across tiers. Lower cloud entry costs, an expanding base of connected assets, and mainstream adoption of Gen-AI copilots are removing skills and budget barriers, allowing firms of every size to tap advanced decision support. At the same time, rising pressure to document Scope 3 emissions and harden supply chains against geopolitical shocks is driving deeper analytics penetration across planning, procurement, and logistics workflows. The supply chain analytics market is further energized by industry-specific templates that shrink deployment times and by subscription pricing that aligns spend with value creation.
Key Report Takeaways
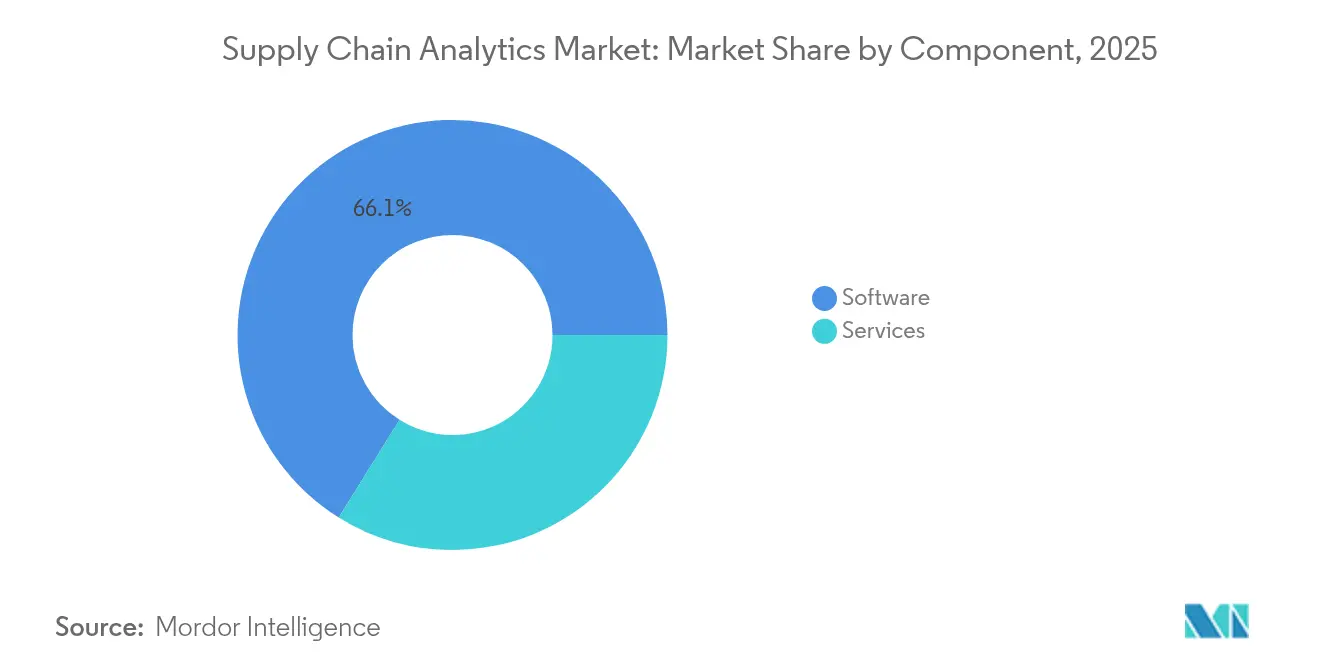
- By component, software led with 66.12% of supply chain analytics market share in 2025; services post the fastest 24.6% CAGR through 2031.
- By deployment, cloud models held 62.31% of 2025 implementations and are expanding at 26.3% CAGR to 2031.
- By analytics type, descriptive tools held a 35.08% share in 2025, whereas prescriptive analytics is advancing at a 27.4% CAGR.
- By application, inventory management captured a 28.05% share in 2025, while sustainability analytics grew at a 28.9% CAGR (2026-2031).
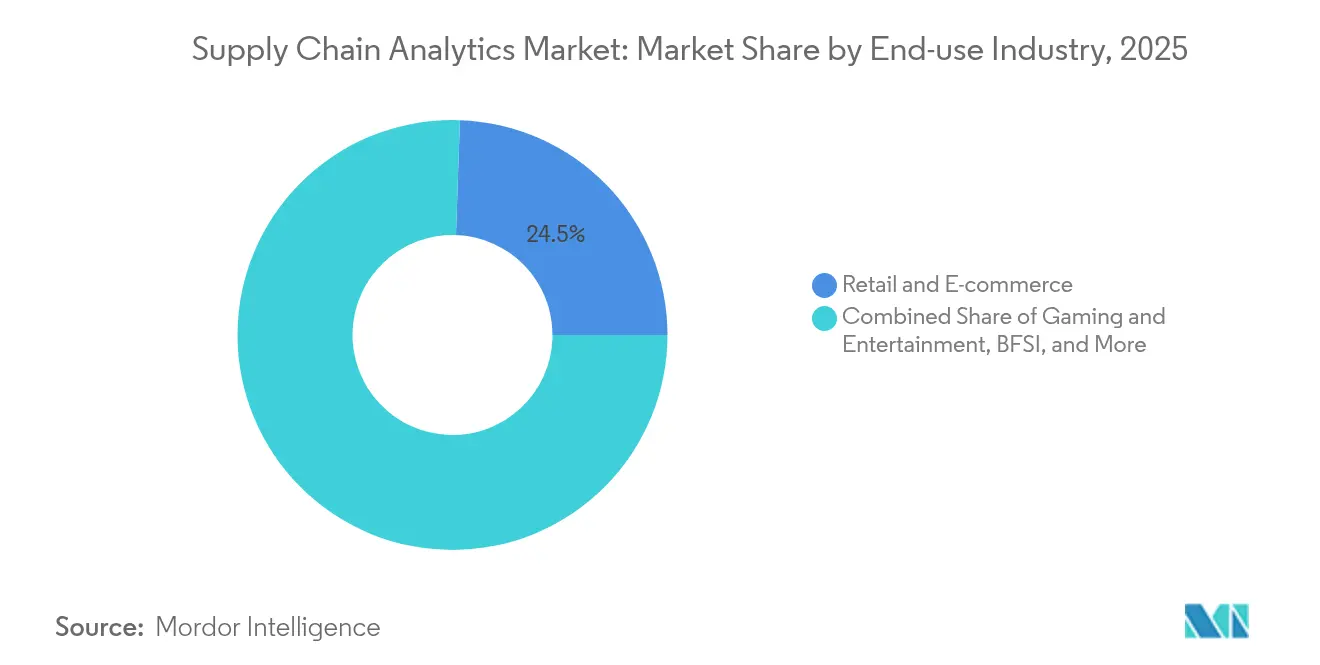
- By end-use industry, retail and e-commerce commanded a 24.45% share in 2025; healthcare and life sciences are set to grow at a 25.8% CAGR.
- By enterprise size, large enterprises held a 58.95% share in 2025; SMEs are expanding at a 27.9% CAGR through 2031.
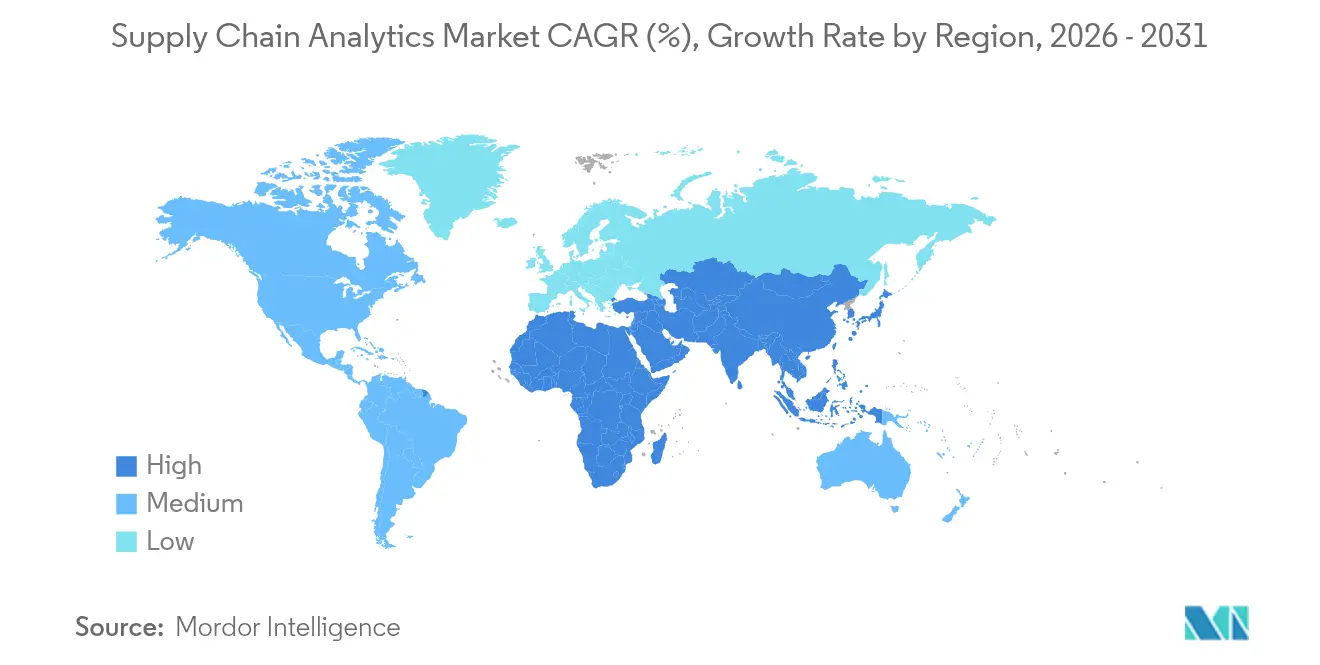
- By geography, North America dominated with 40.85% share in 2025; Asia-pacific is the fastest-growing region at 24.8% CAGR (2026-2031).
Note: Market size and forecast figures in this report are generated using Mordor Intelligence’s proprietary estimation framework, updated with the latest available data and insights as of 2026.
Global Supply Chain Analytics Market Trends and Insights
Driver Impact Analyis*
| Driver | (~) % Impact on CAGR Forecast | Geographic Relevance | Impact Timeline |
|---|---|---|---|
| Retail e-commerce boom compressing fulfil-ment cycles | +4.2% | North America, Europe, Asia-Pacific | Medium term (2-4 years) |
| Industry 4.0 adoption amplifies shop-floor data exhaust | +3.8% | Europe, North America, Asia-Pacific | Long term (≥ 4 years) |
| Cloud affordability for advanced analytics stacks | +3.1% | Global | Short term (≤ 2 years) |
| Post-pandemic resiliency mandates multi-tier visibility | +2.5% | Global | Medium term (2-4 years) |
| Scope-3 carbon-traceability regulations (EU CSRD, SEC) | +2.1% | Europe, North America, with spillover to Asia-Pacific | Medium term (2-4 years) |
| Gen-AI copilots slashing modelling skill barriers | +1.9% | North America, Europe, Asia-Pacific | Short term (≤ 2 years) |
| Source: Mordor Intelligence | |||
Retail e-commerce fulfilment compression
- Explosive online demand is shrinking delivery windows and forcing retailers to embed real-time analytics across order, stock, and transport nodes. Most adopters achieve 30% higher fulfilment rates and 25% lower logistics costs once prescriptive engines automate carrier selection and inventory placement. Canadian Tire, for instance, improved channel allocation during volatile peaks and lifted sales 20% by applying network-wide optimisation. As same-day delivery expectations spread to new categories, the supply chain analytics market will remain pivotal to margin defence and customer retention.
Industry 4.0 shop-floor data surge
Connected machinery streams live quality, throughput, and energy data that feeds wider supply-chain models, lifting overall equipment effectiveness by up to 15% and cutting quality costs 20% [1]GoodData, “Predictive Analytics in Manufacturing,” gooddata.com. Closing the OT-IT gap lets planners move from static schedules to dynamic replenishment aligned with real-time plant conditions. Predictive maintenance triggers extend asset life, while linking factory signals to supplier scorecards allows faster root-cause analysis of defects.
Cloud affordability for analytics stacks
The democratization of cloud-based analytics platforms is dramatically lowering the barrier to entry for sophisticated supply chain analytics capabilities, enabling organizations of all sizes to access enterprise-grade tools without massive upfront investments. SMEs benefit most, accelerating adoption because Gen-AI interfaces mask complexity, turning natural-language prompts into scenario models. Unified clouds also harmonise partner data, granting end-to-end visibility formerly restricted to tier-one enterprises.
Post-pandemic multi-tier visibility mandate
Fifty-five percent of executives list multi-tier insight as their top post-2024 priority, seeking to avert shocks such as raw-material shortages or logistics gridlocks. Shared portals are emerging where buyers and suppliers test disruption scenarios in virtual sandboxes, ushering in a collaborative era that rewards ecosystem trust and data openness.
Restraint Impact Analysis*
| Restraint | (~) % Impact on CAGR Forecast | Geographic Relevance | Impact Timeline |
|---|---|---|---|
| Cyber-attacks on integrated data pipelines | -1.8% | Global, with heightened impact in North America and Europe | Medium term (2-4 years) |
| High total cost of ownership for legacy upgrades | -1.5% | Global | Short term (≤ 2 years) |
| Data quality and interoperability issues across tiers | -1.2% | Global | Medium term (2-4 years) |
| Export-control rules throttling cloud data residency | -0.9% | Asia-Pacific, Europe, Middle East | Long term (≥ 4 years) |
| Source: Mordor Intelligence | |||
Cyber-attacks on data pipelines
Inter-company data flows widen the attack surface, and an average breach now costs USD 4.35 million when fines, downtime, and remediation are tallied [2]AuditBoard, “Supply Chain Risk Management: Best Practices,” auditboard.com. Firms offset risk with zero-trust architectures, but extra controls can lengthen project timelines and inflate budgets, tempering the near-term outlook for the supply chain analytics market.
High total cost of legacy upgrades
Rigid ERP schemas and siloed execution systems require heavy ETL work before analytics can operate, pushing total cost of ownership beyond initial projections. Budget overruns dent executive confidence, especially at global manufacturers juggling parallel transformation programs. Lightweight, AI-native challengers exploit this gap with modular offers that sidestep massive re-platform efforts.
*Our forecasts treat driver/restraint impacts as directional, not additive. The impact forecasts reflect baseline growth, mix effects, and variable interactions.
Segment Analysis
By Component: Software Dominates While Services Accelerate
Software claimed 66.12% of 2025 revenue as firms invested in integrated suites that model demand, inventory, production, and logistics in one environment. These engines ingest billions of data points daily, surfacing anomalies and prescribing corrective actions. Yet services are the market’s growth engine, advancing at 24.6% CAGR to 2031 as companies grasp that sustained value depends on continuous tuning. Vendors package outcome-based engagements that link fees to inventory turns or service-level gains, aligning incentives and expanding the supply chain analytics market.
Inside software, inventory and warehouse modules remain the profit core. AI upgrades convert them from passive dashboards to autonomous agents that rebalance stock, schedule labour, and replot warehouse slots without human intervention. Established vendors retrofit deep-learning add-ons, whereas smaller entrants release cloud-native platforms built around reinforcement learning. Competition therefore hinges on speed of insight delivery rather than breadth of feature checklists.


By Deployment: Cloud Accelerates Multi-Enterprise Collaboration
Cloud hosts delivered 62.31% of new installs in 2025, confirming that organisations prefer scalable compute and instant feature updates to custom on-premise stacks. Hybrid models gain favour where data sovereignty rules require sensitive workloads to remain in-house, yet batch analytics and AI training burst to the cloud for cost efficiency. Edge nodes push alerts to truck cabins and yard gates when connectivity lags, blending local autonomy with central governance. This distributed fabric unlocks multi-company use cases—from real-time ocean-freight tracking to collaborative capacity auctions—broadening the supply chain analytics market size for cloud vendors.
By Analytics Type: Prescriptive Intelligence Drives Future Growth
Descriptive tools still hold 35.08% share but prescriptive layers are surging at 27.4% CAGR because managers want recommended actions, not static hindsight. Unified workbenches integrate descriptive, diagnostic, predictive, and prescriptive models so users shift seamlessly from “what happened” to “what to do next.” Cognitive add-ons learn from feedback loops, gradually automating routine planning steps. Predictive modules increasingly import weather, macroeconomic, and social sentiment feeds, sharpening forecasts and triggering early mitigation moves that safeguard service levels.
By Application: Sustainability Analytics Emerges as Growth Leader
Inventory optimisation remained top at 28.05% market share in 2025, underlining its perennial role in balancing service and capital tied up on shelves. Yet, sustainability analytics is expanding at a blistering 28.9% CAGR (2026-2031) as CSRD and similar regimes force companies to disclose Scope 3 emissions that often represent 90% of their footprint . Transport route optimisation and risk-sensing dashboards follow closely, as firms pivot from headline cost metrics to triple-bottom-line scorecards.
By End-use Industry: Healthcare Accelerates Post-Pandemic Transformation
Retail and e-commerce owned 24.45% of the supply chain analytics market in 2025, leveraging granular basket data and omnichannel flows to delight customers while defending margins. Healthcare and life sciences accelerate at 25.8% CAGR as hospitals rationalise inventories of critical supplies, and pharma makers synchronise complex cold chains. Automotive, electronics, and food sectors follow, each adopting analytics to reconcile volatility, compliance demands, and sustainability targets.
By Enterprise Size: SMEs Close the Technology Gap
Large enterprises accounted for 58.95% of spending in 2025, exploiting richer data pools and IT budgets to build control towers. However, SMEs now add users at 27.9% CAGR thanks to plug-and-play cloud bundles and natural-language interfaces that shield them from data-science tasks. Sector patterns show above-average SME uptake in digital-first domains like e-commerce and fintech, hinting at untapped demand among mid-sized manufacturers and logistics providers.
Geography Analysis
North America led with 40.85% share in 2025, driven by early cloud uptake, rich venture funding, and regulatory push for supply-chain transparency. US retailers apply predictive allocations to balance store and e-commerce stock, while manufacturers such as GM use analytics to steer chip sourcing strategies around capacity constraints. Federal incentives for semiconductor reshoring and clean-energy supply chains further elevate analytics budgets, as firms need live scenario modelling to weigh localisation against cost and risk.
Asia-Pacific is the fastest-growing region at 24.8% CAGR to 2031, buoyed by e-commerce booms, smart-factory programs, and government subsidies for cloud migration. Chinese enterprises apply cloud platforms to orchestrate flexible production and synchronise suppliers in sprawling industrial clusters mdpi.com . India’s PLI (production-linked incentives) schemes entice global brands to build regional nodes, making visibility into tier-three suppliers a board mandate. Japanese manufacturers leverage analytics to redesign supplier ecosystems for resilience against natural disasters and geopolitical risk.
Europe retains a strong presence, led by sustainability analytics that supports strict CSRD disclosures. Automotive, aerospace, and chemicals companies use collaborative platforms like Confinity-X to pool demand forecasts and streamline inbound logistics, cutting both emissions and cost. South America and the Middle East and Africa expand from smaller bases, primarily in consumer goods, mining, and energy trade lanes where visibility gaps historically inflated working capital. Cross-border data corridors powered by cloud hyperscalers now enable real-time control-tower views in these emerging markets, reinforcing the global scope of the supply chain analytics market.

Competitive Landscape
The supply chain analytics market displays moderate concentration. IBM, SAP, and Oracle anchor large-scale transformation deals with integrated suites that span planning, execution, and risk. Blue Yonder, Kinaxis, and Manhattan Associates win based on deep domain expertise—respectively in merchandising, concurrent planning, and warehouse management. Cloud-native entrants promise shorter deployments and friendlier interfaces, forcing incumbents to pivot from licence sales to subscription bundles and micro-services.
Partnerships multiply as vendors integrate emissions calculators, risk graphs, and digital twin engines from specialist firms. Manhattan Associates’ 2024 shift to full-subscription pricing and its integration of AI-driven labour scheduling show how incumbents defend share. Oracle embeds AI agents that automate routine workflows such as purchase-order expedites, reducing planner workload and improving compliance with internal SLAs.
White-space growth lies in mid-market vertical packs and real-time carbon accounting. Vendors able to deliver quick wins without complex data science stand to capture SME budgets and enlarge the overall supply chain analytics industry.
Supply Chain Analytics Industry Leaders
Oracle Corporation
SAP SE
Blue Yonder Group Inc.
IBM Corporation
Kinaxis Inc.
- *Disclaimer: Major Players sorted in no particular order

Recent Industry Developments
- March 2025: Achilles launched a real-time supply-chain sustainability tracking tool that enhances transparency and compliance.
- February 2025: SAP introduced its Business Data Cloud platform, unifying data across SAP and non-SAP landscapes for easier AI adoption.
- January 2025: Oracle released AI agents designed to automate supply-chain workflows and improve decision speed.
- May 2024: IBM expanded its Sterling suite with AI-powered risk management for real-time order and inventory visibility.


Research Methodology Framework and Report Scope
Market Definitions and Key Coverage
Our study defines the supply chain analytics market as all commercial software and managed-service solutions that ingest operational data from procurement, production, logistics, inventory, and order-fulfilment systems in order to generate descriptive, diagnostic, predictive, and prescriptive insights that improve supply chain decision-making. Revenue is tracked at the point a license, subscription, or service contract is invoiced.
Scope exclusion: This assessment does not count stand-alone ERP modules that only report static KPIs without embedded analytical models.
Segmentation Overview
- By Component
- Software
- Demand Planning and Forecasting
- Procurement and Sourcing Analytics
- Inventory and Warehouse Analytics
- Logistics and Transportation Analytics
- Visualization and Reporting
- Services
- Professional Services
- Managed Services
- Software
- By Deployment
- On-premise
- Cloud
- Hybrid
- By Analytics Type
- Descriptive
- Diagnostic
- Predictive
- Prescriptive
- Cognitive
- By Application
- Inventory Management
- Demand Forecasting
- Procurement Analytics
- Supplier Performance Management
- Logistics and Transportation Optimisation
- Risk Management and Compliance
- Sustainability Analytics
- By End-use Industry
- Retail and E-commerce
- Manufacturing
- Automotive
- Healthcare and Life Sciences
- Food and Beverage
- Consumer Packaged Goods
- Aerospace and Defence
- High-Tech and Electronics
- Others
- By Enterprise Size
- Large Enterprises
- Small and Medium Enterprises (SMEs)
- By Geography
- North America
- United States
- Canada
- Mexico
- South America
- Brazil
- Argentina
- Rest of South America
- Europe
- Germany
- United Kingdom
- France
- Italy
- Spain
- Russia
- Rest of Europe
- Asia-Pacific
- China
- Japan
- India
- South Korea
- Australia and New Zealand
- Rest of Asia-Pacific
- Middle East and Africa
- Middle East
- Saudi Arabia
- UAE
- Turkey
- Rest of Middle East
- Africa
- South Africa
- Nigeria
- Kenya
- Rest of Africa
- Middle East
- North America
Detailed Research Methodology and Data Validation
Primary Research
Mordor analysts interview software product managers, supply-chain directors, 3PL planners, and regional integrators across North America, Europe, and fast-growing Asia Pacific. These discussions validate price bands, deployment preferences, and the pace at which predictive and prescriptive modules replace descriptive tools.
Desk Research
We first collect publicly available statistics from tier-1 sources such as the U.S. Census Bureau's Annual Survey of Manufactures, Eurostat's PRODCOM series, UN Comtrade shipment records, and industry association portals like ASCM and MHI. Company 10-Ks, investor presentations, and reputable business press help us size vendor revenue pools and adoption rates. Subscription assets, including D&B Hoovers for supplier financials and Dow Jones Factiva for deal flow, refine our baseline. Trade journals and patent databases (Questel) flag emerging analytics use cases. The sources named here illustrate the range used; many additional references support each datapoint.
Market-Sizing & Forecasting
A top-down model starts with global manufacturing value added, container throughput, and B2C parcel volumes, which are then mapped to typical analytics spend ratios by industry. Results are cross-checked through selective bottom-up roll-ups of leading vendor revenues and sampled average selling price times active installation counts. Key variables such as cloud migration rates, SKU level stock-out frequency, rate-per-mile freight indices, purchasing managers' indices, and sustainability reporting mandates feed a multivariate regression that generates the 2025-2030 forecast path. Where vendor disclosures are partial, inferred values are adjusted using regional adoption differentials confirmed during interviews, before being filtered through historical CAGR reasonability bands.
Data Validation & Update Cycle
Outputs pass three levels of analyst review, automated variance screens, and peer checks against independent indicators like AIS container dwell times. The dataset refreshes annually, with mid-cycle revisions triggered by material M&A, regulatory shifts, or macro shocks. An analyst reconfirms assumptions just before each client delivery.
Why Mordor's Supply Chain Analytics Baseline Earns Confidence
Published market values often diverge because firms select different functional scopes, pricing assumptions, and refresh cadences.
Key gap drivers here include whether professional services are bundled, the point in time at which cloud conversions are booked, and the currency year applied for regional roll-ups. Mordor's model separates software from services, converts all inputs to constant 2024 USD, and revisits variables every twelve months, which moderates volatility seen elsewhere.
Benchmark comparison
| Market Size | Anonymized source | Primary gap driver |
|---|---|---|
| USD 9.37 B (2025) | Mordor Intelligence | - |
| USD 9.46 B (2024) | Global Consultancy A | Bundles data-warehouse tools with analytics, inflating base |
| USD 5.20 B (2022) | Research Boutique B | Older base year and assumes fixed on-premise licensing mix |
| USD 6.95 B (2024) | Industry Databook C | Applies uniform 19% CAGR without regional adjustment |
Taken together, the comparison shows that once scope, currency, and timing are aligned, Mordor's disciplined variable selection and annual refresh deliver a balanced, transparent baseline that decision-makers can replicate with clear inputs and repeatable steps.


Key Questions Answered in the Report
Which analytics type is growing fastest?
Prescriptive analytics is expanding at 27.4% CAGR as firms seek automated recommendations rather than descriptive reports.
Why is cloud deployment so dominant?
Cloud models account for 62.31% of implementations because subscription pricing, rapid scaling, and easier partner connectivity outweigh legacy on-premise constraints.
How do sustainability regulations influence adoption?
EU CSRD and similar rules compel companies to trace and report Scope 3 emissions, propelling sustainability analytics at 28.9% CAGR.
Are small and medium enterprises embracing analytics?
Yes, SMEs are adopting at 27.9% CAGR because subscription pricing and Gen-AI interfaces reduce skill and budget barriers.
Page last updated on:


