
Market Overview
| Study Period | 2020 - 2031 |
|---|---|
| Market Size (2026) | USD 8.02 Billion |
| Market Size (2031) | USD 14.55 Billion |
| Growth Rate (2026 - 2031) | 12.65 % |
| Fastest Growing Market | North America |
| Largest Market | Asia Pacific |
| Market Concentration | Medium |
Major Players *Disclaimer: Major Players sorted in no particular order Image © Mordor Intelligence. Reuse requires attribution under CC BY 4.0. | |
Marketing Analytics Market Analysis by Mordor Intelligence
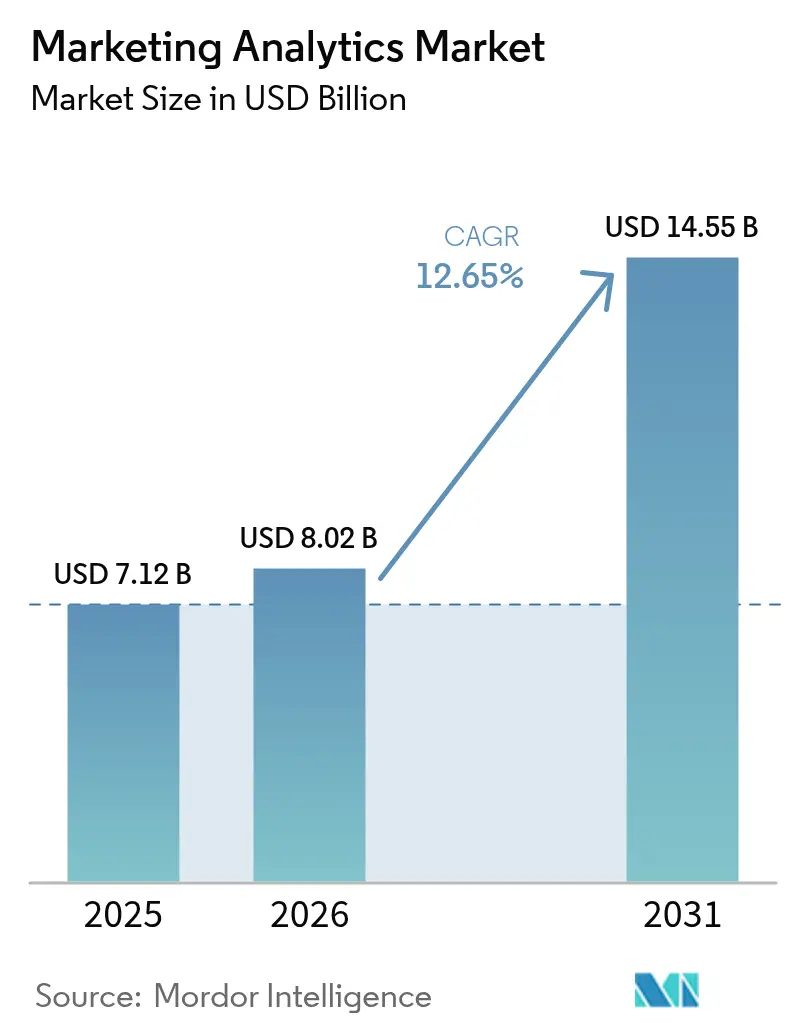
The marketing analytics market size is expected to grow from USD 7.12 billion in 2025 to USD 8.02 billion in 2026 and is forecast to reach USD 14.55 billion by 2031 at 12.65% CAGR over 2026-2031. This expansion is underpinned by enterprise-wide digitization, the shift toward first-party data strategies, and the maturation of artificial-intelligence engines that autonomously refine campaign spend. Cloud-native deployment now underwrites real-time decision velocity, while privacy mandates accelerate the transition from third-party to privacy-preserving analytics. Competitive intensity remains elevated because composable architectures let buyers combine best-of-breed modules rather than lock into monolithic suites-opening doors for niche specialists and hyperscalers alike. Meanwhile, geographic divergence persists: North America delivers the highest revenue pool, yet Asia Pacific posts the fastest growth trajectory as mobile-first consumer behavior fuels investments in cross-channel attribution.
Key Report Takeaways
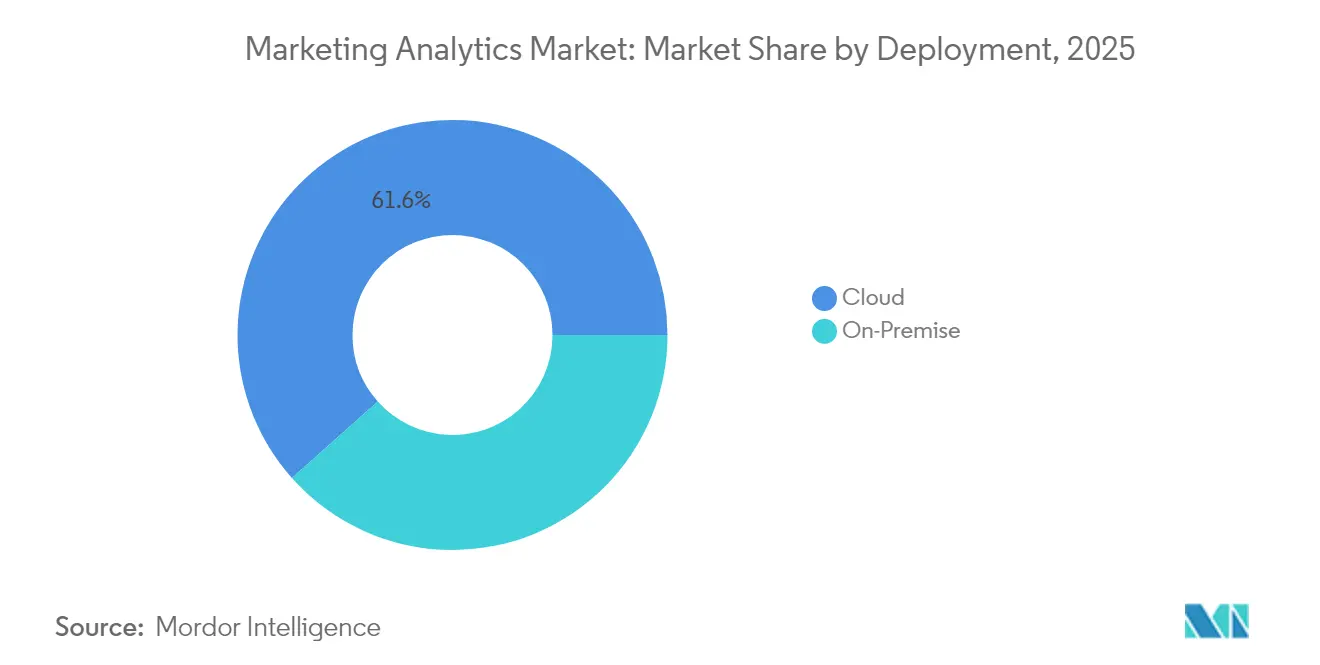
- By deployment, cloud models held 61.58% of the marketing analytics market share in 2025, and the segment is forecast to expand at a 12.96% CAGR through 2031.
- By application, social media marketing accounted for 36.93% of the marketing analytics market size in 2025 and is advancing at a 14.05% CAGR to 2031.
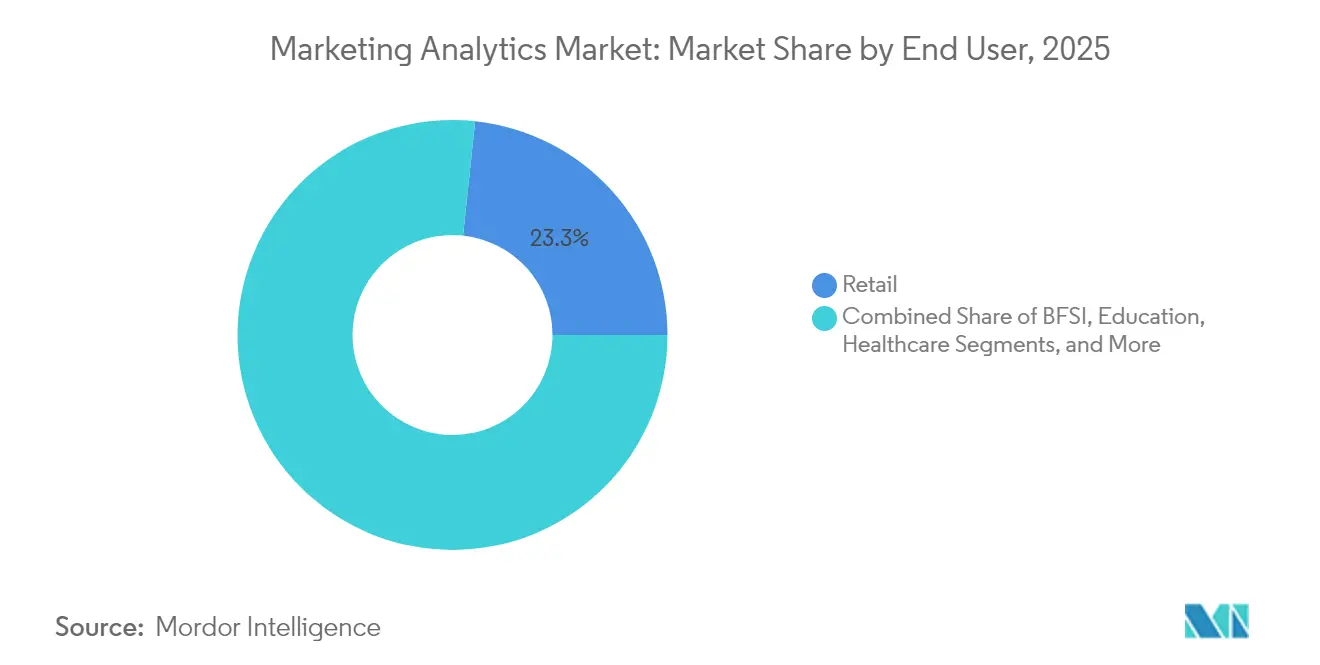
- By end user, retail led with 23.32% of the marketing analytics market share in 2025, while banking and financial services record the highest projected CAGR at 13.24% through 2031.
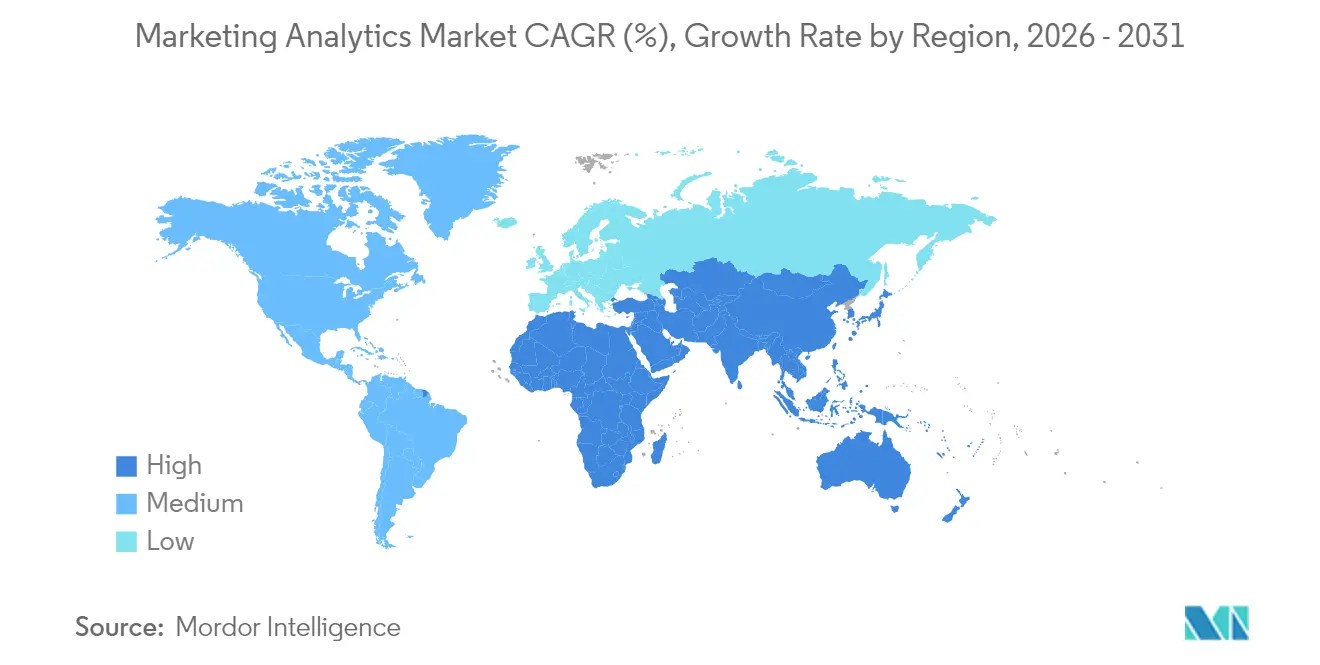
- By geography, Asia Pacific is projected to grow at 13.31% CAGR, outpacing all other regions, while North America retained 41.12% revenue share of the marketing analytics market size in 2025.
Note: Market size and forecast figures in this report are generated using Mordor Intelligence’s proprietary estimation framework, updated with the latest available data and insights as of 2026.
Global Marketing Analytics Market Trends and Insights
Drivers Impact Analysis*
| Driver | (~) % Impact on CAGR Forecast | Geographic Relevance | Impact Timeline |
|---|---|---|---|
| Widespread adoption of omnichannel campaign tracking | +2.1% | Global; stronger in North America and Europe | Medium term (2-4 years) |
| Demand for real-time analytics to optimize customer journeys | +2.8% | Global; led by Asia Pacific and North America | Short term (≤ 2 years) |
| Acceleration of cloud-native analytics platforms | +3.2% | Global; highest in North America and Europe | Medium term (2-4 years) |
| AI-powered predictive insights improving marketing ROI | +3.5% | Global; early adoption in North America and Asia Pacific | Long term (≥ 4 years) |
| Privacy sandbox forcing first-party data analytics investments | +1.9% | Primarily North America and Europe; expanding into Asia Pacific | Medium term (2-4 years) |
| Proliferation of composable CDPs enabling modular analytics | +1.7% | North America and Europe; rising adoption in Asia Pacific | Long term (≥ 4 years) |
| Source: Mordor Intelligence | |||
AI-Powered Predictive Insights Improving Marketing ROI
Machine-learning algorithms now assess purchase propensity, lifetime value, and churn probability in milliseconds, with accuracy above 85% in controlled tests. Google Analytics 4’s release of autonomous insight cards in July 2024 shows how embedded AI eliminates manual segmentation and reallocates spend toward high-yield cohorts, lifting ROI by 15-25% for adopters.[1]Google LLC, “Google Analytics 4 AI-Powered Insights,” google.com Predictive capabilities once limited to digital-native firms are therefore becoming table stakes, intensifying pressure on legacy vendors to infuse comparable models or risk displacement.
Acceleration of Cloud-Native Analytics Platforms
Enterprises are migrating to serverless stacks that elastically scale query workloads and cut provisioning cycles from weeks to minutes. Microsoft’s January 2025 linkage of Clarity behavioral logs to Google Ads datasets demonstrates cross-platform synthesis that was previously impractical on-premise.[2]Microsoft Corp., “Microsoft Clarity Integration with Google Ads,” microsoft.com The marketing analytics market consequently favors vendors that expose low-code APIs, enabling non-technical marketers to pin up experiments without IT queues.
Widespread Adoption of Omnichannel Campaign Tracking
Brands routinely manage touchpoints spanning mobile apps, connected TV, in-store kiosks, and social channels. Machine-learning-based attribution now weighs each interaction’s contribution to conversion, supplanting last-click rules that undervalued upper-funnel activity. Unified IDs derived from consented first-party data provide continuity as third-party cookies sunset, allowing marketers to sustain personalization while meeting regulatory thresholds.
Demand for Real-Time Analytics to Optimize Customer Journeys
Financial institutions such as Bank of America analyze more than 40 billion daily transactions with sub-second latency, proving that real-time analytics redefine competitive baselines.[3]Bank of America Corp., “Real-Time Transaction Processing Analytics,” bankofamerica.com Stream processing platforms ingest clickstream, IoT, and CRM feeds, refreshing propensity scores during live sessions. Marketers thus adjust offers mid-journey, boosting conversion and suppressing churn.
Restraints Impact Analysis*
| Restraint | (~) % Impact on CAGR Forecast | Geographic Relevance | Impact Timeline |
|---|---|---|---|
| High total cost of ownership and integration complexity | -2.3% | Global; higher impact in emerging markets | Short term (≤ 2 years) |
| Abundance of free and freemium analytics tools | -1.8% | Global; strongest in SMB segments | Medium term (2-4 years) |
| Stringent data governance and privacy regulations (GDPR, CCPA) | -2.7% | Primarily North America and Europe | Medium term (2-4 years) |
| Shortage of marketing data-science talent | -1.9% | Global; acute in Asia Pacific and emerging markets | Long term (≥ 4 years) |
| Source: Mordor Intelligence | |||
High Total Cost of Ownership and Integration Complexity
Platform fees represent a fraction of full program costs once data unification, schema harmonization, and quality assurance are tallied. Integration timelines stretch six to twelve months for firms saddled with legacy stacks, and ongoing maintenance often doubles original budgets over a three-year horizon. Mid-market companies without dedicated data engineers therefore gravitate toward lighter SaaS suites, narrowing accessible functionality.
Stringent Data Governance and Privacy Regulations
GDPR, CCPA, and similar laws oblige explicit consent, deletion triggers, and cross-border safeguards, inflating compliance spend and delaying deployments. Vendors respond by embedding differential privacy and federated learning to keep raw data in place, yet those techniques demand specialized skillsets and raise project complexity. Firms unable to resource legal and technical support risk fines or analytic blind spots.
*Our forecasts treat driver/restraint impacts as directional, not additive. The impact forecasts reflect baseline growth, mix effects, and variable interactions.
Segment Analysis
By Deployment: Cloud Dominance Drives Scalability
Cloud models captured 61.58% marketing analytics market share in 2025 and are projected to grow at 12.96% CAGR through 2031. The marketing analytics market size for cloud deployment is therefore on track to almost double during the forecast window. Enterprises choose cloud to access GPU-accelerated AI services and pay-as-you-use pricing that sidesteps capital outlays. On-premise installations persist in finance and healthcare where sovereignty rules demand local processing, but even these industries experiment with hybrid models that pipe de-identified data to the cloud for modeling.
Cloud-first spending patterns mirror a cultural pivot toward self-service analytics. Marketing teams now launch SQL-less dashboards, run uplift tests, and activate segments in media platforms without waiting for IT backlogs. Adobe’s partnership with Snowflake and Google BigQuery lets clients query petabyte-scale datasets directly inside analytics workspaces. This composability anchors future innovation, from real-time ad bidding to generative-AI copy optimization.



By Application: Social Media Marketing Leads Growth
Social media analytics contributed 36.93% to the marketing analytics market size in 2025, expanding at a forecast 14.05% CAGR. Marketers dissect sentiment, influencer lift, and campaign virality across short-form video and micro-blog ecosystems that continually spawn new formats. Email, content, and broader online marketing retain relevance yet grow at single-digit rates as privacy changes constrain cookie-centred retargeting.
Rising complexity propels demand for unified views that ascribe incremental sales to each touchpoint. Google’s open-source Meridian tool exemplifies marketing mix modeling that re-allocates spend toward under-credited channels. In-store digital signage, connected TV, and podcast ads join the attribution matrix, requiring modular connectors that feed data into a consistent schema for cross-channel journey reconstruction.
By End User: Retail Sector Maintains Leadership
Retail commanded 23.32% marketing analytics market share in 2025 and is forecast to grow at 12.74% CAGR as direct-to-consumer insurgents upend traditional value chains. Grocers, fashion labels, and marketplaces deploy real-time recommendation engines that recalibrate offers as shoppers scroll, lift basket size, and curb abandonment. Banking and financial services trail closely, driven by cross-sell analytics that elevate product per customer ratios while flagging fraud anomalies.
Healthcare organizations adopt engagement analytics to boost appointment adherence and remote-care enrolment, whereas manufacturers apply lead-scoring models to prioritize distributor outreach. Travel and hospitality players refine dynamic pricing and loyalty perks through guest-journey analytics. EPAM Systems finds that 74% of retail banks now prioritize revenue-generating use cases over cost reduction, underscoring a mature shift toward growth-oriented analytics.
Geography Analysis
North America held 41.12% revenue share of the marketing analytics market in 2025. Deep digital-advertising maturity, ample venture funding, and dense talent pools sustain sophisticated deployments, yet cookie deprecation pushes firms to accelerate first-party data capture and privacy-preserving attribution. State-level bills echoing CCPA broaden compliance scope, extending implementation lead times.
Asia Pacific drives the highest expansion at 13.31% CAGR through 2031. Regional digital-ad spend surpasses USD 200 billion in 2025, underwritten by 1.8 billion mobile internet users who browse and buy via super-apps. China and India anchor scale, while Southeast Asian markets embrace multi-language insights and cross-border payments. Variability in privacy statutes compels vendors to deliver granular localization and zero-data-export designs.
Europe benefits from GDPR-sparked urgency to cultivate first-party databases and invest in federated analytics. Germany, France, and the United Kingdom champion privacy-by-design, but fragmented language and regulatory nuances necessitate region-specific consultative support. Middle East and Africa and South America progress from exploratory pilots to scaled rollouts, prioritizing mobile social commerce metrics and low-latency dashboards that fit bandwidth constraints.

Regulatory Landscape
Marketing analytics is being shaped by tightening privacy and data-governance regimes that affect consent, purpose limitation, deletion rights, and cross-border transfers, which in turn influences identity resolution, attribution, and audience activation. In Europe, GDPR and in the United States, CCPA-style requirements continue to push organizations toward more robust documentation and security expectations for data processing used in profiling and campaign optimization.
Regulatory convergence is also raising compliance complexity across platforms. In the EU, the AI Act entered into force on 1 August 2024, and upcoming transparency obligations for certain AI systems (including generative AI-related requirements under Article 50) apply from 2 August 2026, requiring vendors to strengthen explainability and disclosure workflows in analytics-driven marketing. The European Commission and the European Data Protection Board released a draft of Joint Guidelines on the interplay between the Digital Markets Act and GDPR on 9 October 2025, sharpening scrutiny of gatekeeper data practices and reuse of consented data for advertising measurement and personalization. In the United States, federal privacy efforts remain active, including the introduction of the Consumer Data Privacy and Security Act of 2026 (S. 4211) on 25 March 2026 and parallel proposals such as H.R. 8413, indicating movement toward national standards that affect data processing, security programs, and international data flows used in marketing analytics.
Value Chain Analysis
The marketing analytics value chain starts with data generation and ingestion across first-party enterprise systems (CRM, ERP, web/app analytics), ad-tech and martech platforms (DSPs, ad servers, social networks), and commerce and retail media ecosystems. Data then passes through collation and processing layers, increasingly using cloud lakehouse and data-hub architectures, before being modeled into marketing data marts for BI, AI/ML, attribution, and experimentation. Outputs are operationalized through downstream activation, including audience segmentation, journey orchestration, bid optimization, personalization, and retail media execution.
Interoperability and normalization remain recurring friction points, since fragmented schemas and identity constraints across a large set of platforms can add latency and governance overhead. Investment is ongoing in integrated, cloud-native platforms and connectors that reduce silos and speed activation, as reflected in Pacvue expanding AI-powered commerce media capabilities (including cross-retailer media planning and integrations spanning Amazon AMC and DSP) to address activation bottlenecks. Service providers and system integrators also support implementation and change management, while cloud infrastructure and reference architectures from providers such as AWS and Microsoft help underpin scalable ingestion and real-time processing for always-on measurement.
Competitive Landscape
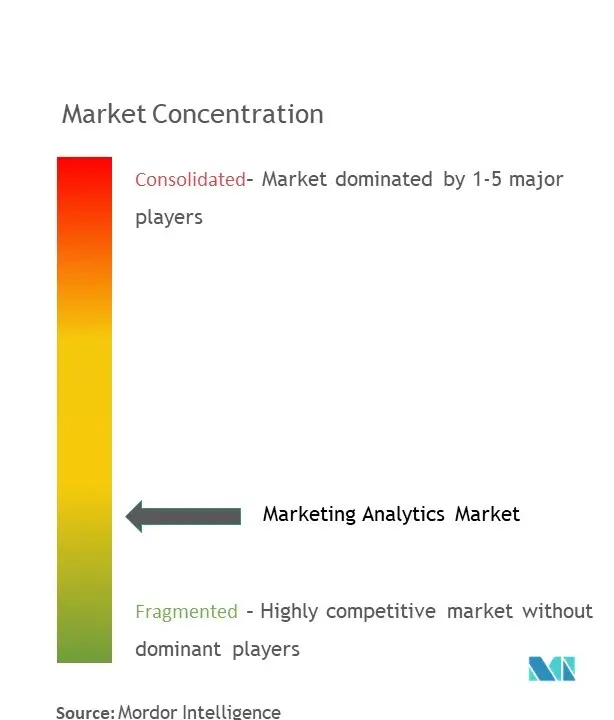
The marketing analytics market exhibits moderate consolidation. Adobe, Salesforce, Oracle, and Google integrate analytics into omnichannel experience clouds, collectively holding roughly 28% share. Hyperscalers leverage serverless infrastructure and proprietary AI chips to outpace legacy vendors on cost-to-compute and training throughput. Smaller specialists differentiate through verticalized models-for example, retail pricing algorithms or privacy sandboxes that maintain utility post-cookie.
Strategic moves emphasize AI agents that automate campaign optimization, composable customer data platforms, and privacy-centric collaboration environments. Adobe’s March 2025 release of AI agents trims manual workflows by 40%. Salesforce’s 2024 acquisition of data-protection firm Own augments compliance credentials, while Oracle embeds churn classifiers achieving 90% accuracy. The battlefield shifts toward modularity: buyers demand open APIs to plug analytics into existing stacks, fostering an ecosystem where best-of-breed vendors coexist with suite incumbents.
Marketing Analytics Industry Leaders
IBM Corporation
Microsoft Corporation
Oracle Corporation
Salesforce.Com Inc.
Accenture PLC
- *Disclaimer: Major Players sorted in no particular order

Market Opportunities and Future Outlook
A key whitespace is operationalizing first-party, privacy-safe measurement across fragmented channels (social, CTV, retail media, and commerce) without relying on deprecated identifiers. This is lifting demand for composable architectures that connect marketing analytics to enterprise data platforms and activation endpoints, as buyers place more emphasis on cross-platform synthesis (for example, linking behavioral analytics datasets with ad platforms) and modular connectors that reduce integration timelines and total cost of ownership.
Enterprise centralization and AI infrastructure build-outs are also creating pathways for marketing analytics deployments, especially in Asia Pacific where mobile-first usage and rising digital-ad activity increase the complexity of omnichannel measurement. In India, large-scale AI and cloud infrastructure commitments such as Amazon’s June 2026 announcement of an additional USD 13 billion investment (raising total commitment to USD 48 billion) expand the compute and data foundations used for analytics workloads, while corporate moves to consolidate digital capabilities via Global Capability Centers, such as Dabur establishing GCCs including a dedicated digital marketing hub in June 2026, increase internal demand for standardized data models, automation, and repeatable measurement. Agentic analytics features further support opportunity for vendors that can embed autonomous optimization and governance controls into cloud-native suites, differentiating around explainability, auditability, and closed-loop activation rather than dashboarding alone.
Recent Industry Developments
- July 2026: Accenture Edge and Google Cloud announced a suite of pre-built agentic AI solutions, including capabilities positioned for personalized marketing and customer intelligence for mid-market companies. This packages advanced automation into repeatable offerings and extends agent-based workflows from large-enterprise programs into broader segments, adding competitive pressure on standalone point tools.
- June 2026: NIQ introduced NIQ Cadence, a compound AI operating system for marketing effectiveness that includes 19 specialized agents coordinated by NIQ Optiq. This expands the market narrative from analytics dashboards toward coordinated agents that connect measurement to execution across workflows.
- November 2025: Accenture Ventures invested in Alembic, an AI-powered causal marketing intelligence platform. The investment highlights emphasis from buyers and investors on causal measurement approaches that support spend reallocation across channels amid identity and attribution constraints.


Research Methodology Framework and Report Scope
Market Definition and Coverage
For this methodology, the marketing analytics market covers software used by organizations to collect, organize, and analyze marketing performance data so teams can plan, optimize, and measure campaigns across channels.
Scope exclusions: We exclude general IT analytics tools that are not built or sold for marketing use cases, and we also exclude pure media spend pass-through that does not relate to analytics revenue.
Segmentation Overview
- By Deployment
- Cloud
- On-Premise
- By Application
- Online Marketing
- Email Marketing
- Content Marketing
- Social Media Marketing
- Other Applications
- By End User
- Retail
- Banking and Financial Services
- Education
- Healthcare
- Manufacturing
- Travel and Hospitality
- Other End Users
- By Geography
- North America
- United States
- Canada
- Mexico
- South America
- Brazil
- Argentina
- Rest of South America
- Europe
- United Kingdom
- Germany
- France
- Italy
- Spain
- Russia
- Rest of Europe
- Asia Pacific
- China
- Japan
- India
- South Korea
- Australia and New Zealand
- Southeast Asia
- Rest of Asia Pacific
- Middle East
- United Arab Emirates
- Saudi Arabia
- Turkey
- Rest of Middle East
- Africa
- South Africa
- Nigeria
- Egypt
- Rest of Africa
- North America
Data Sources, Market Sizing, and Validation
Desk Research
Desk research started with building a clear demand story for marketing measurement and decision-making, and then mapping how vendors typically monetize analytics (subscriptions, licenses, and related support). We used public sources such as the US Bureau of Economic Analysis, the US Census Bureau, the OECD, the International Telecommunication Union, and World Bank indicators to ground the macro environment that influences digital adoption and business spending.
We also reviewed company annual reports, investor presentations, earnings call transcripts, and reputable press coverage to understand product positioning and where revenue is recognized as analytics versus adjacent martech tools. In addition, we used a paid subscription for company financials and news screening, plus a paid patent database to sanity-check where innovation is concentrated and which capabilities are being prioritized. The desk sources listed here are illustrative, and many other public and paid references were used to collect data, validate assumptions, and clarify gaps.
Primary Interviews and Surveys
Primary interviews and surveys were used to test real buying patterns and practical usage, which is where desk sources often stay vague. We spoke with a mix of platform owners, system integrators, and enterprise users across key regions so assumptions on adoption, renewal behavior, and pricing could be tightened before totals were finalized.
Distribution of primary research fieldwork respondents
| Company type | Respondent position | Region |
|---|---|---|
| Top tier: 25% | CXOs: 12% | APAC: 43% |
| Mid tier: 60% | Functional/Unit leaders: 32% | EMEA: 32% |
| Smaller Players: 15% | Managers: 56% | Americas: 25% |
Market-Sizing & Forecasting
Sizing was built using a top-down approach where overall enterprise software and digital marketing enablement spending is reconstructed into an addressable pool, and then filtered using marketing analytics penetration and typical spend intensity by industry and region. To keep the total realistic, we corroborated results with selective bottom-up checks, such as sampled vendor revenue disclosures, channel feedback on deal sizes, and an ASP times volume approximation for paid seats where that signal was available.
Key inputs that shaped the model included cloud versus on-premises mix, average contract values by enterprise size, adoption of attribution and measurement workflows, marketing budget direction, and data privacy changes that shift how measurement is done. When bottom-up signals had gaps, the missing pieces were bridged through peer comparisons across similar customer cohorts and then re-tested during interviews. Forecasting used scenario analysis supported by expert views on budget cycles and product roadmaps, and then growth rates were adjusted by region based on digital maturity and expected analytics penetration.
Data Validation & Update Cycle
Outputs were checked against independent signals like enterprise software spending direction, vendor-reported growth commentary, and regional adoption patterns observed in interviews. Any large jumps by year, unusual regional shares, or pricing assumptions that looked stretched were flagged, reviewed again, and corrected before sign-off.
Reports are refreshed annually, and interim updates are made when major events materially change demand or pricing, such as a sharp shift in privacy rules or enterprise IT spending. Before delivery, a fresh analyst pass is completed so clients receive the most current view that can be traced back to clear assumptions and cross-checks.
Mordor Intelligence's Marketing Analytics Market Sizing Compared With Other Published Estimates
Published market sizes for marketing analytics often do not match, and the reason is usually not math, it is what is being counted and how it is projected. Differences show up when a study mixes software with services, includes adjacent martech categories, or uses a different base year and currency timing.
The main gap comes from scope creep into broader marketing platforms and services bundles, where Mordor Intelligence counts marketing analytics as analytics software revenue tied to measurement and optimization use cases, rather than folding in wider marketing technology spend that sits outside analytics.
Benchmark comparison
| Source | Market Size | Gaps in Research Methodology |
|---|---|---|
| Mordor Intelligence | USD 8.02 B (2026) | |
| Industry Publisher A | USD 6.15 B (2024) | Uses an earlier base year and a longer horizon, and it also appears to include services along with tools, which can shift totals depending on how implementation and support are counted. |
| Research House B | USD 5.80 B (2025) | Splits software and services explicitly and reports a different base year level, which can diverge from software-only treatments and from pricing progression assumptions used for renewals and upgrades. |
Looking across the three figures, the spread is mostly explained by what gets included beyond software, plus base-year choice and how pricing is stepped forward over time. Our approach keeps the total tied to repeatable signals like adoption, contract values, and deployment mix, and then it is rechecked with interviews so the final number stays practical for planning.


Key Questions Answered in the Report
How big is the marketing analytics market in 2026?
The market stands at USD 8.02 billion in 2026 and is projected to reach USD 14.55 billion by 2031.
Which region grows fastest in marketing analytics?
Asia Pacific posts the highest CAGR at 13.31% through 2031 due to mobile-first consumer behavior and surging digital-ad spend.
Why are cloud deployments preferred for analytics?
Cloud models offer elastic scaling, lower capital outlay, and access to embedded AI services that accelerate experimentation.
What fuels retails continued leadership?
Retailers invest in real-time personalization engines to compete with direct-to-consumer challengers and lift conversion rates.
How do privacy laws influence marketing analytics?
GDPR and CCPA drive first-party data strategies and the adoption of privacy-preserving analytics, raising compliance costs but enhancing data quality.
Page last updated on:





