Sustainable Manufacturing Market Size and Share
Market Overview
| Study Period | 2019 - 2030 |
|---|---|
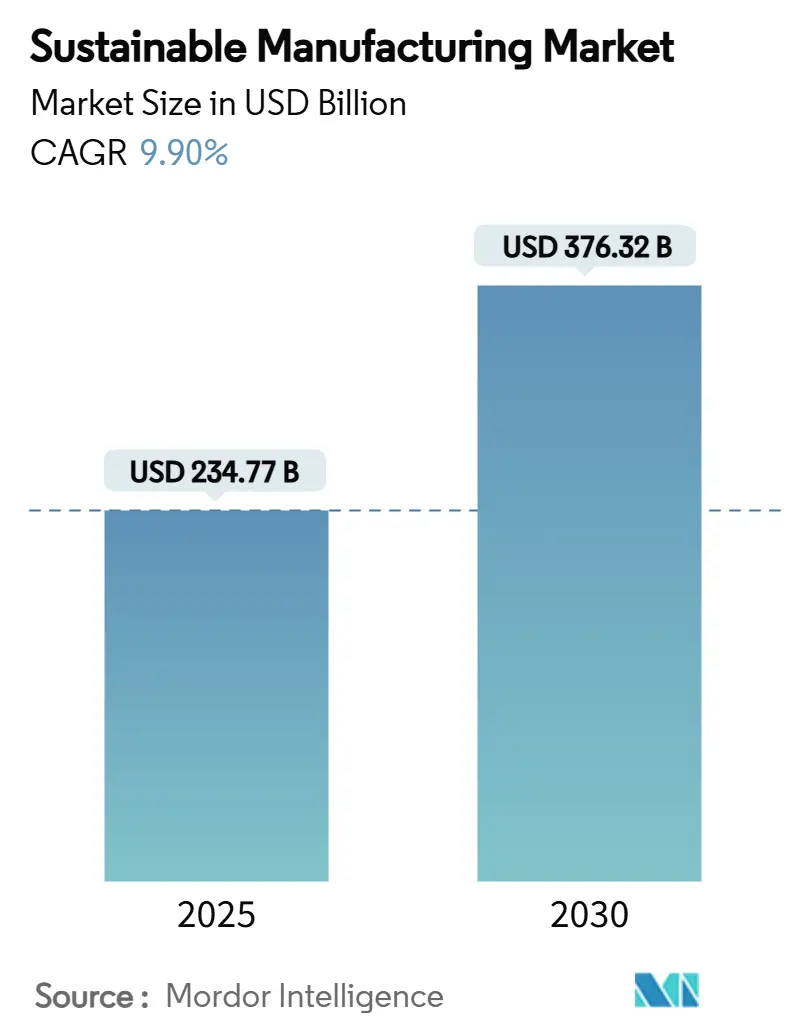
| Market Size (2025) | USD 234.77 Billion |
| Market Size (2030) | USD 376.32 Billion |
| Growth Rate (2025 - 2030) | 9.90% CAGR |
| Fastest Growing Market | Asia Pacific |
| Largest Market | Europe |
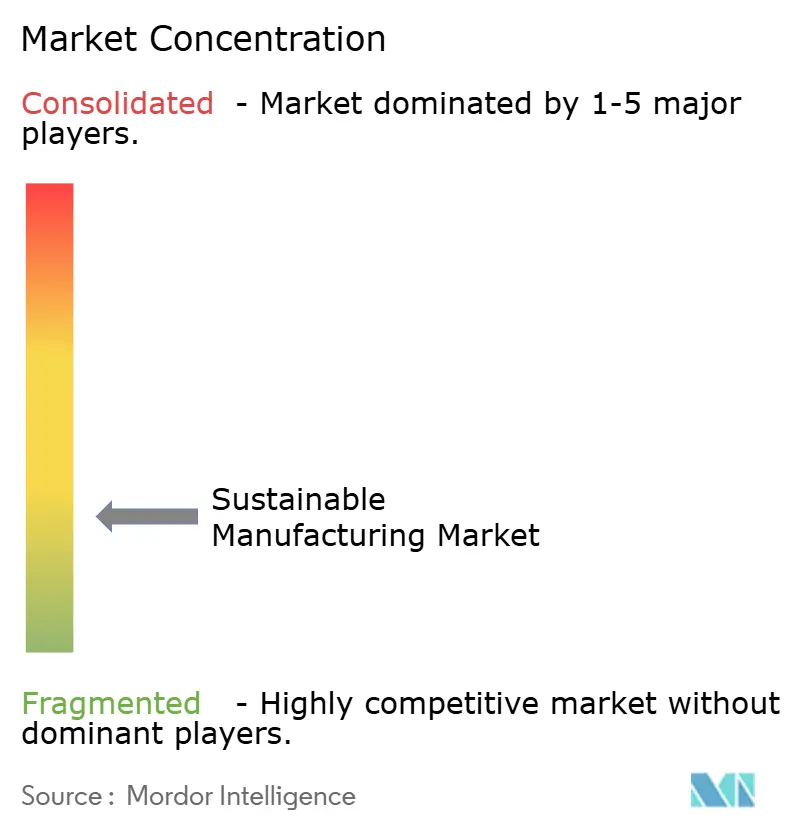
| Market Concentration | Low |
Major Players *Disclaimer: Major Players sorted in no particular order Image © Mordor Intelligence. Reuse requires attribution under CC BY 4.0. | |
Sustainable Manufacturing Market Analysis by Mordor Intelligence
The Sustainable Manufacturing market size reached USD 234.77 billion in 2025 and is forecast to soar to USD 376.32 billion by 2030, reflecting a compelling 9.90% CAGR that underscores how decarbonization mandates, resource-efficiency imperatives, and digital optimization are reshaping global production systems. Corporations are re-engineering plants around electrification, advanced waste valorization, and low-carbon energy, catalyzed by the EU Emissions Trading System’s rising allowance prices and similar carbon-pricing schemes in California and South Korea. Mature industries now view carbon as a cost of goods sold, which pushes investment toward energy-efficient equipment, industrial heat pumps, and AI-enabled process controls. Simultaneously, low-interest sustainability-linked loans are trimming the cost of capital for compliant projects, shifting payback conversations from speculative to bankable. Competitive pressure is intensifying as tier-one suppliers embed lifecycle metrics into bid documents, forcing smaller manufacturers to modernize or risk disqualification from premium value chains.[1]Rockwell Automation, “Sustainability Report 2024,” rockwellautomation.com
Key Report Takeaways
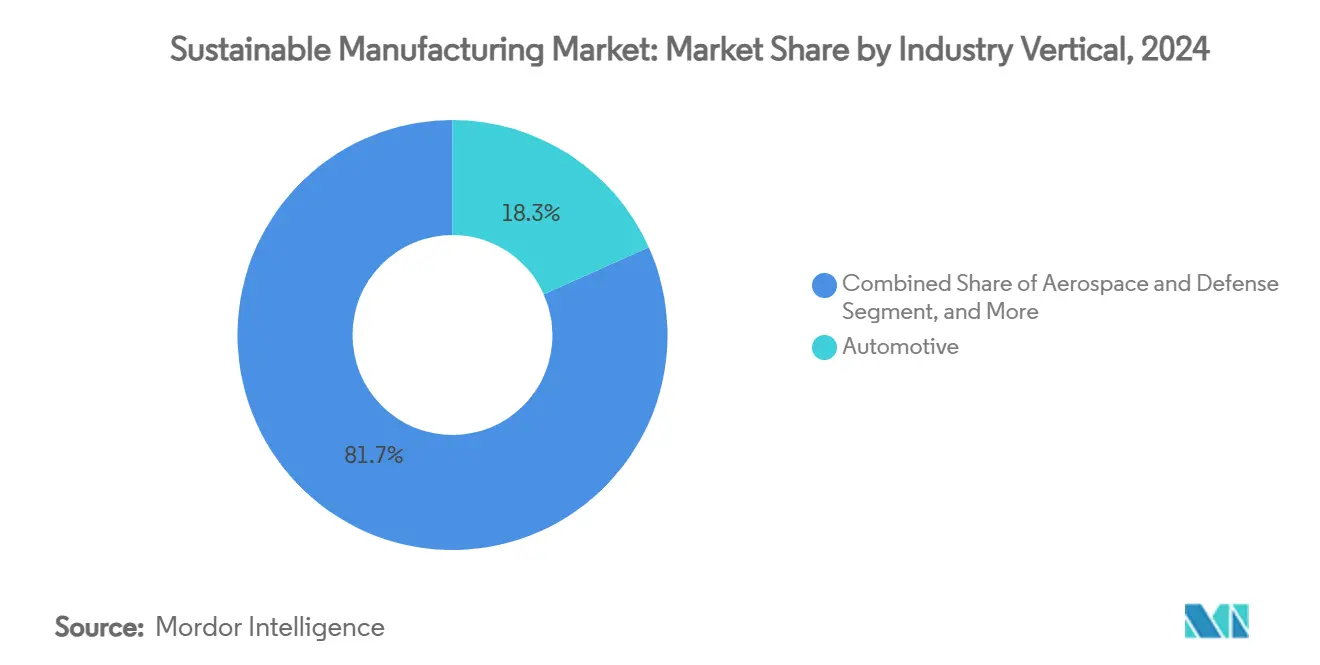
- By industry vertical, automotive led with 18.3% of sustainable manufacturing market share in 2024, while electronics & semiconductors are projected to expand at a 9.2% CAGR through 2030.
- By technology, energy-efficient equipment commanded 35.2% share of the sustainable manufacturing market size in 2024; carbon capture and utilization is advancing at an 8.4% CAGR to 2030.
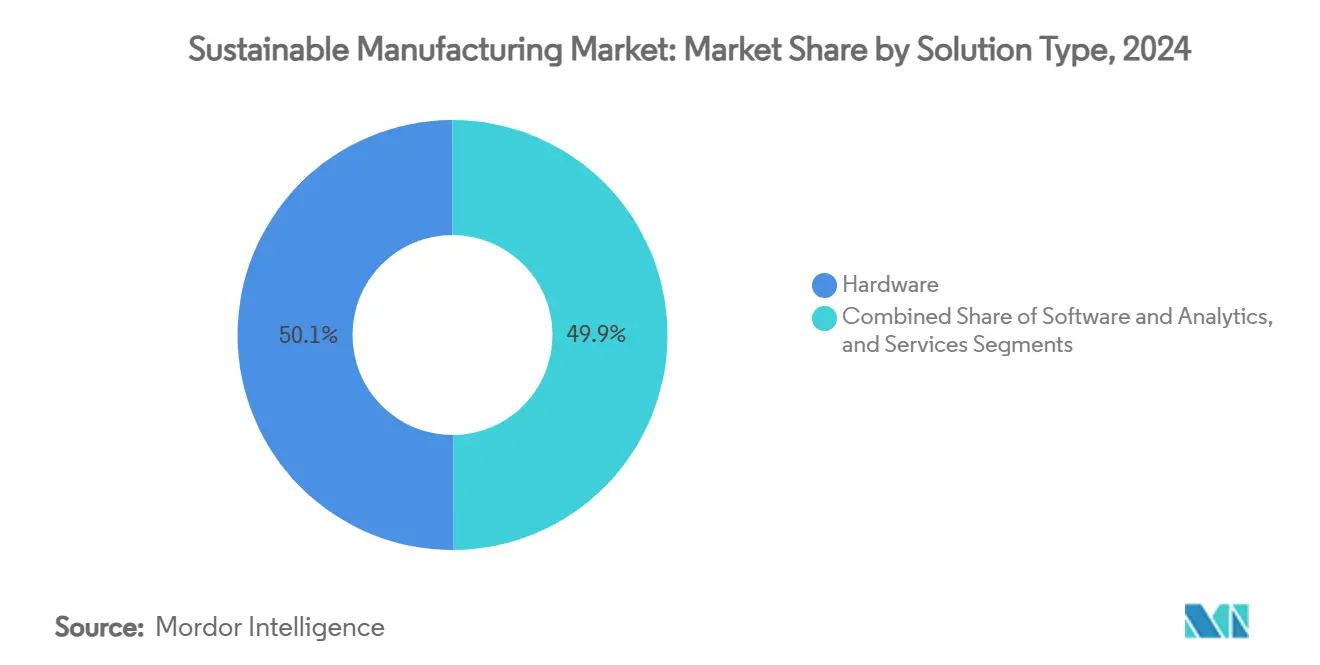
- By solution type, hardware retained 50.1% share of the sustainable manufacturing market size in 2024, whereas software & analytics record the highest projected CAGR at 9.1% through 2030.
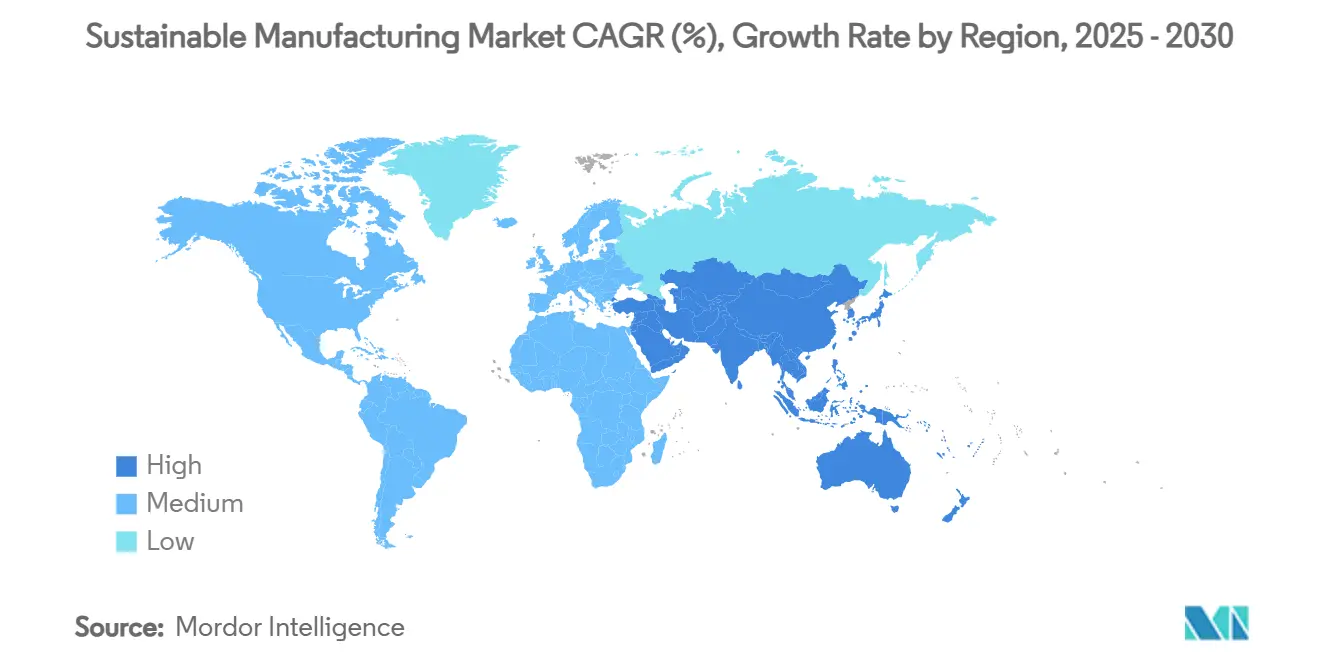
- By geography, Europe accounted for 32.2% revenue share in 2024 and APAC remains the fastest-growing region with a 9.3% CAGR to 2030.
Global Sustainable Manufacturing Market Trends and Insights
Drivers Impact Analysis*
| Driver | (~) % Impact on CAGR Forecast | Geographic Relevance | Impact Timeline |
|---|---|---|---|
| Regulatory push for net-zero manufacturing | +2.1% | Global, led by EU and California | Medium term (2–4 years) |
| Rising corporate ESG commitments | +1.8% | Global, concentrated in developed markets | Long term (≥ 4 years) |
| Cost savings via resource efficiency | +1.5% | Global, highest impact in energy-intensive areas | Short term (≤ 2 years) |
| Circular procurement mandates by OEMs | +1.2% | North America & EU, expanding to APAC | Medium term (2–4 years) |
| AI-driven real-time energy optimisation adoption | +0.9% | APAC core, spill-over to developed markets | Long term (≥ 4 years) |
| Green finance-linked loan covenants | +0.7% | Europe & North America, emerging in APAC | Medium term (2-4 years) |
| Source: Mordor Intelligence | |||
Regulatory Push for Net-Zero Manufacturing
Mandatory carbon-reduction targets are transforming sustainability from a discretionary initiative into a hard compliance issue. The EU Net-Zero Industry Act, operational since 2024, binds manufacturers to progressive emissions caps and links non-compliance to financial penalties, while California’s updated cap-and-trade program now includes selected Scope 3 categories.[2]California Air Resources Board, “Cap-and-Trade Program,” arb.ca.govThese statutes remove ambiguity from investment decisions, effectively guaranteeing a demand floor for renewable integration, electrified process heat, and circular-economy solutions. Technology vendors benefit because policy clarity shortens sales cycles and expands addressable budgets. Over the medium term, similar schemes in Canada and Japan are expected to amplify the global pull for certified low-carbon components.
Rising Corporate ESG Commitments
Institutional investors routinely embed emissions metrics in shareholder resolutions, compelling multinationals to align capital allocation with science-based targets. Nestlé linked 15% of executive variable pay to sustainability performance and earmarked CHF 1.2 billion (USD 1.36 billion) for regenerative agriculture, creating predictable demand for traceable and low-carbon ingredients across its manufacturing footprint.[3]Nestlé, “Nestlé Non-Financial Statement 2024,” nestle.com Peer companies in electronics and automotive are following suit, fostering a runway of long-cycle orders for energy-efficient motors, waste-heat recovery systems, and digital twins. Because these targets often extend beyond regulatory minima, they help sustain technology adoption even in jurisdictions with modest policy pressure.
Cost Savings via Resource Efficiency
Return-on-investment math has swung definitively in favor of high-efficiency assets. Smart energy-management platforms routinely cut utility bills 15–25%, while closed-loop waste systems reclaim materials worth 30–40% of prior disposal costs. Such quick savings allow CFOs to fund sustainability upgrades internally, mitigating reliance on third-party financing. Short payback horizons also encourage plant-level pilots that can be replicated across regional networks, generating compounding efficiency dividends. In energy-intensive sectors, the margin relief from cutting fossil-fuel input can outweigh the amortized capital charge within two fiscal cycles.
Circular Procurement Mandates by OEMs
Vehicle and electronics assemblers have started to assign formal weighting to recycled content, end-of-life takeback, and CO₂ per unit in supplier scorecards. For instance, leading German automotive groups require a minimum share of secondary aluminum in body panels, reshaping upstream metal casting operations.[4]European Commission, “EU Emissions Trading System (EU ETS),” Climate Action, climate.ec.europa.eu Suppliers now deploy blockchain-enabled material-traceability systems, robotics-driven dismantling cells, and advanced sorting lines to satisfy tender criteria. As these mandates diffuse across additional tiers, they act as a demand signal for both process adjustments and enabling software, boosting adoption momentum in the sustainable manufacturing market.
Restraints Impact Analysis*
| Restraint | (~) % Impact on CAGR Forecast | Geographic Relevance | Impact Timeline |
|---|---|---|---|
| High upfront CAPEX for retrofitting brownfield plants | -1.4% | Global, highest impact in mature industrial regions | Short term (≤ 2 years) |
| Complexity of fragmented standards | -0.8% | Global, particularly affecting multi-regional operations | Medium term (2-4 years) |
| Scarcity of low-carbon industrial heat solutions | -0.6% | Global, concentrated in process industries | Long term (≥ 4 years) |
| Cyber-physical security risks in connected factories | -0.5% | Developed markets with advanced digitalization | Medium term (2-4 years) |
| Source: Mordor Intelligence | |||
High Upfront CAPEX for Retrofitting Brownfield Plants
Modernizing legacy facilities for low-carbon output often requires multimillion-dollar investments in electrified kilns, variable-speed drives, and carbon-capture modules. Typical retrofit packages range between USD 50 million and USD 200 million, with payback stretched across 5–8 years despite operational savings. Mid-sized suppliers, which form the backbone of automotive and electronics supply chains, struggle to raise such sums, even as prime contractors tighten emissions specifications. Although green-bond and sustainability-linked loan volumes are expanding, many issuers face higher disclosure burdens and rating-agency scrutiny that can slow deal flow. The cash-flow mismatch between upfront spend and staggered savings therefore constrains adoption, particularly in cyclical industries.
Complexity of Fragmented Standards
Manufacturers operating across continents juggle multiple carbon-accounting protocols, waste classifications, and energy-management frameworks. The absence of a universal taxonomy forces companies to implement parallel reporting systems, elevating audit costs and complicating data interoperability. Vendors, in turn, must customize software connectors and digital twins for each regulatory silo, raising total cost of ownership. Efforts to harmonize standards under ISO and IEC umbrellas are progressing, but near-term misalignment remains a brake on global rollouts, especially for multinational firms with diversified product portfolios.
*Our forecasts treat driver/restraint impacts as directional, not additive. The impact forecasts reflect baseline growth, mix effects, and variable interactions.
Segment Analysis
By Industry Vertical: Automotive Leads Electrification Wave
The sustainable manufacturing market size for automotive production commanded 18.3% revenue share in 2024 as battery-electric vehicle lines proliferated and supply chains decarbonized to meet fleetwide emissions ceilings. Battery packs, lightweight composites, and precision electronics have forced carmakers to overhaul plant layouts, adopt high-temperature heat pumps, and secure renewable energy power-purchase agreements. Electronics & semiconductors, while smaller, are pacing the field with a 9.2% CAGR as fabs integrate high-efficiency chillers and closed-loop water systems to contain Scope 1 and Scope 2 footprints.
Middle-tier segments such as chemicals, aerospace, and consumer goods are adapting more gradually due to certification cycles and chemistry constraints, yet regulatory signals and brand commitments are nudging them toward low-carbon feedstocks and circular packaging. Food & beverage producers, front-loaded by Nestlé’s regenerative farming investments, have pushed renewable-power penetration above 90% across multiple continents, providing a template for peers. These cross-sector developments reinforce momentum in the sustainable manufacturing market by establishing credible proof points that efficiency gains can coexist with throughput and quality demands.


By Technology: Energy Efficiency Dominates Current Deployments
Energy-efficient equipment accounted for 35.2% of sustainable manufacturing market share in 2024, anchored by smart drives, LED retrofits, and optimized combustion control that deliver rapid financial returns. Adoption of industrial heat pumps capable of reaching 200 °C is broadening the addressable process-heat envelope, unlocking opportunities in food, paper, and certain specialty-chemicals lines. Carbon capture and utilization, despite representing a smaller installed base, is surging at an 8.4% CAGR as policy credit regimes and synthetic-fuel offtake agreements crystallize around CO₂-derived intermediates.
Advanced waste-management platforms now integrate robotics, AI vision, and IoT sensors to maximize recovery value and minimize landfill exposure, while zero-liquid-discharge systems see early uptake in water-restricted zones. Renewable-energy integration solutions couple rooftop solar, on-site wind, and stationary storage with digital microgrid controllers to stabilize quality-critical process loads. This layered technology palette is knitting together into holistic operating platforms that better orchestrate mechanical assets, digital twins, and market signals, thereby raising the sophistication level-and lifetime value-of sustainability projects in the sustainable manufacturing market.
By Solution Type: Hardware Foundation Enables Digital Optimization
Hardware still represented 50.1% of sustainable manufacturing market size in 2024 because energy-efficient motors, electrified boilers, and recovery heat exchangers form the physical backbone of green factories. Even so, software & analytics are climbing at a 9.1% CAGR as factories roll out predictive-maintenance suites, AI-based dispatch algorithms, and carbon-intensity dashboards that unlock incremental savings beyond mechanical retrofits. Outcome-based service models are gaining traction, with integrators offering performance-linked contracts that guarantee emission or consumption thresholds across multiyear horizons.
System integrators must now fuse OPC-UA data streams, edge controllers, and cloud APIs while conforming to heterogeneous security protocols, complicating project scopes but also enlarging consulting revenue pools. The convergence of hardware upgrades and digital overlays signals a maturing customer preference for turnkey packages that de-risk complexity and shorten time-to-value, reinforcing the flywheel of adoption across the sustainable manufacturing market.
Geography Analysis
Europe retained 32.2% share of global revenues in 2024 by coupling carbon-pricing disciplines with robust green-finance channels that lower borrowing costs for compliant projects. Germany’s Climate and Transformation Fund subsidizes industrial heat-pump pilots, while France leverages nuclear baseload to decarbonize metals and chemicals. The Netherlands and Denmark have pioneered circular-economy benchmarks that embed lifecycle metrics in public procurement, steering private suppliers toward recyclable inputs and design-for-disassembly principles. These structural signals create a reinforcing cycle between policy, finance, and market demand, keeping Europe at the forefront of sustainable manufacturing market leadership.
APAC is the momentum engine, clocking a 9.3% CAGR through 2030. China’s industrial decarbonization five-year plan funnels grants toward electrified kilns, circular plastics, and localized photovoltaic capacity, while Japan’s Green Transformation program commits significant fiscal incentives to CO₂ removal and next-generation storage. South Korea’s K-New Deal layers digital-twin subsidies onto energy-efficiency rebates, accelerating technology diffusion into small and medium enterprises. India infuses sustainability criteria into Production-Linked Incentive schemes, stimulating domestic capacity in energy-efficient machinery and recycled polymers. Collectively, these moves expand market depth and open diverse entry points for OEMs and integrators.
North America combines federal tax credits with state-level rigor. The Inflation Reduction Act channels USD-denominated manufacturing incentives toward clean-tech components, while California’s cap-and-trade program now prices emitted carbon higher than EUR 90 per ton equivalent, pushing plants to retrofit. Canada’s output-based pricing system layers similar pressures on energy-intensive extraction and smelting industries. Mexico, seeking to preserve USMCA market access, is rolling out renewable-power corridors and low-carbon certification schemes for maquiladora clusters. Elsewhere, South America, the Middle East, and Africa are inching forward via sector-specific pilots in mining, petrochemicals, and cement, thereby internationalizing supplier standards and broadening the sustainable manufacturing market’s geographic footprint.

Competitive Landscape
The sustainable manufacturing market is moderately concentrated, with Siemens, Schneider Electric, and ABB leveraging installed bases and lifetime-service frameworks to cross-sell decarbonization modules, from smart drives to on-site renewables. Their edge derives from global service networks and deep process know-how, which ease retrofit risk for large multinationals. Nonetheless, specialist cleantech firms-particularly in carbon capture, AI optimization, and advanced waste valorization, are carving niches by innovating faster and partnering aggressively with regional integrators.
Mergers and partnerships are accelerating as incumbents seek breadth in software analytics and sector-tailored applications. Platform thinking dominates: vendors bundle hardware, digital twins, and financing to guarantee performance outcomes. Intellectual-property filings for AI-driven control loops, modular CCU units, and recyclable composites rose sharply in 2024, signaling a pivot from component sales toward integrated ecosystems.
Regional players with policy fluency and localized supply chains continue to find space in mid-tier markets, especially where language, compliance, or distribution barriers favor trusted domestic brands. This competitive tapestry underscores a power shift toward companies that can orchestrate multi-technology rollouts across continents, rather than merely supplying discrete equipment.
Sustainable Manufacturing Industry Leaders
Siemens AG
Schneider Electric SE
ABB Ltd.
General Electric Company
Johnson Controls International PLC
- *Disclaimer: Major Players sorted in no particular order

Recent Industry Developments
- January 2025: AspenTech launched its Strategic Planning for Sustainability Pathways solution, using generative AI to map long-term decarbonization scenarios for asset-heavy industries; the move strengthens AspenTech’s advisory value chain and embeds the company earlier in capital-allocation cycles.
- December 2024: Rockwell Automation partnered with NEO Battery Materials to automate a 240-ton silicon-anode facility in Canada, positioning Rockwell to capture downstream EV-battery manufacturing spend while showcasing its discrete-manufacturing credentials.


Global Sustainable Manufacturing Market Report Scope
| Automotive |
| Aerospace and Defense |
| Electronics and Semiconductors |
| Chemicals and Materials |
| Food and Beverage |
| Textiles and Apparel |
| Pharmaceuticals |
| Others |
| Renewable Energy Integration |
| Energy-Efficient Equipment |
| Advanced Waste Management and Circularity |
| Water and Effluent Management |
| Carbon Capture and Utilisation |
| Hardware |
| Software and Analytics |
| Services |
| North America | United States | |
| Canada | ||
| Mexico | ||
| South America | Brazil | |
| Argentina | ||
| Rest of South America | ||
| Europe | Germany | |
| France | ||
| United Kingdom | ||
| Italy | ||
| Spain | ||
| The Netherlands | ||
| Rest of Europe | ||
| Asia Pacific | China | |
| Japan | ||
| South Korea | ||
| India | ||
| Australia | ||
| Rest of Asia Pacific | ||
| Middle East and Africa | Middle East | Saudi Arabia |
| United Arab Emirates | ||
| Turkey | ||
| Rest of the Middle East | ||
| Africa | South Africa | |
| Nigeria | ||
| Egypt | ||
| Rest of Africa | ||
| By Industry Vertical | Automotive | ||
| Aerospace and Defense | |||
| Electronics and Semiconductors | |||
| Chemicals and Materials | |||
| Food and Beverage | |||
| Textiles and Apparel | |||
| Pharmaceuticals | |||
| Others | |||
| By Technology | Renewable Energy Integration | ||
| Energy-Efficient Equipment | |||
| Advanced Waste Management and Circularity | |||
| Water and Effluent Management | |||
| Carbon Capture and Utilisation | |||
| By Solution Type | Hardware | ||
| Software and Analytics | |||
| Services | |||
| By Geography | North America | United States | |
| Canada | |||
| Mexico | |||
| South America | Brazil | ||
| Argentina | |||
| Rest of South America | |||
| Europe | Germany | ||
| France | |||
| United Kingdom | |||
| Italy | |||
| Spain | |||
| The Netherlands | |||
| Rest of Europe | |||
| Asia Pacific | China | ||
| Japan | |||
| South Korea | |||
| India | |||
| Australia | |||
| Rest of Asia Pacific | |||
| Middle East and Africa | Middle East | Saudi Arabia | |
| United Arab Emirates | |||
| Turkey | |||
| Rest of the Middle East | |||
| Africa | South Africa | ||
| Nigeria | |||
| Egypt | |||
| Rest of Africa | |||


Key Questions Answered in the Report
What is the projected size of the sustainable manufacturing market by 2030?
The sustainable manufacturing market is forecast to reach USD 376.32 billion by 2030, supported by a 9.90% CAGR driven by regulatory mandates and technology innovation.
Which region currently leads sustainable manufacturing adoption?
Europe holds 32.2% of global revenues thanks to its mature carbon-pricing schemes and circular-economy regulations.
What technology segment commands the largest share today?
Energy-efficient equipment leads with 35.2% of revenue because it delivers quick paybacks through reduced energy consumption.
Why is automotive the dominant industry vertical?
Automotive captures 18.3% share as electrification mandates push OEMs and suppliers to upgrade to low-carbon, resource-efficient production lines.
Page last updated on:


