United States Smart Manufacturing Market Size and Share
Market Overview
| Study Period | 2019 - 2030 |
|---|---|
| Forecast Data Period | 2025 - 2030 |
| Historical Data Period | 2019 - 2023 |
| Market Size (2025) | USD 80.64 Billion |
| Market Size (2030) | USD 143.63 Billion |
| Growth Rate (2025 - 2030) | 12.24% CAGR |
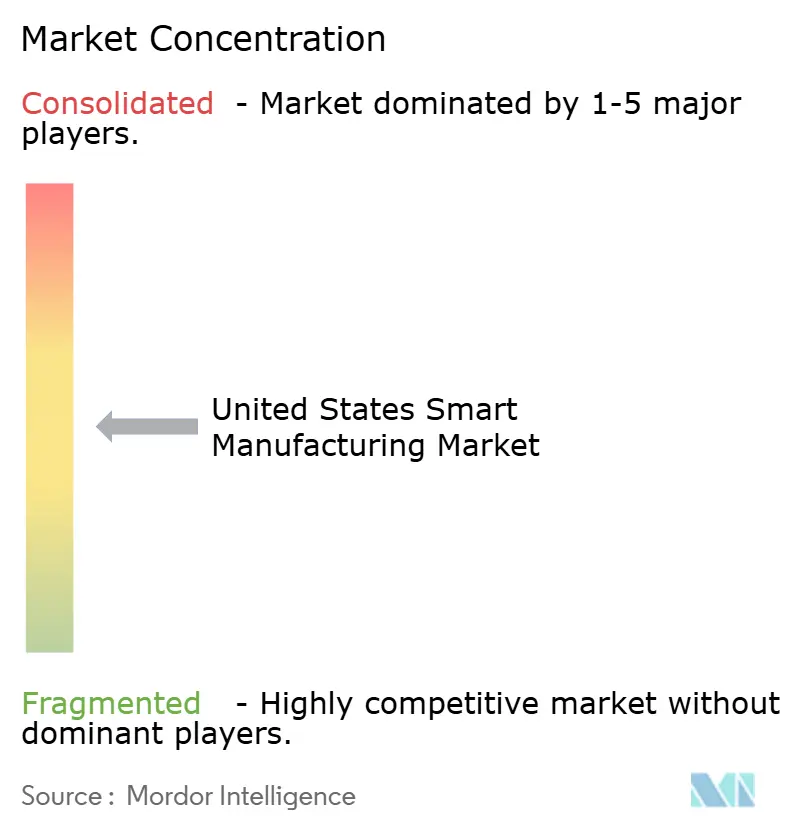
| Market Concentration | Medium |
Major Players *Disclaimer: Major Players sorted in no particular order Image © Mordor Intelligence. Reuse requires attribution under CC BY 4.0. | |

United States Smart Manufacturing Market Analysis by Mordor Intelligence
The United States smart manufacturing market size stood at USD 80.64 billion in 2025 and is projected to reach USD 143.63 billion by 2030, reflecting a 12.24% CAGR over the forecast period. Federal incentives, persistent labor shortages, and the maturation of technology are converging to accelerate adoption across factory floors, while the CHIPS and Science Act’s USD 52.7 billion semiconductor package has amplified digital-first investment behavior nationwide.[1]National Institute of Standards and Technology, “CHIPS and Science Act: Manufacturing Extension Partnership Expansion,” nist.gov The growing demand for mass-customized products, private 5G-enabled edge computing, and sustainability mandates is further expanding the use of digital twins, advanced analytics, and autonomous robotics. Competitive dynamics continue to evolve as traditional automation vendors form deep cloud partnerships, creating hybrid architectures that blend on-premise control with scalable analytics. At the same time, brownfield retrofitting remains a substantial white-space opportunity because more than 70% of North American production assets are 20 years or older.
Key Report Takeaways
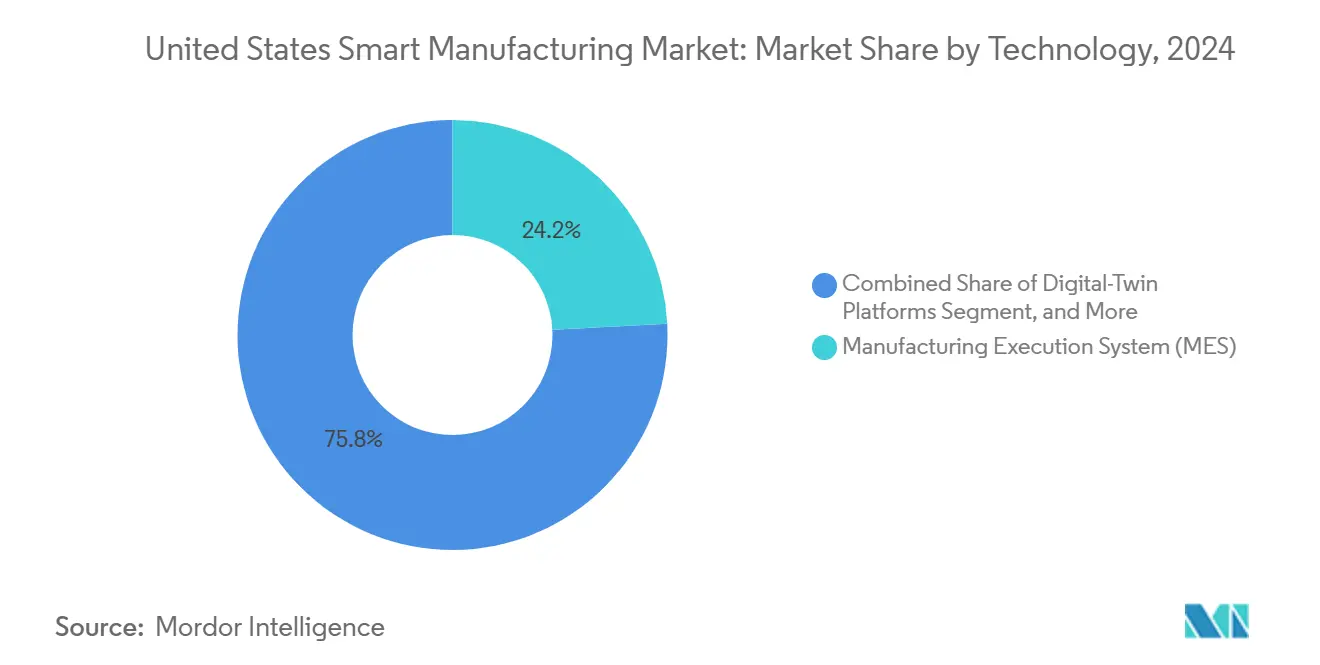
- By technology, Manufacturing Execution Systems led the United States smart manufacturing market with a 24.16% share in 2024, while digital-twin platforms are expected to grow at a 12.53% CAGR through 2030.
- By component, hardware accounted for 39.28% of the United States' smart manufacturing market size in 2024; digital twin and AI analytics software are projected to expand at a 13.34% CAGR through 2030.
- By deployment mode, on-premise solutions held 63.42% of the United States smart manufacturing market share in 2024, whereas cloud deployments are advancing at a 12.81% CAGR to 2030.
- By end-user, the automotive sector captured 28.59% of the United States' smart manufacturing market size in 2024; pharmaceuticals and life sciences are expected to exhibit the fastest CAGR at 13.92% through 2030.
United States Smart Manufacturing Market Trends and Insights
Drivers Impact Analysis*
| Driver | (~) % Impact on CAGR Forecast | Geographic Relevance | Impact Timeline |
|---|---|---|---|
| Rapid adoption of Industrial IoT and edge computing | +2.8% | Nationwide, strongest in automotive and semiconductor clusters | Medium term (2-4 years) |
| Federal incentives under CHIPS and Science Act | +2.1% | Arizona, Ohio, Texas, New York | Long term (≥ 4 years) |
| Growing demand for mass customization | +1.9% | Automotive and consumer goods hubs | Medium term (2-4 years) |
| Labor shortages accelerating automation | +2.3% | Midwest manufacturing belt | Short term (≤ 2 years) |
| Emergence of 5G-enabled factory connectivity | +1.7% | Early deployment in tech corridors | Medium term (2-4 years) |
| Corporate sustainability goals driving digital twins | +1.6% | Energy-intensive industries | Long term (≥ 4 years) |
| Source: Mordor Intelligence | |||
Rapid Adoption of Industrial IoT and Edge Computing
Manufacturers are moving beyond basic sensor monitoring toward closed-loop control that processes data locally, reducing latency from hundreds of milliseconds to under 10 milliseconds for mission-critical loops. Edge analytics solutions detect anomalies up to two weeks sooner than conventional systems, cutting unplanned downtime by 37%. The Clean Energy Smart Manufacturing Innovation Institute’s modular curricula are addressing skills gaps in edge computing, accelerating time-to-value for small and midsize plants.[2]Clean Energy Smart Manufacturing Innovation Institute, “CESMII Learning System,” cesmii.org Because 70% of North American machinery is at least two decades old, edge-enabled retrofits offer a cost-effective path to Industry 4.0 benefits. As a result, software capability rather than hardware specification is becoming the primary differentiator in factory competitiveness.
Federal Incentives Under CHIPS and Science Act
The CHIPS and Science Act requires recipients to embed digital twins, AI-driven controls, and NIST-aligned cybersecurity into semiconductor fabs, setting new performance baselines across the supply chain. Funding for the Manufacturing Extension Partnership and Manufacturing USA institutes is channeling expertise to small manufacturers, while university-industry programs are producing edge-AI technicians, exemplified by Carnegie Mellon’s robotics certifications. Early-stage clusters in Arizona, Ohio, Texas, and New York are capturing spillover investments in tooling, materials, and packaging facilities. These regional nodes act as demonstration sites, accelerating nationwide diffusion of best practices.
Growing Demand for Mass Customization
Consumer preference for personalized products is driving flexible production models that profitably manage batch sizes of one. Digital twins allow virtual validation of changeovers, curbing setup time penalties. Automotive OEMs now run multiple vehicle platforms on a single line, and pharmaceutical firms employ continuous systems for individualized therapy. Consequently, MES architectures are evolving toward real-time scheduling engines that adapt dynamically to volatile demand patterns. The shift toward pull-based production also elevates the value of end-to-end visibility in supply and demand balancing.
Labor Shortages Accelerating Automation Investments
The United States faces an estimated shortfall of 100,000 skilled manufacturing workers as planned fabs and battery plants come online. Plants are therefore adopting collaborative robots and AI-guided work instructions to stretch existing labor pools. Surveys indicate that 42% of U.S. manufacturers rank hiring as their top hurdle, and more than half lack strategies to capture the tacit knowledge of retiring employees. Digital twin-based knowledge-capture tools and AR-enhanced training modules are emerging to institutionalize expertise and improve ramp-up times for new hires.
Restraints Impact Analysis*
| Restraint | (~) % Impact on CAGR Forecast | Geographic Relevance | Impact Timeline |
|---|---|---|---|
| High initial CAPEX for brownfield integration | -1.8% | Rust Belt legacy facilities | Short term (≤ 2 years) |
| Cybersecurity vulnerabilities in connected factories | -1.4% | Critical infrastructure sectors | Medium term (2-4 years) |
| Fragmentation of industrial communication protocols | -1.1% | Multi-vendor environments | Medium term (2-4 years) |
| Limited availability of edge AI skillsets | -1.3% | Non-metropolitan regions | Long term (≥ 4 years) |
| Source: Mordor Intelligence | |||
High Initial CAPEX for Brownfield Digital Integration
Retrofitting aged plants can cost 15-20% of replacement value, deterring some projects.[3]Manufacturers Alliance Foundation, “Legacy Systems and Digital Transformation,” manufacturersalliance.org To mitigate sticker shock, vendors now package wireless sensors with pay-as-you-go software subscriptions, bringing predictive maintenance to legacy assets for under USD 500 per machine and delivering breakeven in under 12 months. Non-invasive edge gateways translate serial protocols to modern standards, letting operators phase upgrades without halting production.
Cybersecurity Vulnerabilities in Connected Factories
Real-time operational technology must coexist with enterprise IT, creating gaps that traditional controls cannot fully bridge. The latest ISA/IEC 62443 updates and NIST Cybersecurity Framework 2.0 quick-start guides help plants align security with business risk while avoiding one-size-fits-all mandates. Manufacturers are increasingly integrating security orchestration platforms that contextualize shop-floor alerts with enterprise risk dashboards; however, talent shortages are slowing full implementation.
*Our forecasts treat driver/restraint impacts as directional, not additive. The impact forecasts reflect baseline growth, mix effects, and variable interactions.
Segment Analysis
By Technology: MES Dominance Faces Digital Twin Disruption
Manufacturing Execution Systems (MES) commanded 24.16% of the United States' smart manufacturing market share in 2024, underscoring their pivotal role in orchestrating production and ensuring quality. However, digital-twin platforms are expected to expand at a 12.53% CAGR through 2030, as manufacturers seek energy optimization and predictive maintenance workflows that inform decision-making and drive design improvements. Honeywell’s 2024 launch of Batch Historian shows how contextual data capture reduces integration effort, signaling a migration from standalone automation islands to data-rich ecosystems. Traditional SCADA and PLCs remain essential, yet their value is magnified when paired with edge analytics that deliver model-based insights at the point of control.
As virtual-commissioning gains traction, PLM suites are integrating closed-loop feedback to refine next-generation products. Immersive HMI solutions now overlay augmented reality on live plant conditions, reducing troubleshooting time and enabling remote expert support. Consequently, the competitive frontier is moving from control fidelity to decision velocity, with software portability across cloud, edge, and device tiers emerging as a key selection criterion.


By Component: Hardware Foundation Enables Software Innovation
Hardware held 39.28% of the United States smart manufacturing market size in 2024 as factories required robots, sensors, machine vision, and controllers to collect and act on data. Yet digital-twin and AI analytics software will register a 13.34% CAGR through 2030, reflecting a shift toward recurring SaaS revenues. Siemens recorded EUR 1.8 billion (USD 2.0 billion) in cloud ARR for 2024, reaching 40% of total software subscriptions a year ahead of plan.[4]Siemens AG, “FY24 Q4 Analyst Presentation,” siemens.com
Service providers are bridging brownfield gaps with turnkey integration, managed cybersecurity, and continuous improvement coaching. Communication layers are also evolving; private 5G coupled with edge servers is enabling deterministic networking for motion control workloads once locked to wired buses. Advanced machine vision now fuses hyperspectral imaging with AI, spotting defects invisible to humans and driving scrap rates down.
By Deployment Mode: Cloud Acceleration Challenges On-Premise Dominance
On-premise systems retained 63.42% market share in 2024 due to air-gap security preferences and latency-sensitive control loops. Cloud workloads, however, will expand at a 12.81% CAGR, led by manufacturers seeking elastic compute for AI model training and global fleet benchmarking. Vendors are promoting hybrid architectures that keep deterministic control local while offloading analytics to the cloud. Rockwell Automation’s Azure-based insights layer shows how real-time production data can feed anomaly detection algorithms without exposing proprietary recipes.
Regulated sectors favor this split-compute model to preserve data sovereignty while tapping into continuous software updates. Edge servers equipped with Trusted Platform Modules provide cryptographic roots of trust, giving CISOs confidence to extend data pipelines beyond plant walls.

By End-User Industry: Automotive Leadership Meets Pharma Acceleration
Automotive led the United States' smart manufacturing market with a 28.59% share in 2024, driven by electric vehicle programs that demand flexible, software-defined assembly lines. Investments, such as Stellantis’ USD 406 million retooling project, exemplify how OEMs pursue multi-platform capability within a single facility. Meanwhile, the pharmaceuticals and life sciences sector is expected to grow at the fastest rate, with a 13.92% CAGR, driven by the FDA’s advanced manufacturing guidance, which rewards continuous processing and real-time release.
The semiconductor upcycle, driven by the CHIPS Act incentives, is also expanding the footprints of electronics equipment suppliers into larger smart factories. Elsewhere, the oil and gas, chemicals, aerospace, and food and beverage sectors are adopting digital twins to meet safety, regulatory, and traceability requirements. Logistics operators deploy AI-orchestrated mobile robots to offset labor gaps in warehouses, underscoring how smart manufacturing principles permeate adjacent value-chain nodes.
Geography Analysis
Smart manufacturing adoption in the United States clusters around legacy industrial corridors and emerging semiconductor hubs. The Midwest-Ohio, Michigan, Indiana, and Illinois commands the largest installed base, leveraging automotive depth yet grappling with older assets that complicate upgrades. CHIPS Act spending is redrawing the national map as Arizona, Texas, Ohio, and New York attract greenfield fabs and supplier ecosystems, catalyzing further investment in edge infrastructure and workforce skilling programs.
In the Southeast, new vehicle and aerospace plants benefit from right-to-work regulations and newer buildings requiring fewer retrofits, accelerating digital-first adoption. California’s innovation corridor continues pushing AI-centric manufacturing software, although high operating costs prompt some fabrication shifts to lower-cost interiors. The Pacific Northwest leverages aerospace know-how in composite machining and precision tooling, while Mountain states adopt 5G-enabled mining and metals automation.
Federal programs such as the Manufacturing Extension Partnership provide technology coaching to small and midsize firms in every state, democratizing access to Industry 4.0 practices. Regional specialization fosters knowledge spillovers-Great Lakes electrification, Southwest semiconductors, Southeast defense airframes-creating a virtuous cycle where supplier networks adopt the same smart platforms to maintain qualification status. Collectively, these geographic patterns underpin a resilient, distributed smart-manufacturing landscape capable of absorbing shocks while sustaining innovation momentum.
Competitive Landscape
Competition is moderate, with the top five suppliers accounting for roughly 45% of the revenue, leaving ample room for specialized entrants. Rockwell Automation, Honeywell, and Siemens are embedding their control portfolios inside hyperscaler clouds-Rockwell with Microsoft Azure and Honeywell with Google Cloud Vertex, pivoting from product to platform positioning. Such alliances enable continuous AI model updates and cross-site benchmarking, differentiators that pure-play hardware vendors struggle to match.
Edge-native firms target protocol translation and rapid deployment, winning share in brownfield retrofits where cost sensitivity is acute. Standards compliance around NIST CSF 2.0 and ISA/IEC 62443 cybersecurity is becoming a gating requirement, advantaging vendors with holistic security stacks. Meanwhile, machine-vision specialists integrate hyperspectral imaging and deep learning, partnering with cobot makers to offer turnkey inspection cells.
Pricing models are shifting toward outcome-based contracts, where vendors guarantee OEE or energy savings, aligning incentives with manufacturers’ ROI imperatives. Consolidation is likely among mid-tier sensor and gateway suppliers lacking the scale to fund cloud R&D, while software-first newcomers expand via vertical SaaS tailored to regulated industries. Taken together, the strategic emphasis is tilting from installed base defense to data ecosystem control.
United States Smart Manufacturing Industry Leaders
Rockwell Automation, Inc.
Emerson Electric Co.
Honeywell International Inc.
Siemens Industry, Inc.
General Electric Company
- *Disclaimer: Major Players sorted in no particular order

Recent Industry Developments
- March 2025: The National Institute of Standards and Technology published NIST SP 1308 draft guide aligning the Cybersecurity Framework 2.0 with workforce management for smart-factory deployments.
- January 2025: The International Society of Automation released the ANSI/ISA-62443-2-1-2024 update, introducing a maturity model for industrial cybersecurity governance.
- December 2024: Rockwell Automation won Sumitomo Rubber Industries’ global MES standardization deal, starting with the Shirakawa plant and extending through 2026.
- November 2024: Siemens reported EUR 1.8 billion (USD 2.0 billion) in cloud ARR, achieving a 1.5x year-over-year rise and 40% subscription mix.


United States Smart Manufacturing Market Report Scope
| Programmable Logic Controller (PLC) |
| Supervisory Control and Data Acquisition (SCADA) |
| Enterprise Resource Planning (ERP) |
| Distributed Control System (DCS) |
| Human-Machine Interface (HMI) |
| Product Lifecycle Management (PLM) |
| Manufacturing Execution System (MES) |
| Digital-Twin Platforms |
| Edge-Analytics Software |
| Other Technologies |
| Hardware | Robotics |
| Sensors | |
| Machine-Vision Systems | |
| Control Devices | |
| Software | MES |
| PLM | |
| SCADA / ERP Suites | |
| Digital-Twin / AI and Analytics | |
| Services | Integration and Implementation |
| Consulting and Training | |
| Managed Services | |
| Communication Segment |
| On-Premise |
| Cloud |
| Hybrid |
| Automotive |
| Semiconductors and Electronics |
| Oil and Gas |
| Chemical and Petrochemical |
| Pharmaceuticals and Life Sciences |
| Aerospace and Defense |
| Food and Beverage |
| Metals and Mining |
| Energy and Utilities |
| Logistics and Warehousing |
| OtherEnd-user Industries |
| By Technology | Programmable Logic Controller (PLC) | |
| Supervisory Control and Data Acquisition (SCADA) | ||
| Enterprise Resource Planning (ERP) | ||
| Distributed Control System (DCS) | ||
| Human-Machine Interface (HMI) | ||
| Product Lifecycle Management (PLM) | ||
| Manufacturing Execution System (MES) | ||
| Digital-Twin Platforms | ||
| Edge-Analytics Software | ||
| Other Technologies | ||
| By Component | Hardware | Robotics |
| Sensors | ||
| Machine-Vision Systems | ||
| Control Devices | ||
| Software | MES | |
| PLM | ||
| SCADA / ERP Suites | ||
| Digital-Twin / AI and Analytics | ||
| Services | Integration and Implementation | |
| Consulting and Training | ||
| Managed Services | ||
| Communication Segment | ||
| By Deployment Mode | On-Premise | |
| Cloud | ||
| Hybrid | ||
| By End-user Industry | Automotive | |
| Semiconductors and Electronics | ||
| Oil and Gas | ||
| Chemical and Petrochemical | ||
| Pharmaceuticals and Life Sciences | ||
| Aerospace and Defense | ||
| Food and Beverage | ||
| Metals and Mining | ||
| Energy and Utilities | ||
| Logistics and Warehousing | ||
| OtherEnd-user Industries | ||


Key Questions Answered in the Report
What is the current value of the United States smart manufacturing market?
The market was valued at USD 80.64 billion in 2025.
How fast will the market grow through 2030?
It is forecast to expand at a 12.24% CAGR, reaching USD 143.63 billion.
Which technology segment is growing quickest?
Digital-twin platforms will post a 12.53% CAGR through 2030.
Why are pharmaceuticals adopting smart manufacturing rapidly?
FDA modernization policies and continuous processing needs drive a 13.92% CAGR for pharma and life sciences deployments.
What challenges slow adoption in legacy plants?
High retrofit CAPEX, cybersecurity gaps, and limited edge-AI skillsets are key barriers.
Who are the leading vendors?
Rockwell Automation, Honeywell, and Siemens collectively held about 28% of revenue in 2024.
Page last updated on:


