Aviation IoT Market Size and Share
Market Overview
| Study Period | 2019 - 2030 |
|---|---|
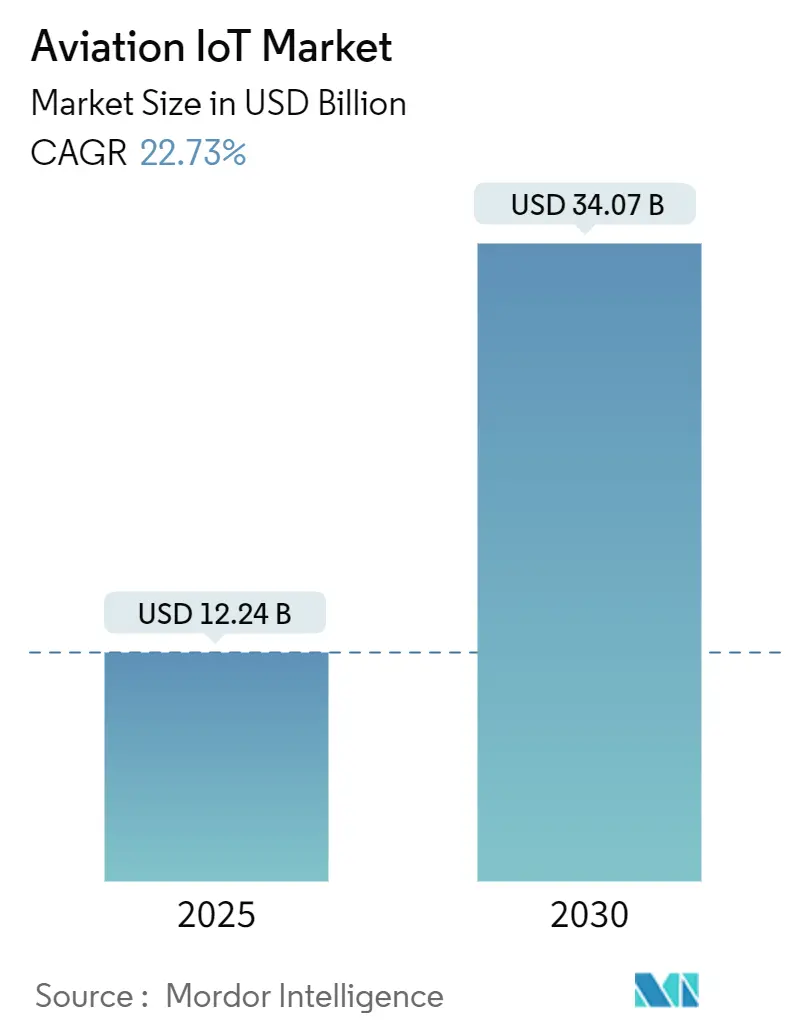
| Market Size (2025) | USD 12.24 Billion |
| Market Size (2030) | USD 34.07 Billion |
| Growth Rate (2025 - 2030) | 22.73% CAGR |
| Fastest Growing Market | Asia Pacific |
| Largest Market | North America |
| Market Concentration | Medium |
Major Players *Disclaimer: Major Players sorted in no particular order Image © Mordor Intelligence. Reuse requires attribution under CC BY 4.0. | |
Aviation IoT Market Analysis by Mordor Intelligence
The aviation IoT market size stands at USD 12.24 billion in 2025 and is projected to reach USD 34.07 billion by 2030, reflecting a 22.73% CAGR across the period. Commercial recovery after the pandemic accelerated demand for connected operations, with airlines and airports converging edge-AI sensors, private 5G, and satellite links to cut manual processes and improve asset visibility. Predictive analytics is turning scheduled maintenance into condition-based programs, while air-traffic-management (ATM) modernization efforts like SESAR and NextGen create mandatory data-exchange requirements that favor end-to-end IoT platforms. In parallel, airport labor shortages push ground handlers toward automation, and sustainability mandates require real-time emissions tracking that only connected devices can provide. Cyber-physical exposure remains the primary adoption brake, yet rising investments in aviation-grade zero-trust architectures are converting that risk into a fresh revenue pool for security-as-a-service providers. Together, these forces underpin sustained double-digit expansion and reinforce the sector’s shift from niche pilots to fleet-wide rollouts.
Key Report Takeaways
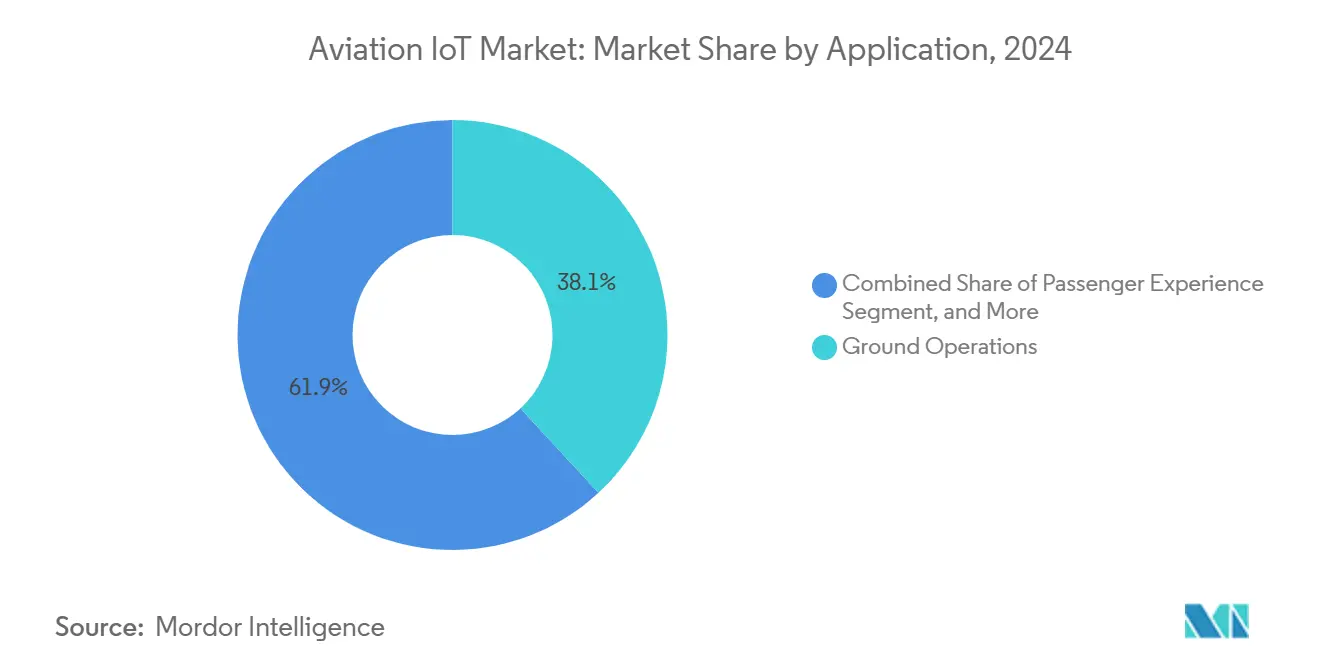
- By application, Ground Operations held 38.12% of aviation IoT market share in 2024, while Passenger Experience is forecast to expand at 23.13% CAGR through 2030.
- By connectivity technology, Cellular 4G/5G commanded 46.89% share of aviation IoT market size in 2024; Satellite/NTN is projected to advance at 23.36% CAGR to 2030.
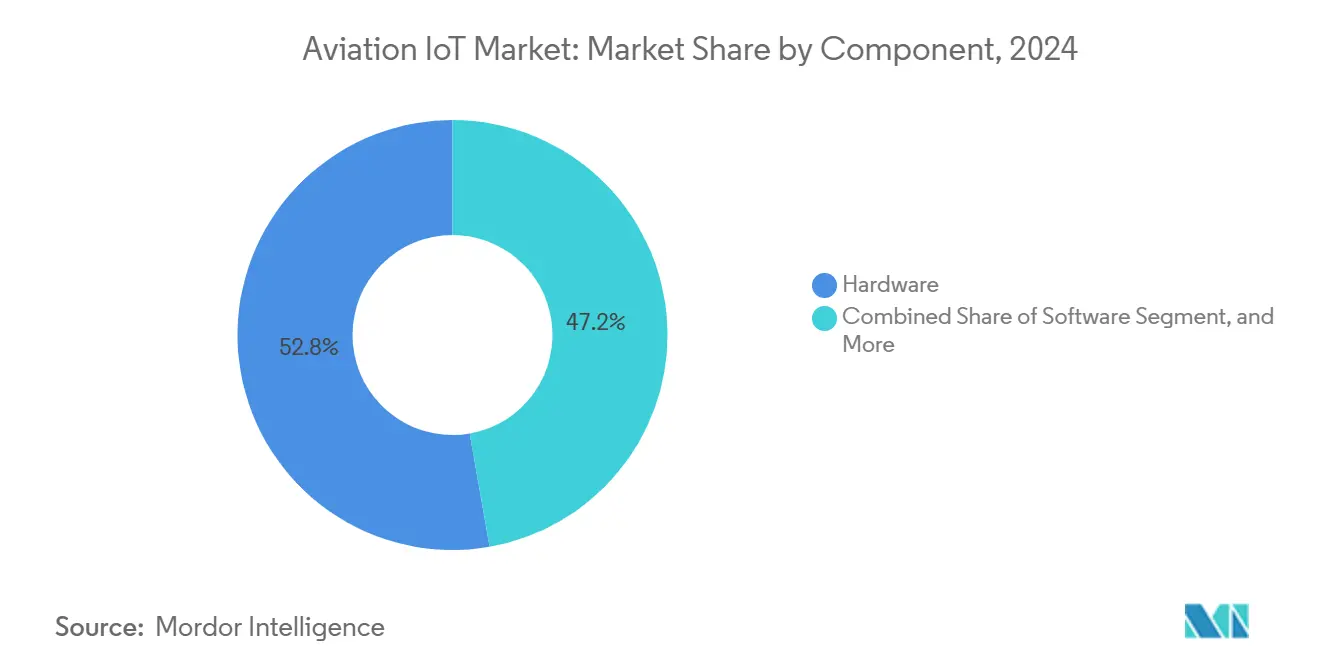
- By component, Hardware captured 52.76% of aviation IoT market size in 2024, whereas Services is set to grow fastest at 24.71% CAGR over the forecast horizon.
- By end-user, Airline Operators led with 34.53% share of aviation IoT market size in 2024, while Airports are on track for the highest CAGR at 22.97% to 2030.
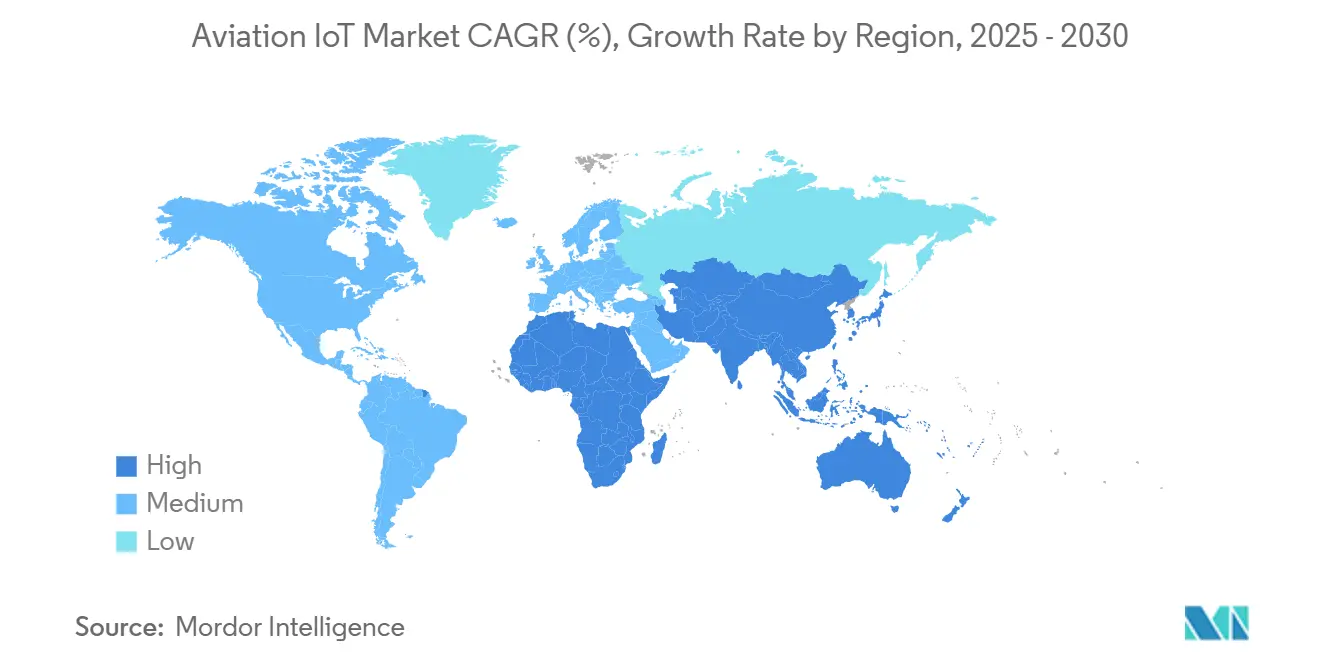
- By geography, North America accounted for 33.89% share in 2024; Asia-Pacific is expected to post the quickest 22.78% CAGR through 2030.
Global Aviation IoT Market Trends and Insights
Drivers Impact Analysis*
| Driver | (~) % Impact on CAGR Forecast | Geographic Relevance | Impact Timeline |
|---|---|---|---|
| Post-COVID flight-ops digitalization surge | +4.2% | Global (early North America, Europe) | Short term (≤ 2 years) |
| ATC modernization mandates (SESAR, NextGen) | +3.8% | Europe, North America, spill-over to Asia-Pacific | Medium term (2-4 years) |
| Ground-handling automation | +3.1% | Global hub airports | Medium term (2-4 years) |
| Edge-AI sensors for predictive maintenance | +2.9% | Developed markets worldwide | Long term (≥ 4 years) |
| Satellite-to-aircraft NTN connectivity roll-outs | +2.2% | Remote and oceanic routes | Long term (≥ 4 years) |
| SAF traceability requirements | +1.8% | Europe and North America | Medium term (2-4 years) |
| Source: Mordor Intelligence | |||
Post-COVID Flight-Ops Digitalization Surge
Airports adopted touchless passenger-flow systems such as Miami International Airport’s Smart Airport 2.0 suite, which blends IoT sensors with AI to cut queues and improve health safeguards. [1]PhocusWire Editorial Team, “State Airport Passenger Processing Seamless Journeys,” phocuswire.comAirlines quickly expanded these pilots across operations when they realized that sensor-driven dashboards also shaved fuel burn and gate dwell times. Digital-first playbooks are now embedded in standard operating procedures, so procurement pipelines increasingly bundle sensors, cloud analytics, and 5G backhaul into a single budget line. Cargo and low-cost carriers, historically late adopters, are also fast-tracking deployments after seeing peers recoup investments within a single summer season. The result is a structural, not cyclical, demand boost that will keep annual spending ahead of pre-pandemic baselines.
ATC Modernization Mandates (SESAR, NextGen)
Europe’s SESAR 3 and the U.S. NextGen programs oblige aircraft and ground nodes to share trajectory data in real time, which effectively renders aviation IoT connectivity a regulatory requirement. [2]SESAR Joint Undertaking, “Europe Unveils New Plan to Modernise Critical Infrastructure for Aviation,” sesarju.eu Airlines are retrofitting data gateways that translate legacy avionics buses into modern IP protocols so they can file 4-dimensional flight paths. Beyond compliance, carriers gain route-optimization benefits that save fuel and curb emissions, reinforcing the business case. Suppliers aligned with performance-based navigation standards see faster certification, creating a moat against generic hardware vendors. As ICAO pushes global harmonization, emerging markets will leapfrog straight to connected operations, further enlarging the opportunity.
Ground-Handling Automation
Labor shortages raised average turnaround times by 11 minutes in 2024, pressuring airports to deploy RFID-enabled baggage belts and autonomous tugs to hit on-time-departure targets. SITA and IDEMIA’s ALIX platform pairs computer vision with AI to read bag tags without human scanning, cutting mishandling claims and insurance costs. Real-time location services extend to catering trucks and fuel bowsers, giving dispatchers a unified dashboard that slashes idle miles. Because most gear remains off-network when outside terminal Wi-Fi, private 5G has become the connectivity of choice for ramp areas. The automation push, initially framed as cost saving, is now pivotal for meeting sustainability pledges because efficient resource sequencing lowers APU usage and CO₂ output.
Edge-AI Sensors for Predictive Maintenance
Boeing’s Airplane Health Management 2.0 streams selected parameters directly to edge devices that run anomaly detection in flight, flagging actionable alerts before landing. Airbus cites potential fleet-wide savings of USD 4 billion annually by shifting heavy checks to on-condition tasks. Airlines value that edge analytics compress data volumes by 95%, a critical feature for polar or oceanic legs with sparse connectivity. Lessors are updating lease clauses to require continuous health-monitoring feeds, driving adoption even among financially constrained operators. Over the long term, OEM-supplied digital twins will open recurring revenue streams that offset cyclical airframe sales.
Restraints Impact Analysis*
| Restraint | (~) % Impact on CAGR Forecast | Geographic Relevance | Impact Timeline |
|---|---|---|---|
| Cyber-physical threat surface expansion | −2.8% | Global, higher focus in developed markets | Short term (≤ 2 years) |
| Legacy avionics bus incompatibility | −2.1% | Older fleets worldwide | Medium term (2-4 years) |
| Spectrum allocation bottlenecks for UWB tags | −1.4% | National variations | Long term (≥ 4 years) |
| Carbon-emission-linked cap-ex squeeze | −1.2% | Europe and North America | Medium term (2-4 years) |
| Source: Mordor Intelligence | |||
Cyber-Physical Threat Surface Expansion
The FAA recorded a 74% jump in cyber incidents since 2020, prompting proposed rules that treat every connected subsystem as safety-critical. [3]IBM Security, “Airplane Cybersecurity: Past, Present, and Future,” ibm.comAirports now operate dedicated Security Operations Centers that ingest sensor logs alongside traditional IT feeds, yet many regional gateways lack the budget or staff to replicate this posture. Airlines must certify third-party code updates often weekly before deployment, elongating innovation cycles. Insurers, facing higher loss ratios, have raised aviation cyber-premiums by double digits, effectively taxing IoT adoption. Vendors that embed hardware-root-of-trust chips and publish SBOMs are gaining share, but retrofitting older devices remains difficult and costly.
Legacy Avionics Bus Incompatibility
Aircraft delivered in the early 2000s still rely on ARINC 429 and MIL-STD-1553 buses with limited bandwidth, making integration with gigabit-speed sensor networks challenging. Airlines confront a fork-in-the-road decision: retrofit protocol converters or invest in next-generation airframes with native IP backbones. For narrow-body fleets approaching mid-life, the retrofit bill can reach USD 2 million per jet, eroding ROI for all but the largest carriers. Smaller operators often delay projects, slowing penetration rates in developing regions. OEMs have started shipping modular gateway units that slide into vacant avionics bays, but certification queues stretch up to 18 months, prolonging the restraint’s impact.
*Our forecasts treat driver/restraint impacts as directional, not additive. The impact forecasts reflect baseline growth, mix effects, and variable interactions.
Segment Analysis
By Application: Operational Efficiency Drives Ground Adoption
Ground Operations generated the largest revenue share at 38.12% in 2024, underscoring how quickly airports monetize sensor-based resource orchestration. The segment alone contributed USD 4.7 billion to aviation IoT market size last year, supported by quick payback on baggage belt automation and stand allocation software. Airlines value concrete KPIs mishandled-bag reductions, gate-turn cuts that ground-focused solutions deliver within a single season. Passenger Experience solutions, although smaller today, are posting a 23.13% CAGR that positions them as the next break-out area; biometric boarding rolled out under ICAO’s Journey Pass is already live at five Gulf hubs.
Beyond headline numbers, operators increasingly demand cross-domain orchestration that spans ramp, cabin, and terminal touchpoints. Vendors are responding with unified data lakes that ingest RFID, vision, and telematics feeds, then distribute prescriptive insights via mobile apps. While Ground Operations dominates current spending, bundled passenger-centric use cases biometrics tied to seamless baggage flow will reshape wallet allocation by mid-decade. The aviation IoT market continues to pivot from single-point solutions to holistic suites that blend operational efficiency with ancillary-revenue generation.


By Connectivity Technology: Hybrid Architectures Take Hold
Cellular 4G/5G held 46.89% share in 2024, equivalent to USD 5.7 billion of aviation IoT market size, thanks to existing macro-network coverage at nearly every commercial airport. Private 5G slices now power mission-critical video feeds and pushback-tractor telematics, offering deterministic latency that Wi-Fi cannot match. Yet satellite-based non-terrestrial-network (NTN) links are scaling fastest, at 23.36% CAGR, because they bridge connectivity gaps over polar, oceanic, and mountainous sectors, allowing continuous engine-health streaming.
Hybrid avionics modems that aggregate cellular, Wi-Fi 6, and Ka-band satellite channels are becoming standard on twin-aisle deliveries. Airports replicate that convergence with multi-link routers to keep assets online from hangar to runway. As spectrum regulators allocate 5G RedCap and 6 GHz bands, suppliers expect a new wave of device upgrades. The confluence of terrestrial and space-based links is therefore cementing connectivity as a strategic differentiator and prompting carriers to negotiate end-to-end SLAs rather than per-megabyte tariffs.
By Component: Services Accelerate Amid Hardware Dominance
Hardware accounted for 52.76% of aviation IoT market size in 2024, reflecting the up-front capital needed for rugged sensors, edge gateways, and certified antennas. Each wide-body aircraft can host more than 8,000 sensors, and unit prices stay high due to stringent DO-160 and DO-254 standards. However, Services revenues are climbing at a 24.71% CAGR as airlines prefer outcome-based contracts that convert heavy cap-ex into predictable op-ex. Honeywell’s cloud-connected Anthem cockpit and Boeing’s Insight Accelerator illustrate the model: airlines pay per-tail per-month for analytics rather than buy software licenses.
Software platforms, although a smaller pool, are the glue binding the ecosystem together—aggregating disparate data streams into AI pipelines that surface actionable insights in MRO and ops-control centers. Growth momentum therefore lies in integrated offerings that bundle sensors, secure connectivity, and 24/7 monitoring under flight-hour contracts. As aircraft backlogs swell, OEMs will layer subscription packages atop each delivery, tilting the long-term revenue mix toward services.
By End-User: Operators Lead, Airports Sprint
Airline Operators controlled 34.53% of aviation IoT market share last year, a function of their fleet-wide authority to deploy sensors overnight during routine checks. Typical ROI arises from fuel savings through continuous engine-trim optimization and deferred heavy maintenance as predictive analytics takes hold. Airports, growing at 22.97% CAGR, now embed IoT in green-field terminal designs, wiring everything from HVAC vents to jet-bridges into a unified command center. Riyadh Air’s pre-launch commitment to IBM’s watsonx digital backbone showcases how carriers with clean-sheet fleets can leapfrog legacy peers.
MRO firms trail in adoption but stand to benefit disproportionately once predictive maintenance data becomes table stakes for lease contracts. Aircraft OEMs, meanwhile, bake sensor arrays and digital-twin hooks into line-fit options locking in future service revenue and raising the switching cost for aftermarket competitors. Across all cohorts, stakeholder alignment is shifting toward collaborative data-sharing agreements that transcend historical silos.
Geography Analysis
North America kept the lead with 33.89% revenue share in 2024, buoyed by FAA NextGen milestones and a dense cluster of aerospace primes. U.S. carriers deploy route-optimization algorithms that ingest real-time weather and ATM feeds, generating fuel burn savings that justify six-figure annual subscription fees. Canadian airports invest in private 5G for de-icing-pad coordination, while Mexican cargo hubs install satellite trackers on ULD pallets to secure cross-border supply chains.
Asia-Pacific logs the fastest 22.78% CAGR, propelled by China’s 30-airport expansion blueprint and India’s Digi-Yatra digital-passenger corridors. GSMA counts 1.8 billion mobile subscribers in the region, providing a vast addressable base for connected-travel services. Japan trials NTN links for oceanic surveillance, while Australia leverages L-band satellite gateways to backhaul fire-spotting drone data that shares infrastructure with commercial aviation assets.
Europe advances steadily on the back of SESAR 3 and strict emission caps that mandate real-time fuel-flow reporting. German and French carriers retrofit SAF-traceability modules tied to blockchain ledgers, granting regulatory credits that offset installation costs. Middle East airports, flush with tourism-driven capital expenditure, pursue biometric tokenization programs to sustain hub dominance; Dubai’s DXB already processes 50,000 passengers daily through contactless corridors. Africa and South America remain nascent but display niche hotspots Kenya for wildlife-monitoring airframes, Brazil for Amazon drone logistics that incubate exportable solutions.

Competitive Landscape
The arena is moderately fragmented: the top five players control near-half of installed units, yet over 200 specialist vendors address connectivity, analytics, and cybersecurity niches. Honeywell’s upcoming spin-off into a pure-play aerospace firm signals intent to double down on autonomy and electrification. Airbus and Delta joined forces on an innovation lab network to trial winglet morphing and SAF production pathways, embedding IoT sensors from day one. SITA extends network-infrastructure contracts at Heathrow to lock in data-exchange dominance on the ground.
Technology disruptors exploit white spaces such as satellite-edge orchestration and ultra-wideband asset trackers. Partnerships rather than outright acquisitions dominate strategy; Honeywell’s tie-up with NXP brings AI accelerators into certified avionics computers, shaving inference latency to milliseconds. Vendors that can package hardware, connectivity, and lifetime analytics into usage-based pricing will outpace pure equipment sellers. Market concentration is therefore stable but poised for gradual tightening as outcome-based contracts drive consolidation around data-rich incumbents.
Aviation IoT Industry Leaders
Cisco Systems Inc.
Honeywell International Inc.
International Business Machines Corporation
Microsoft Corporation
SITA SC
- *Disclaimer: Major Players sorted in no particular order

Recent Industry Developments
- January 2025: Honeywell and NXP expanded their partnership to accelerate next-generation aviation technology, focusing on autonomous flight and AI-driven avionics.
- January 2025: Riyadh Air selected IBM’s watsonx to build an AI-driven enterprise backbone ahead of its inaugural flights.
- January 2025: SITA and IDEMIA unveiled the ALIX computer-vision platform to transform baggage identification processes at major airports.
- January 2025: Delta and Airbus opened joint innovation labs to explore wing performance and SAF scaling pathways.


Global Aviation IoT Market Report Scope
| Ground Operations |
| Passenger Experience |
| Aircraft Operations |
| Asset Management |
| Cellular (4G/5G) |
| Wi-Fi / Wi-Fi 6 |
| LP-WAN (LoRa, NB-IoT) |
| Satellite / NTN |
| Hardware |
| Software |
| Service |
| Airport |
| Airline Operators |
| MRO |
| Aircraft OEM |
| North America | United States | |
| Canada | ||
| Mexico | ||
| South America | Brazil | |
| Argentina | ||
| Rest of South America | ||
| Europe | Germany | |
| United Kingdom | ||
| France | ||
| Russia | ||
| Rest of Europe | ||
| Asia-Pacific | China | |
| Japan | ||
| India | ||
| South Korea | ||
| Australia | ||
| Rest of Asia-Pacific | ||
| Middle East and Africa | Middle East | Saudi Arabia |
| United Arab Emirates | ||
| Rest of Middle East | ||
| Africa | South Africa | |
| Egypt | ||
| Rest of Africa | ||
| By Application | Ground Operations | ||
| Passenger Experience | |||
| Aircraft Operations | |||
| Asset Management | |||
| By Connectivity Technology | Cellular (4G/5G) | ||
| Wi-Fi / Wi-Fi 6 | |||
| LP-WAN (LoRa, NB-IoT) | |||
| Satellite / NTN | |||
| By Component | Hardware | ||
| Software | |||
| Service | |||
| By End-User | Airport | ||
| Airline Operators | |||
| MRO | |||
| Aircraft OEM | |||
| By Geography | North America | United States | |
| Canada | |||
| Mexico | |||
| South America | Brazil | ||
| Argentina | |||
| Rest of South America | |||
| Europe | Germany | ||
| United Kingdom | |||
| France | |||
| Russia | |||
| Rest of Europe | |||
| Asia-Pacific | China | ||
| Japan | |||
| India | |||
| South Korea | |||
| Australia | |||
| Rest of Asia-Pacific | |||
| Middle East and Africa | Middle East | Saudi Arabia | |
| United Arab Emirates | |||
| Rest of Middle East | |||
| Africa | South Africa | ||
| Egypt | |||
| Rest of Africa | |||


Key Questions Answered in the Report
What is the current value of the aviation IoT market?
The aviation IoT market stands at USD 12.24 billion in 2025 and is projected to reach USD 34.07 billion by 2030 at a 22.73% CAGR.
Which application area generates the most revenue?
Ground Operations leads with 38.12% share, driven by rapid ROI on baggage automation and gate-turn optimization.
Which connectivity technology is growing fastest?
Satellite/NTN links post the highest 23.36% CAGR because they assure coverage over remote and oceanic routes.
Why are services revenues accelerating?
Airlines favor outcome-based contracts that bundle hardware, analytics, and 24/7 monitoring into predictable monthly payments, driving a 24.71% CAGR for services.
Which region shows the strongest growth momentum?
Asia-Pacific records the quickest 22.78% CAGR thanks to large-scale airport construction and favorable 5G-Advanced rollouts.
What is the main risk hindering adoption?
Cyber-physical vulnerabilities add compliance complexity and insurance costs, tempering near-term deployment speed.
Page last updated on:


