IoT Powered Logistics Market Size and Share
Market Overview
| Study Period | 2019 - 2030 |
|---|---|
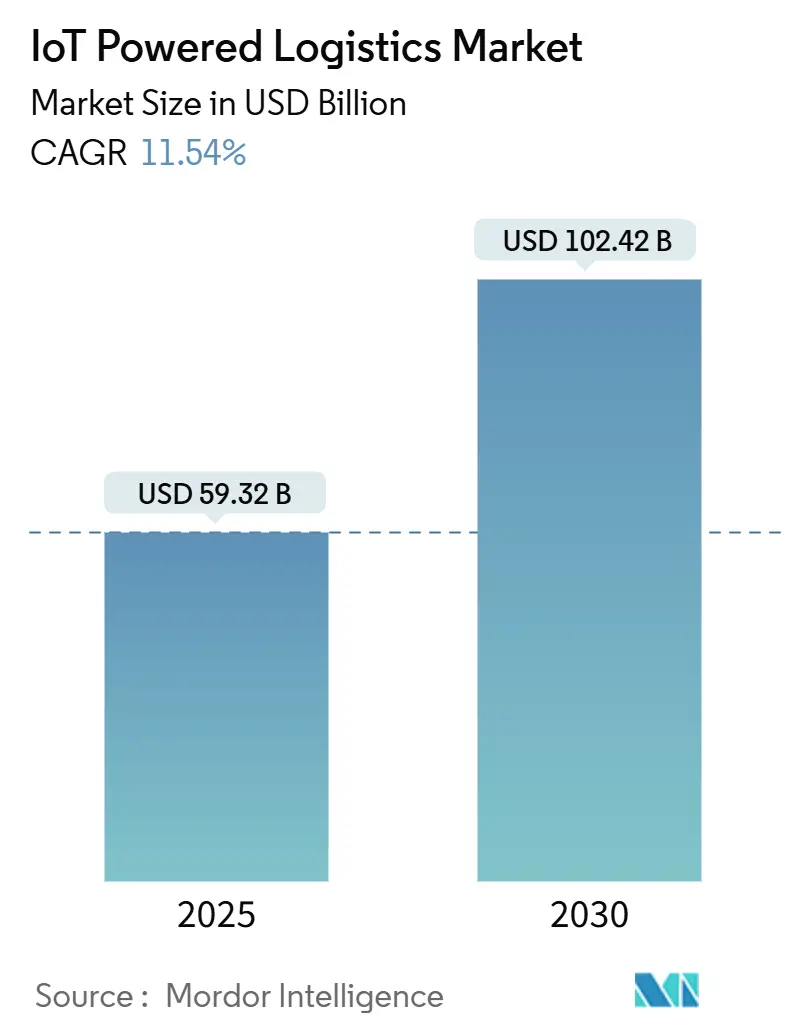
| Market Size (2025) | USD 59.32 Billion |
| Market Size (2030) | USD 102.42 Billion |
| Growth Rate (2025 - 2030) | 11.54% CAGR |
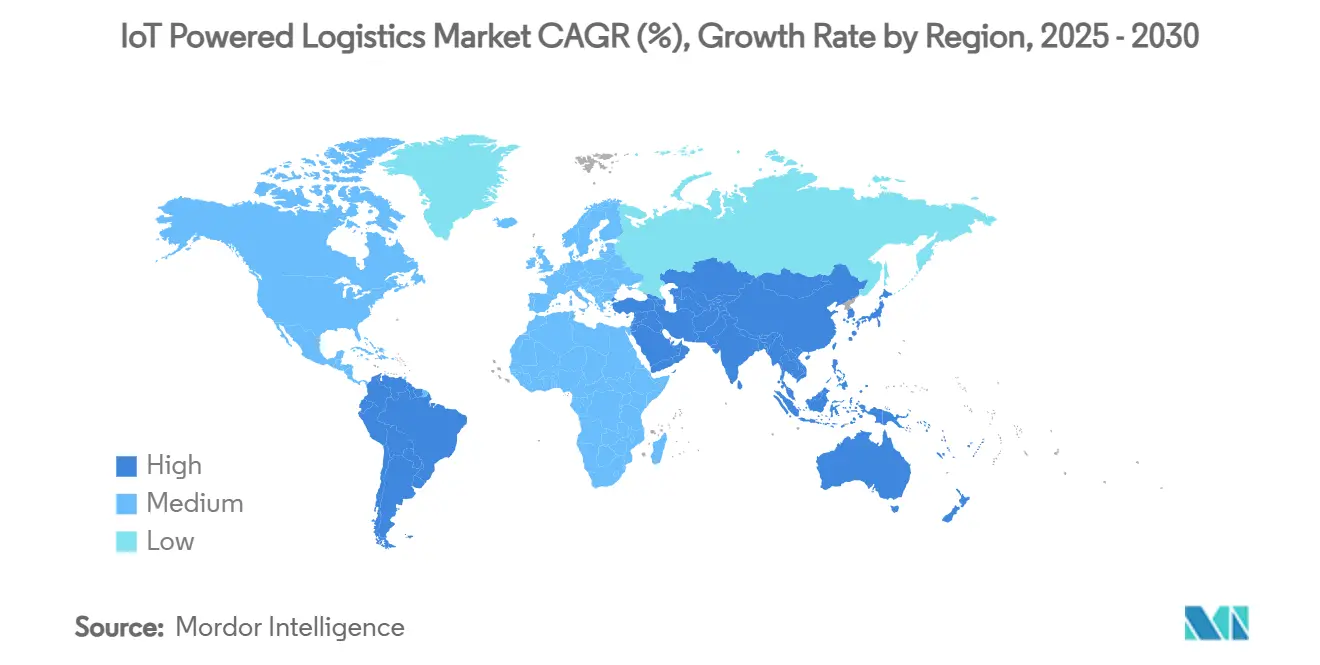
| Fastest Growing Market | Asia Pacific |
| Largest Market | North America |
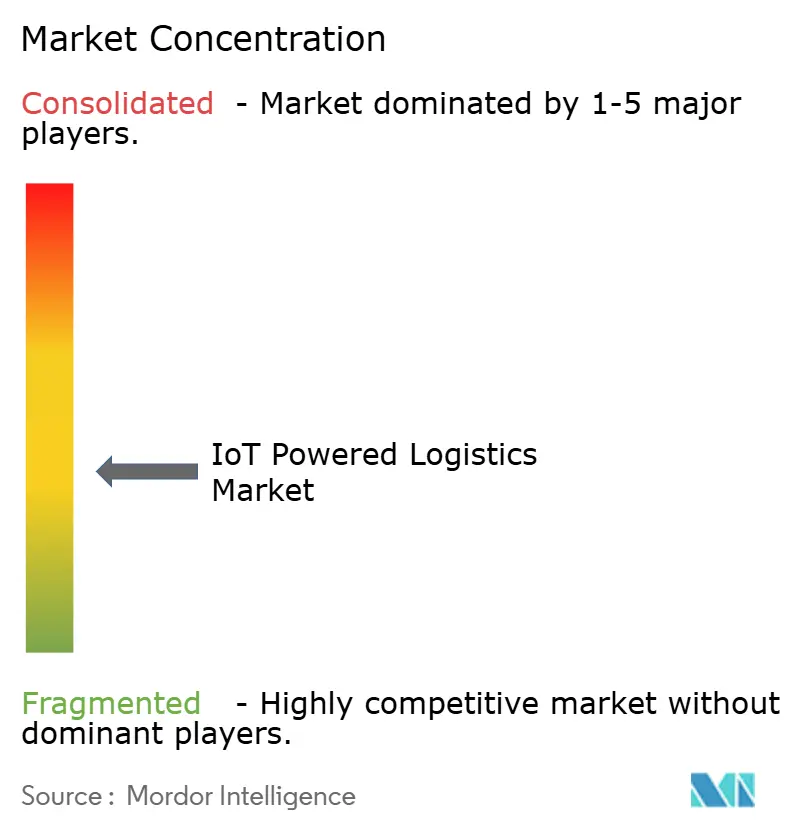
| Market Concentration | Medium |
Major Players *Disclaimer: Major Players sorted in no particular order Image © Mordor Intelligence. Reuse requires attribution under CC BY 4.0. | |
IoT Powered Logistics Market Analysis by Mordor Intelligence
The IoT Powered Logistics Market size is estimated at USD 59.32 billion in 2025, and is expected to reach USD 102.42 billion by 2030, at a CAGR of 11.54% during the forecast period (2025-2030).
Accelerated uptake stems from real-time visibility requirements, falling sensor prices, and the rollout of 5G, which together shift deployments from basic tracking toward predictive, autonomous platforms. E-commerce traffic, tighter Scope 3 reporting mandates, and government support for connected rail, road, and maritime networks strengthen demand even as cybersecurity and spectrum costs temper near-term adoption. Hardware remains the revenue anchor, yet services outpace with outcome-based models that lower upfront risk for shippers. North America’s mature 3PL infrastructure leads regional momentum, while Asia-Pacific outperforms on smart-port investments and cellular IoT expansion. Competitive rivalry stays moderate because spectrum licensing, integration complexity, and domain expertise set high entry barriers; however, strategic mergers continue to reshape the IoT powered logistics market landscape.
Key Report Takeaways
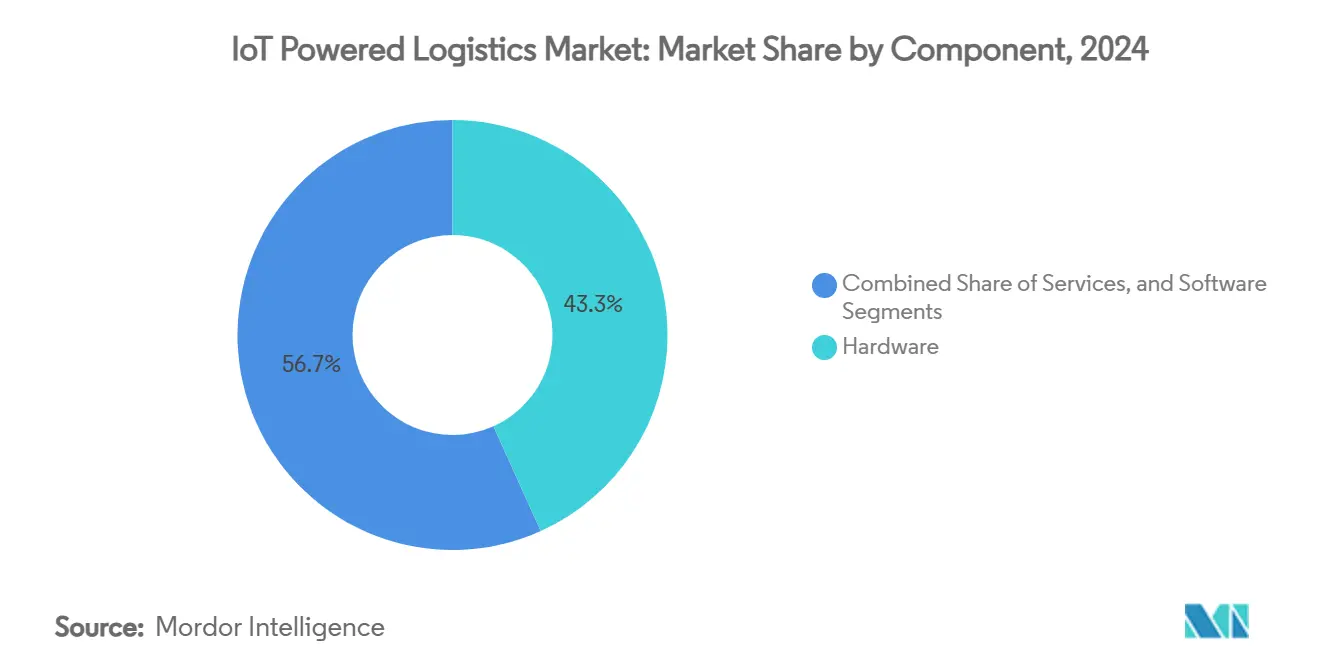
- By component, hardware captured a 43.27% share of the IoT powered logistics market in 2024.
- By application, the IoT powered logistics market for asset tracking and monitoring is projected to grow at a 14.63% CAGR between 2025 to 2030.
- By connectivity, cellular technologies captured a 54.32% share of the IoT powered logistics market in 2024.
- By transport mode, the IoT powered logistics market for rail freight is projected to grow at a 12.64% CAGR between 2025 to 2030.
- By end-user, retail and e-commerce captured a 32.46% share of the IoT powered logistics market in 2024.
- By geography, North America captured a 41.73% share of the IoT powered logistics market in 2024.
Global IoT Powered Logistics Market Trends and Insights
Drivers Impact Analysis*
| Driver | (~) Impact on CAGR Forecast | Geographic Relevance | Impact Timeline |
|---|---|---|---|
| Real-time visibility and asset-tracking demand surge | +2.5% | North America, EU, global lanes | Medium term (2-4 years) |
| Explosive e-commerce pushing last-mile efficiency | +1.8% | APAC, North America | Short term (≤ 2 years) |
| Declining sensor and connectivity costs | +1.2% | APAC hubs, global | Long term (≥ 4 years) |
| Smart-container data-sharing standards emerge | +0.9% | Global maritime, EU leadership | Medium term (2-4 years) |
| AI-driven predictive ETA clauses in contracts | +1.1% | North America, EU | Medium term (2-4 years) |
| Scope 3 digital-twin mandates by shippers | +0.7% | EU, North America | Long term (≥ 4 years) |
| Source: Mordor Intelligence | |||
Real-time Visibility and Asset-Tracking Demand Surge
Enterprises now insist on granular, multimodal oversight after recent disruption exposed blind spots. Samsara’s FY 2025 revenue of USD 1.46 billion illustrates how multi-application adoption underpins growth.[1]Samsara Inc., “Q4 FY25 Investor Presentation,” samsara.com Enhanced sensor suites covering temperature, humidity, shock, and precise location guard semiconductor and pharma cargo, where single failures incur multimillion-dollar losses. Powerfleet’s USD 200 million MiX Telematics purchase expanded predictive maintenance capabilities to cover fleets, containers, and trailers. These moves highlight a shift from transactional GPS to integrated visibility ecosystems that redefine service-level contracts inside the IoT powered logistics market.
Explosive E-commerce Pushing Last-mile Efficiency
Global parcel volumes soared alongside EUR 5.7 trillion online retail projections for 2028. Route optimization engines blending IoT telemetry with AI dispatch cut idle miles and fuel burn while maintaining same-day promises. Trials under the Federal Transit Administration’s Accelerating Innovative Mobility program show real-time data trimming urban delivery lateness. Widespread parcel-level monitoring now feeds micro-emissions dashboards that help carriers comply with emerging city-level carbon caps.
Declining Sensor and Connectivity Costs
Spectrum prices climbed 63% over ten years, yet unit costs per connection dropped thanks to silicon scaling and private LoRaWAN rollouts. Comparative studies confirm LoRaWAN’s superior cost-efficiency in dense hubs, whereas Sigfox excels in rural corridors. As economics improve, operators embed tags into pallets and returnable containers once deemed uneconomic, enlarging the IoT powered logistics market addressable base.
Smart-container Data-sharing Standards Emerge
The Digital Container Shipping Association and UN/CEFACT released harmonized data models and APIs for remote reefer monitoring. Mandated electronic bills of lading by 2030 convert optional digitization into compliance necessity, anchoring IoT endpoints throughout global shipping lanes. Shared governance frameworks tackle privacy while unlocking cross-border optimisation.
Restraints Impact Analysis*
| Restraint | (~) Impact on CAGR Forecast | Geographic Relevance | Impact Timeline |
|---|---|---|---|
| Cyber-security and data-privacy vulnerabilities | -1.4% | EU, North America, global | Short term (≤ 2 years) |
| Interoperability gaps and protocol fragmentation | -0.8% | Global legacy systems | Medium term (2-4 years) |
| Spectrum re-farming lifts LPWAN operating costs | -0.6% | North America, EU | Medium term (2-4 years) |
| Shortage of edge-computing talent at 3PLs | -0.5% | Developed markets | Long term (≥ 4 years) |
| Source: Mordor Intelligence | |||
Cyber-security and Data-privacy Vulnerabilities
NIST notes that limited processing power hinders robust encryption on long-life IoT sensors, while mandatory electronic logging devices create unavoidable attack vectors. FMCSA guidelines warn that aftermarket retrofits routinely expose fleets to remote code intrusion. A single compromised tag can escalate into network-wide breaches, risking downtime penalties and regulatory fines that weigh on the IoT-powered logistics market.
Interoperability Gaps and Protocol Fragmentation
AIOTI lists high-priority standardization gaps, observing that divergent data schemas lock operators into single-vendor stacks. ETSI reviews reveal more than 30 overlapping protocols, burdening SMEs with parallel integrations they cannot maintain. Lack of plug-and-play interfaces slows hyper-scaling opportunities and raises the total cost of ownership inside the IoT powered logistics market.
*Our forecasts treat driver/restraint impacts as directional, not additive. The impact forecasts reflect baseline growth, mix effects, and variable interactions.
Segment Analysis
By Component: Hardware Dominance Spurs Services Upswing
Hardware contributed 43.27% of the IoT powered logistics market size in 2024, underscoring the necessity for millions of sensors, gateways, and ruggedized edge servers across fleets and facilities. Yet, service revenue is climbing at a 12.57% CAGR as operators favor subscription models bundling connectivity, analytics, and uptime guarantees.
The growth trajectory illustrates a pivot toward outcomes over ownership. Powerfleet’s acquisition spree highlights how device suppliers climb the stack to capture higher-margin managed services.[2]Powerfleet Inc., “Powerfleet Announces Strategic Acquisition of Fleet Complete,” powerfleet.comSimultaneously, logistics customers hand off complexity, accelerating the IoT powered logistics market momentum toward full-service arrangements that deliver predictive maintenance and real-time compliance dashboards.


By Application: Fleet Maturity Enables Asset-tracking Momentum
Fleet management held 32.47% of the IoT powered logistics market share in 2024, due to the established ELD mandates and driver-safety compliance. Asset tracking now registers a 14.63% CAGR, fueled by semiconductor and pharma supply chains demanding condition monitoring.
Mature telematics platforms act as launchpads for adjacent applications such as cold-chain assurance and network optimization. Data from reefers and pallets feed AI engines that model disruption scenarios, reducing spoilage. The cross-selling effect supports multi-application adoption, broadening total addressable revenue inside the IoT powered logistics market.
By Connectivity Technology: Cellular Preeminence Meets Satellite Expansion
Cellular networks, spanning 3G to 5G NB-IoT, accounted for 54.32% of the IoT powered logistics market size in 2024, leveraging extensive coverage and carrier partnerships. Satellite and hybrid solutions grow at 13.37% CAGR, propelled by LEO constellations offering direct-to-device links where terrestrial signals fail.
Rising spectrum fees and remote-route gaps spur interest in dual-mode modems that roam seamlessly between 5G and space assets. Maritime corridors and polar supply chains particularly benefit, widening geographic scope and resilience of the IoT powered logistics market.
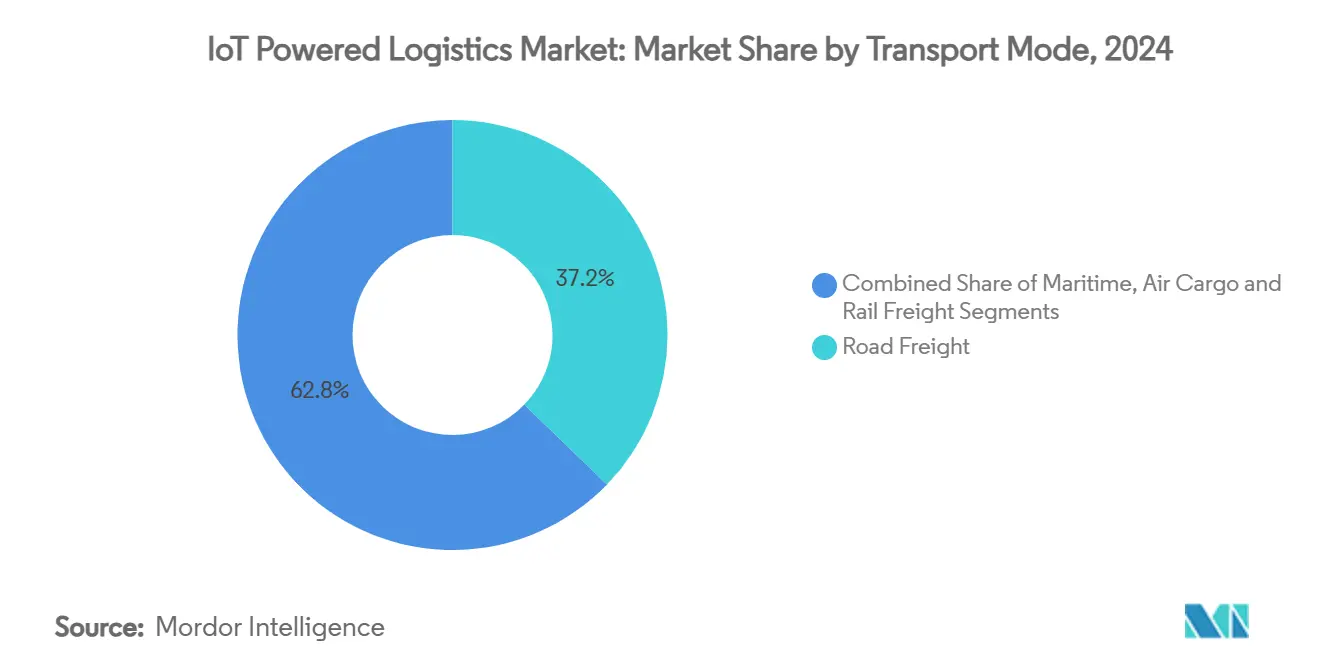
By Transport Mode: Road Scale Contrasts Rail Acceleration
Road freight generated 37.24% of the 2024 value, mirroring the sheer volume of trucking and long-haul routes. Rail freight, backed by USD 59 million in U.S. research funding, expands at a 12.64% CAGR as IoT predictive analytics extend wheelset life and mitigate derailments.
Road applications center on fuel economy, driver behavior, and emission compliance, whereas rail innovates through positive train control upgrades and wagon health sensors. The differing pain points diversify solution portfolios inside the IoT powered logistics market.
By End-User: Retail Dominance Encourages Healthcare Uptake
Retail and e-commerce retained 32.46% in 2024 after parcel volumes leaped 45% since 2019. Healthcare and pharmaceuticals advance at a 13.23% CAGR as FDA and EMA guidelines demand traceable, temperature-controlled transit.
Cold-chain platforms employing MQTT cut battery drain 30% relative to HTTP while sustaining real-time visibility.[3]Jara Ochoa et al., “Comparative Analysis of MQTT and HTTP,” mdpi.comThe stringent regulatory backdrop quickens device deployments, widening the IoT powered logistics market coverage into high-value, life-critical shipments.
Geography Analysis
North America secured 41.73% of 2024 revenue, anchored by mature 3PL networks, strict ELD regulation, and early sensor adoption across truckload fleets. Government initiatives such as the FCC’s supplemental coverage from space and smart infrastructure grants further deepen digital logistics ecosystems.
Asia-Pacific is advancing at a 14.93% CAGR, powered by 270 million licensed cellular IoT links expected by 2030 and smart-port reforms in China, India, and South Korea. Regional governments earmark budgets for port community systems and 5G private networks, integrating crane telemetry, yard automation, and customs clearance applications that expand the IoT powered logistics market footprint.
Europe maintains strong momentum through regulatory leadership in data privacy and sustainability. DCSA-aligned smart-container initiatives and EU Scope 3 reporting rules make digital twins compulsory for carriers. Harmonized standards cultivate cross-border transparency, reinforcing the IoT powered logistics industry’s move toward interoperable, low-emission freight networks.

Competitive Landscape
The IoT powered logistics market features moderate fragmentation. Established telematics vendors dominate fleet monitoring, while newer entrants target condition tracking, satellite connectivity, and edge analytics niches. Hardware suppliers such as Powerfleet integrate software via acquisitions to secure recurring revenue, whereas telecom operators bundle 5G and LPWAN access into managed services.
Technology differentiation hinges on analytics sophistication, cyber-secure architecture, and ability to guarantee performance outcomes. Interoperability expertise grows in value as shippers demand single dashboards covering trucks, containers, and warehouses. LEO satellite providers collaborate with chipset makers to embed dual-mode radios, challenging cellular incumbents in remote corridors. Meanwhile, AI-centric startups push inference models onto devices, reducing latency and bandwidth costs across the IoT powered logistics market.
Barriers to entry stem from spectrum licensing, integration with legacy TMS/WMS platforms, and the need for domain-specific knowledge about transport regulations. Despite fragmentation by vertical, rising M&A indicates gradual consolidation around full-stack service portfolios capable of meeting end-to-end visibility mandates.
IoT Powered Logistics Industry Leaders
Cisco Systems, Inc.
International Business Machines Corporation
SAP SE
Honeywell International Inc.
ORBCOMM Inc.
- *Disclaimer: Major Players sorted in no particular order

Recent Industry Developments
- January 2025: FCC proposed a new framework for broadband services in the 896-901/935-940 MHz band, opening additional capacity for LPWAN logistics deployments.
- December 2024: Nippon Express Holdings partnered with Tive to deliver 5G-enabled monitoring for semiconductor cargo worldwide.
- December 2024: FCC adjusted emissions limits in 24 GHz bands to align with WRC-19 rulings, affecting short-range IoT backhaul used in warehouses.
- October 2024: Power fleet closed a USD 200 million purchase of Fleet Complete, creating a combined 2.6 million-subscriber telematics platform.


Global IoT Powered Logistics Market Report Scope
| Hardware |
| Software |
| Services |
| Fleet Management |
| Asset Tracking and Monitoring |
| Warehouse and Inventory Management |
| Route and Network Optimization |
| Cold-Chain and Condition Monitoring |
| Other Applications |
| Cellular (3G/4G/5G, LTE-M, NB-IoT) |
| LPWAN (LoRaWAN, Sigfox, Wirepas) |
| Satellite and Hybrid |
| Wi-Fi / Bluetooth / UWB |
| Road Freight |
| Maritime |
| Air Cargo |
| Rail Freight |
| Retail and E-commerce |
| Food and Beverage |
| Healthcare and Pharma |
| Automotive and Industrial Manufacturing |
| Oil, Gas and Chemicals |
| Aerospace and Defense |
| Other End-Users |
| North America | United States | |
| Canada | ||
| Mexico | ||
| South America | Brazil | |
| Argentina | ||
| Rest of South America | ||
| Europe | Germany | |
| United Kingdom | ||
| France | ||
| Italy | ||
| Spain | ||
| Russia | ||
| Rest of Europe | ||
| Asia-Pacific | China | |
| India | ||
| Japan | ||
| South Korea | ||
| Australia and New Zealand | ||
| Southeast Asia | ||
| Rest of Asia-Pacific | ||
| Middle East and Africa | Middle East | Saudi Arabia |
| United Arab Emirates | ||
| Turkey | ||
| Rest of Middle East | ||
| Africa | South Africa | |
| Egypt | ||
| Rest of Africa | ||
| By Component | Hardware | ||
| Software | |||
| Services | |||
| By Application | Fleet Management | ||
| Asset Tracking and Monitoring | |||
| Warehouse and Inventory Management | |||
| Route and Network Optimization | |||
| Cold-Chain and Condition Monitoring | |||
| Other Applications | |||
| By Connectivity Technology | Cellular (3G/4G/5G, LTE-M, NB-IoT) | ||
| LPWAN (LoRaWAN, Sigfox, Wirepas) | |||
| Satellite and Hybrid | |||
| Wi-Fi / Bluetooth / UWB | |||
| By Transport Mode | Road Freight | ||
| Maritime | |||
| Air Cargo | |||
| Rail Freight | |||
| By End-User | Retail and E-commerce | ||
| Food and Beverage | |||
| Healthcare and Pharma | |||
| Automotive and Industrial Manufacturing | |||
| Oil, Gas and Chemicals | |||
| Aerospace and Defense | |||
| Other End-Users | |||
| By Geography | North America | United States | |
| Canada | |||
| Mexico | |||
| South America | Brazil | ||
| Argentina | |||
| Rest of South America | |||
| Europe | Germany | ||
| United Kingdom | |||
| France | |||
| Italy | |||
| Spain | |||
| Russia | |||
| Rest of Europe | |||
| Asia-Pacific | China | ||
| India | |||
| Japan | |||
| South Korea | |||
| Australia and New Zealand | |||
| Southeast Asia | |||
| Rest of Asia-Pacific | |||
| Middle East and Africa | Middle East | Saudi Arabia | |
| United Arab Emirates | |||
| Turkey | |||
| Rest of Middle East | |||
| Africa | South Africa | ||
| Egypt | |||
| Rest of Africa | |||


Key Questions Answered in the Report
What is the 2025 valuation of the IoT powered logistics market?
The IoT powered logistics market size reached USD 59.32 billion in 2025.
How fast will spending on IoT solutions in logistics grow through 2030?
Aggregate expenditure is forecast to rise at an 11.54% CAGR, taking the market to USD 102.42 billion by 2030.
Which component segment is expanding the quickest?
Managed IoT services record the fastest 12.57% CAGR as shippers favor outcome-based contracts.
Which region offers the highest growth potential for connected logistics?
Asia-Pacific leads with a projected 14.93% CAGR on the back of smart-port and 5G investments.
What is the chief cybersecurity challenge for logistics IoT deployments?
Limited device processing power hampers robust encryption, exposing fleets to network-wide intrusion risks.
Page last updated on:


